Comprehensive Financial Analysis Project Report: Qantas Airways
VerifiedAdded on 2020/05/16
|36
|9639
|29
Project
AI Summary
This project report provides a detailed financial analysis of Qantas Airways. It begins with an introduction to financial management and a description of Qantas Airways' operations. The report then delves into the company's ownership and governance structure, examining substantial stakeholders and key personnel. Performance ratios, including Return on Assets (ROA), Return on Equity (ROE), and debt ratios, are calculated and analyzed to assess the company's profitability and capital structure. The report also examines changes in Qantas's stock price over the past two years, comparing it with the broader Australian market, and identifies significant factors impacting the stock. Furthermore, the project calculates the Capital Asset Pricing Model (CAPM) and beta values to determine the required rate of return and assesses the cost of equity. Weighted Average Cost of Capital (WACC) calculations are presented, along with an analysis of debt and gearing ratios to evaluate the company's capital structure. Finally, the report includes a discussion of dividend policy and concludes with recommendations based on the financial analysis.
Running Head: Finance For Business
1
Project Report: Finance for business
1
Project Report: Finance for business
Paraphrase This Document
Need a fresh take? Get an instant paraphrase of this document with our AI Paraphraser
Finance For Business
2
Contents
Introduction.......................................................................................................................3
Company description........................................................................................................3
1. Ownership governance structure.............................................................................3
2. Performance ratios...................................................................................................4
3. Changes in stock price.............................................................................................6
4. Significant factors....................................................................................................7
5. Calculation of CAPM and beta values.....................................................................7
6. WACC calculations.................................................................................................8
7. Debt ratios................................................................................................................9
8. Dividend policy......................................................................................................10
9. Recommendation and Conclusion.........................................................................10
References.......................................................................................................................11
Appendix.........................................................................................................................13
Finance For Business
3
Introduction:
Financial management is a study which evaluates the financial position and the
performance of the company. In this report, firstly, financial statements of the company have
been evaluated and study of ratio analysis has been conducted to measure the main financial
figures of the company. Performance ratios have been calculated to evaluate the profitability
and capital structure position of the company. In addition, stock price of Qantas Airways
Limited of last 2 year has been analyzed and it has been compared with the stock price of all
ordinary shares of Australia. More to it, CAPM study has also been conducted to evaluate the
real worth of the company in the market. Further, WACC has been calculated to evaluate the
total cost of the company to raise the funds and make a better decision about the investment
in the company. Lastly, debt and gearing ratios have been calculated to evaluate the capital
structure of the company.
Company description:
Qantas airways are a flagship airline company. The main functions of the company are
operated through its Australian office which is at Queensland in Australia. This company has
come into existence in 1920. Various subsidiary companies are managed by the company to
operate and administer its business. Further, the company has largest share in the Australian
domestic market (Investors, 2018). Accoridng to a current report, 65% share of Australian
airlines are held by the Qantas Airways. Currently, the company has diversified its market to
manage the performance and the position of the company.
1. Ownership governance structure:
It is required for every company and the stakeholders of the company to evaluate and
identify the performance and the position of the company through evaluating the governance
structure of the company and the changes into the management of the company from last
year. This study makes it easy for the company to manage the position and the worth of the
company in the market. Further, this study explains that how many people owned to the
company and how much stock is held by them. Following is the details of the company:
Substantial stakeholders:
Annual report of the company has been evaluated to identify the performance of the
company and through the study; it has been found that there is not stockholder in the
⊘ This is a preview!⊘
Do you want full access?
Subscribe today to unlock all pages.
Trusted by 1+ million students worldwide
Finance For Business
4
company who has more than 20% stock in the total ownership of the company. Further, it
explains that the company has not any investor who has invested more than 5% in the stock
of the company (Annual Report, 2017).
Main people:
More, the main people of the company have also been evaluated and it has been
found that the Alan Joyce is the CEO of the company and he has changed various operations
of the company from its joining. Further, it has also been found that the Leigh Clifford is the
chairman of the company and it has also been explained that the company has not any main
people who has invested more than 5% in the stock of the company.
2. Performance ratios:
Performance ratios are the study which is conducted by teh companies and all the
parties which are related to the company to evaluate that how the position of the company in
current scenario. What are the changes which must be done by the company to enhance its
performance? Performance ratios make it easy for the company to manage the position in the
market (Hogarth and Makridakis, 2011). For this report, ROA, ROE and debt ratios have
been calculated. The study of them is as follows:
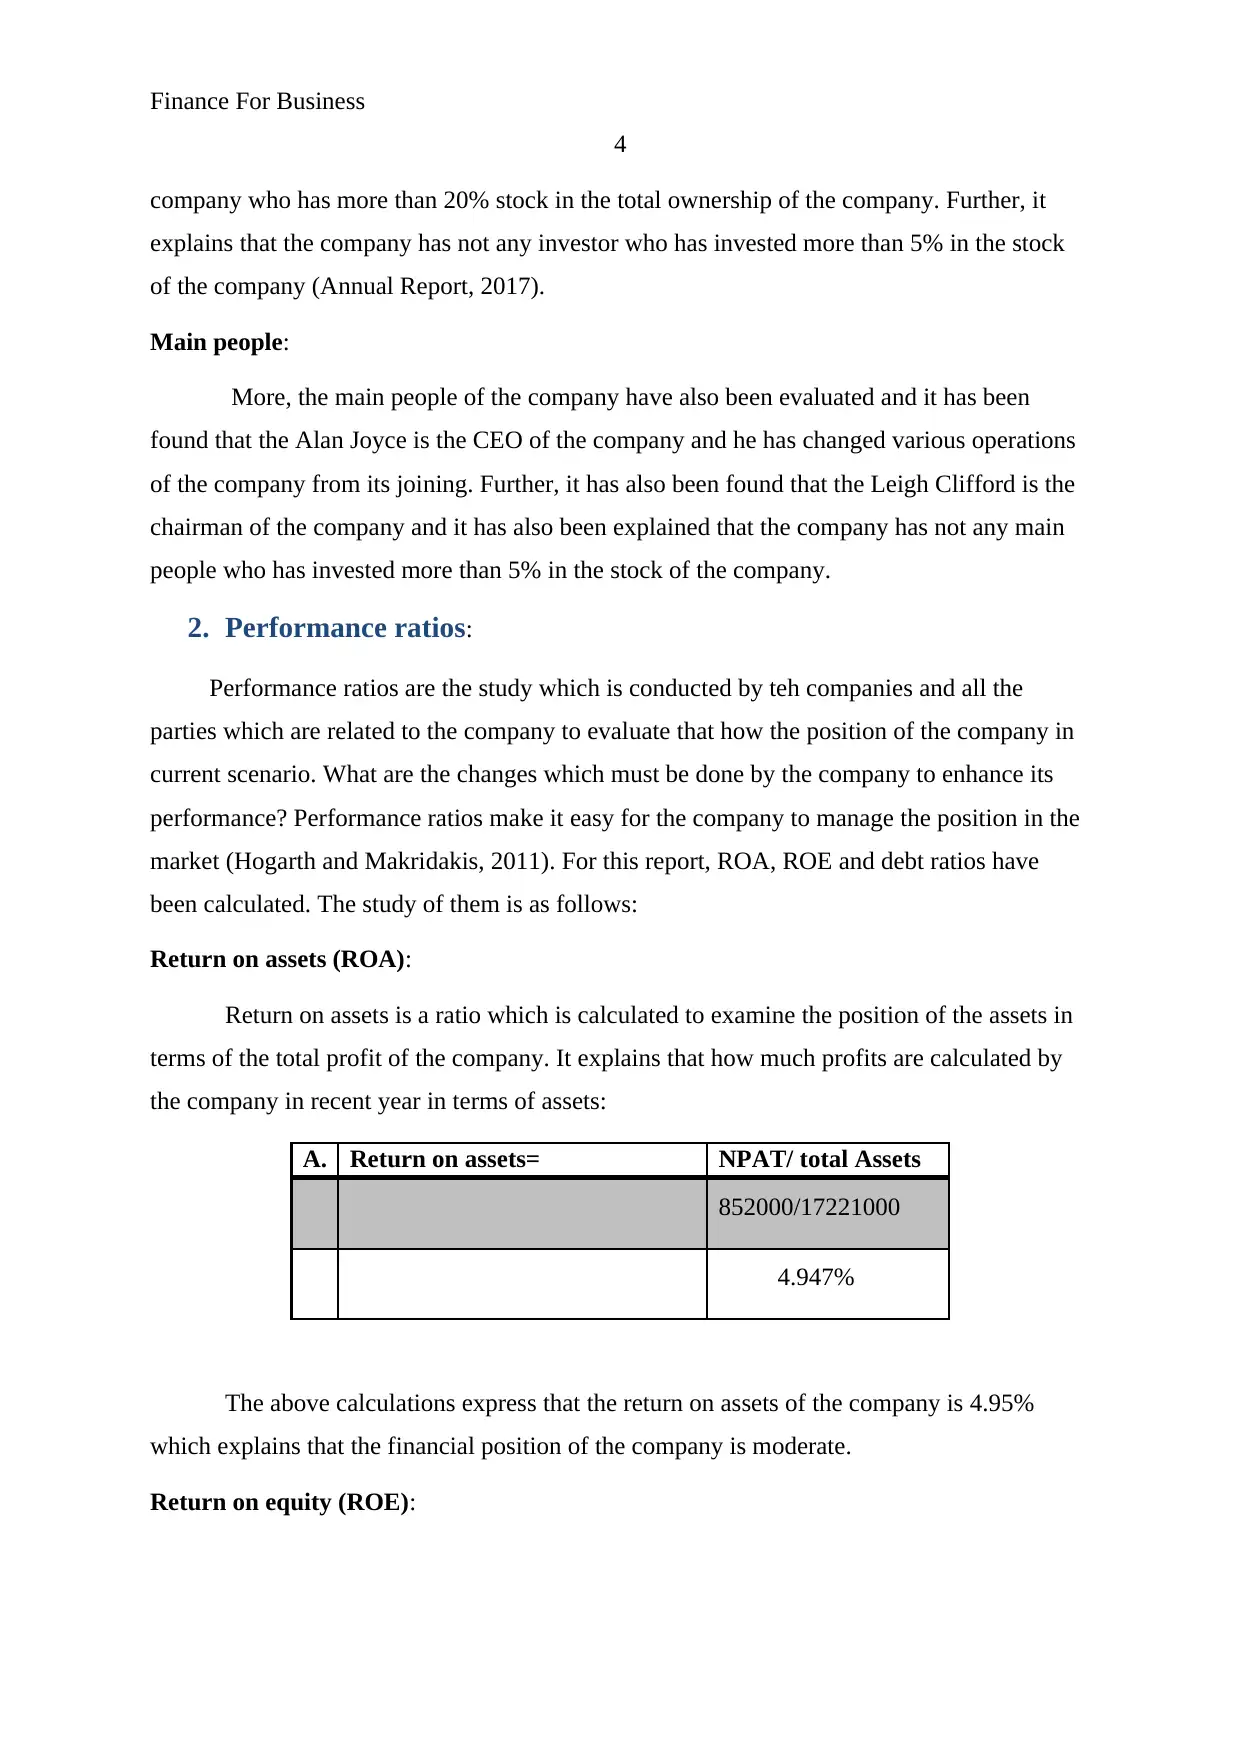
Return on assets (ROA):
Return on assets is a ratio which is calculated to examine the position of the assets in
terms of the total profit of the company. It explains that how much profits are calculated by
the company in recent year in terms of assets:
A. Return on assets= NPAT/ total Assets
852000/17221000
4.947%
The above calculations express that the return on assets of the company is 4.95%
which explains that the financial position of the company is moderate.
Return on equity (ROE):
4
company who has more than 20% stock in the total ownership of the company. Further, it
explains that the company has not any investor who has invested more than 5% in the stock
of the company (Annual Report, 2017).
Main people:
More, the main people of the company have also been evaluated and it has been
found that the Alan Joyce is the CEO of the company and he has changed various operations
of the company from its joining. Further, it has also been found that the Leigh Clifford is the
chairman of the company and it has also been explained that the company has not any main
people who has invested more than 5% in the stock of the company.
2. Performance ratios:
Performance ratios are the study which is conducted by teh companies and all the
parties which are related to the company to evaluate that how the position of the company in
current scenario. What are the changes which must be done by the company to enhance its
performance? Performance ratios make it easy for the company to manage the position in the
market (Hogarth and Makridakis, 2011). For this report, ROA, ROE and debt ratios have
been calculated. The study of them is as follows:
Return on assets (ROA):
Return on assets is a ratio which is calculated to examine the position of the assets in
terms of the total profit of the company. It explains that how much profits are calculated by
the company in recent year in terms of assets:
A. Return on assets= NPAT/ total Assets
852000/17221000
4.947%
The above calculations express that the return on assets of the company is 4.95%
which explains that the financial position of the company is moderate.
Return on equity (ROE):
Paraphrase This Document
Need a fresh take? Get an instant paraphrase of this document with our AI Paraphraser
Finance For Business
5
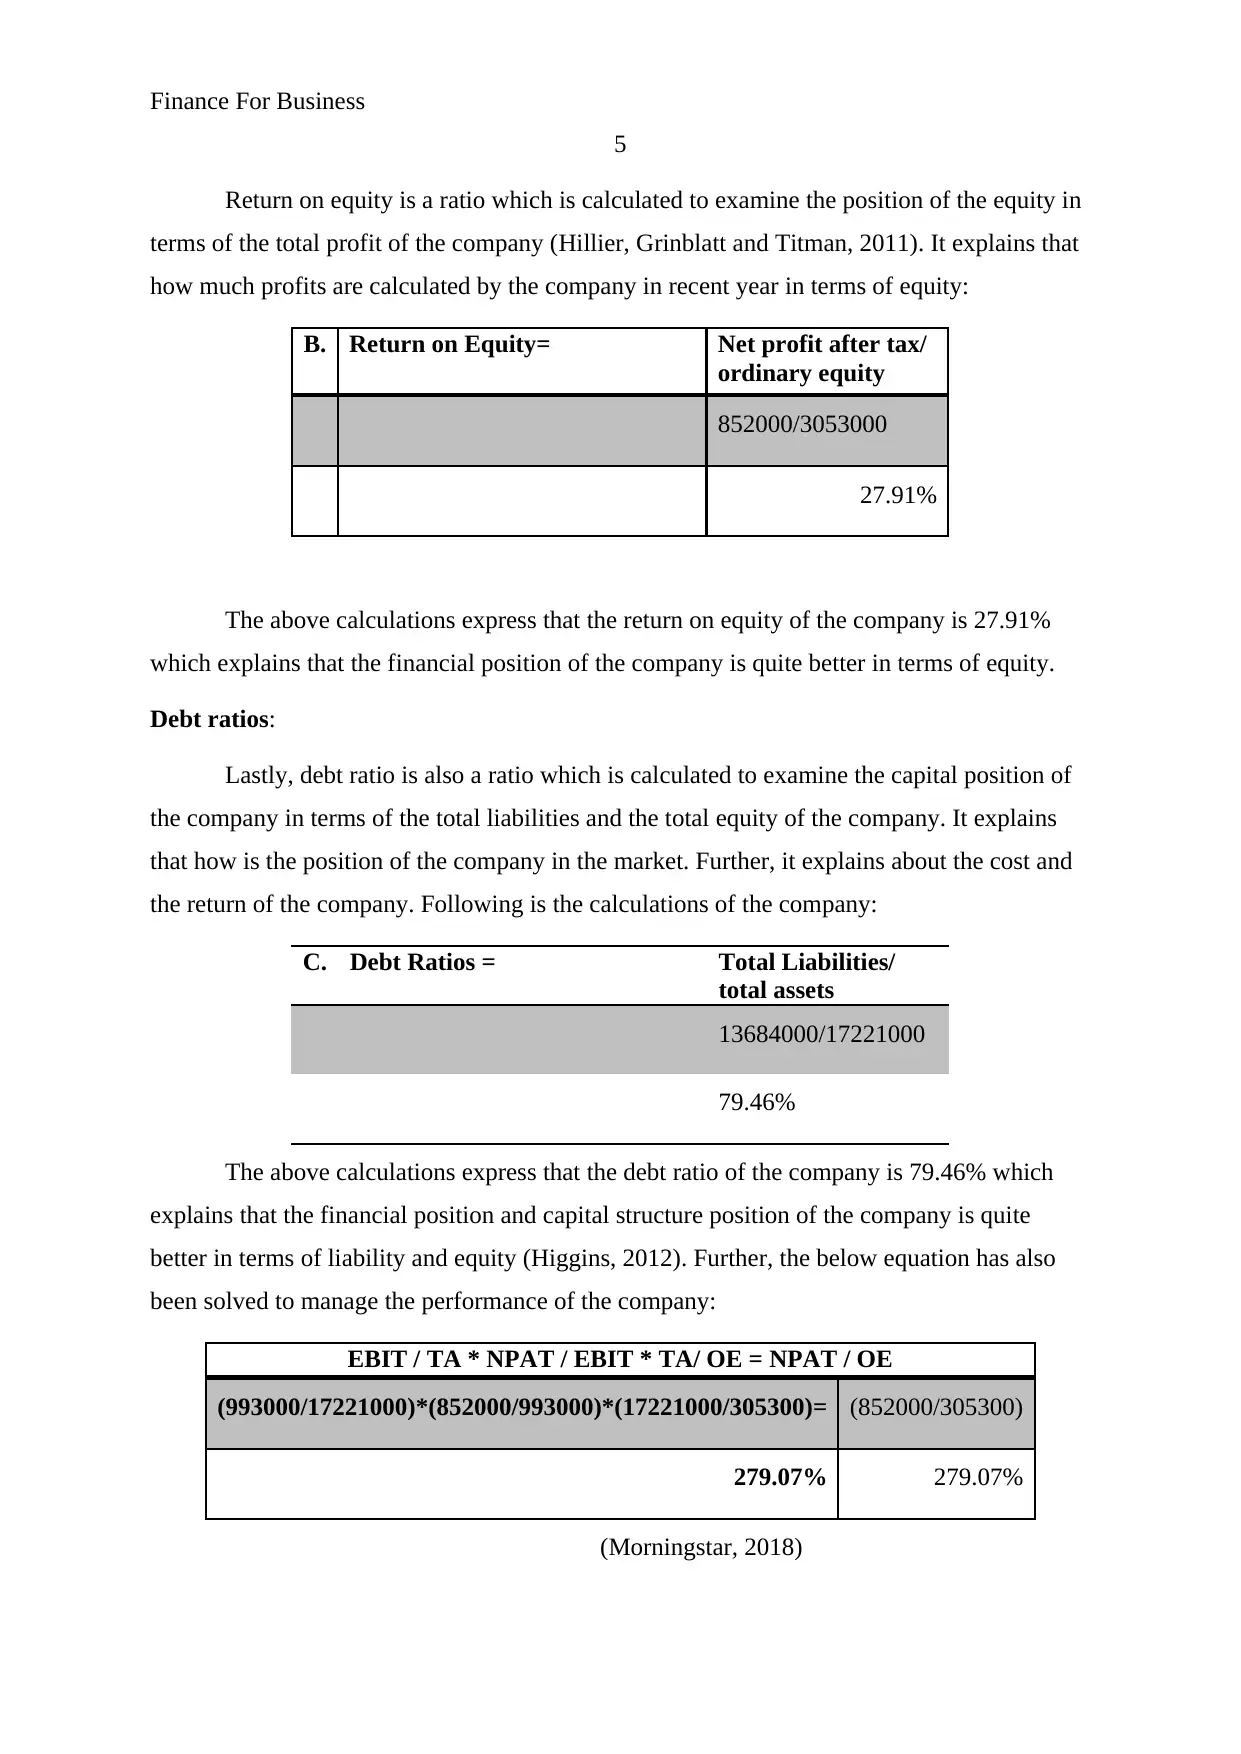
Return on equity is a ratio which is calculated to examine the position of the equity in
terms of the total profit of the company (Hillier, Grinblatt and Titman, 2011). It explains that
how much profits are calculated by the company in recent year in terms of equity:
B. Return on Equity= Net profit after tax/
ordinary equity
852000/3053000
27.91%
The above calculations express that the return on equity of the company is 27.91%
which explains that the financial position of the company is quite better in terms of equity.
Debt ratios:
Lastly, debt ratio is also a ratio which is calculated to examine the capital position of
the company in terms of the total liabilities and the total equity of the company. It explains
that how is the position of the company in the market. Further, it explains about the cost and
the return of the company. Following is the calculations of the company:
C. Debt Ratios = Total Liabilities/
total assets
13684000/17221000
79.46%
The above calculations express that the debt ratio of the company is 79.46% which
explains that the financial position and capital structure position of the company is quite
better in terms of liability and equity (Higgins, 2012). Further, the below equation has also
been solved to manage the performance of the company:
EBIT / TA * NPAT / EBIT * TA/ OE = NPAT / OE
(993000/17221000)*(852000/993000)*(17221000/305300)= (852000/305300)
279.07% 279.07%
(Morningstar, 2018)
5
Return on equity is a ratio which is calculated to examine the position of the equity in
terms of the total profit of the company (Hillier, Grinblatt and Titman, 2011). It explains that
how much profits are calculated by the company in recent year in terms of equity:
B. Return on Equity= Net profit after tax/
ordinary equity
852000/3053000
27.91%
The above calculations express that the return on equity of the company is 27.91%
which explains that the financial position of the company is quite better in terms of equity.
Debt ratios:
Lastly, debt ratio is also a ratio which is calculated to examine the capital position of
the company in terms of the total liabilities and the total equity of the company. It explains
that how is the position of the company in the market. Further, it explains about the cost and
the return of the company. Following is the calculations of the company:
C. Debt Ratios = Total Liabilities/
total assets
13684000/17221000
79.46%
The above calculations express that the debt ratio of the company is 79.46% which
explains that the financial position and capital structure position of the company is quite
better in terms of liability and equity (Higgins, 2012). Further, the below equation has also
been solved to manage the performance of the company:
EBIT / TA * NPAT / EBIT * TA/ OE = NPAT / OE
(993000/17221000)*(852000/993000)*(17221000/305300)= (852000/305300)
279.07% 279.07%
(Morningstar, 2018)
Finance For Business
6
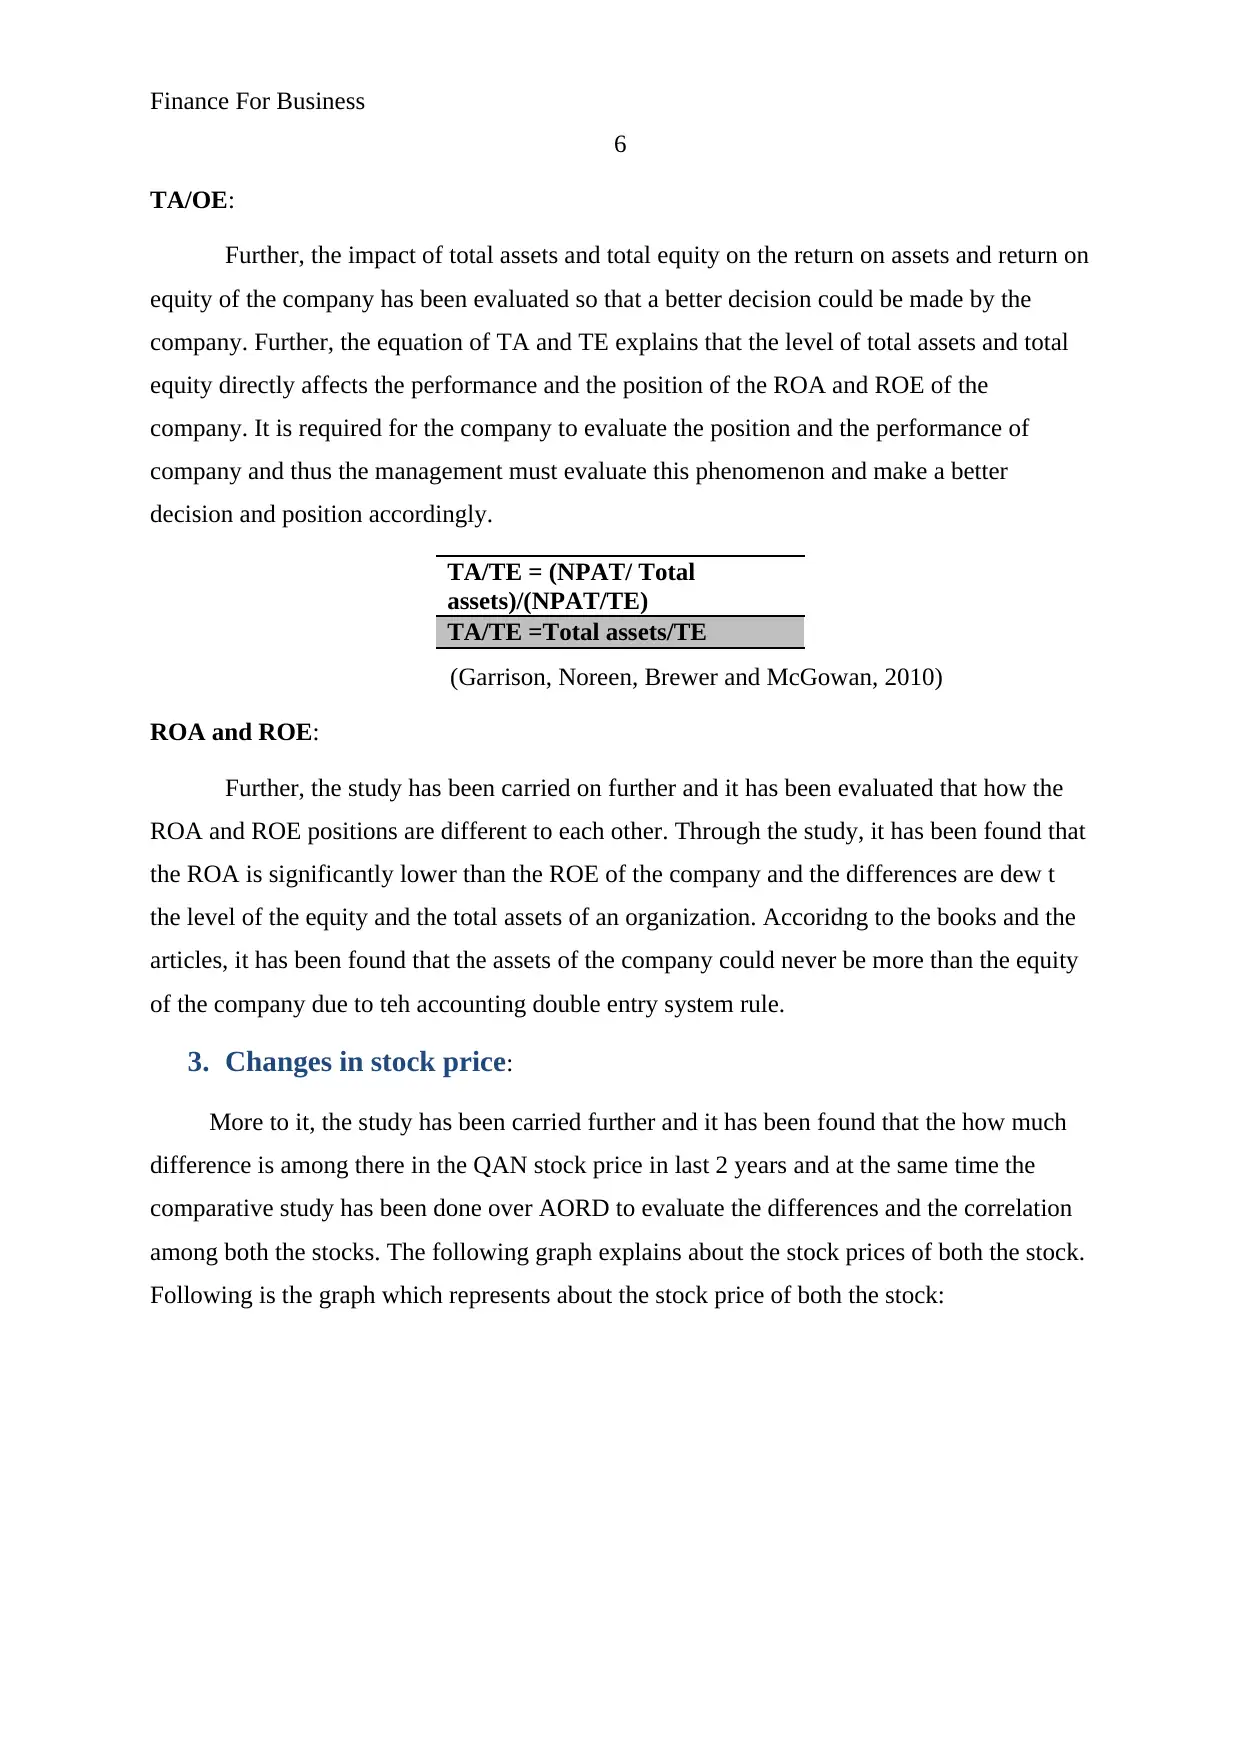
TA/OE:
Further, the impact of total assets and total equity on the return on assets and return on
equity of the company has been evaluated so that a better decision could be made by the
company. Further, the equation of TA and TE explains that the level of total assets and total
equity directly affects the performance and the position of the ROA and ROE of the
company. It is required for the company to evaluate the position and the performance of
company and thus the management must evaluate this phenomenon and make a better
decision and position accordingly.
TA/TE = (NPAT/ Total
assets)/(NPAT/TE)
TA/TE =Total assets/TE
(Garrison, Noreen, Brewer and McGowan, 2010)
ROA and ROE:
Further, the study has been carried on further and it has been evaluated that how the
ROA and ROE positions are different to each other. Through the study, it has been found that
the ROA is significantly lower than the ROE of the company and the differences are dew t
the level of the equity and the total assets of an organization. Accoridng to the books and the
articles, it has been found that the assets of the company could never be more than the equity
of the company due to teh accounting double entry system rule.
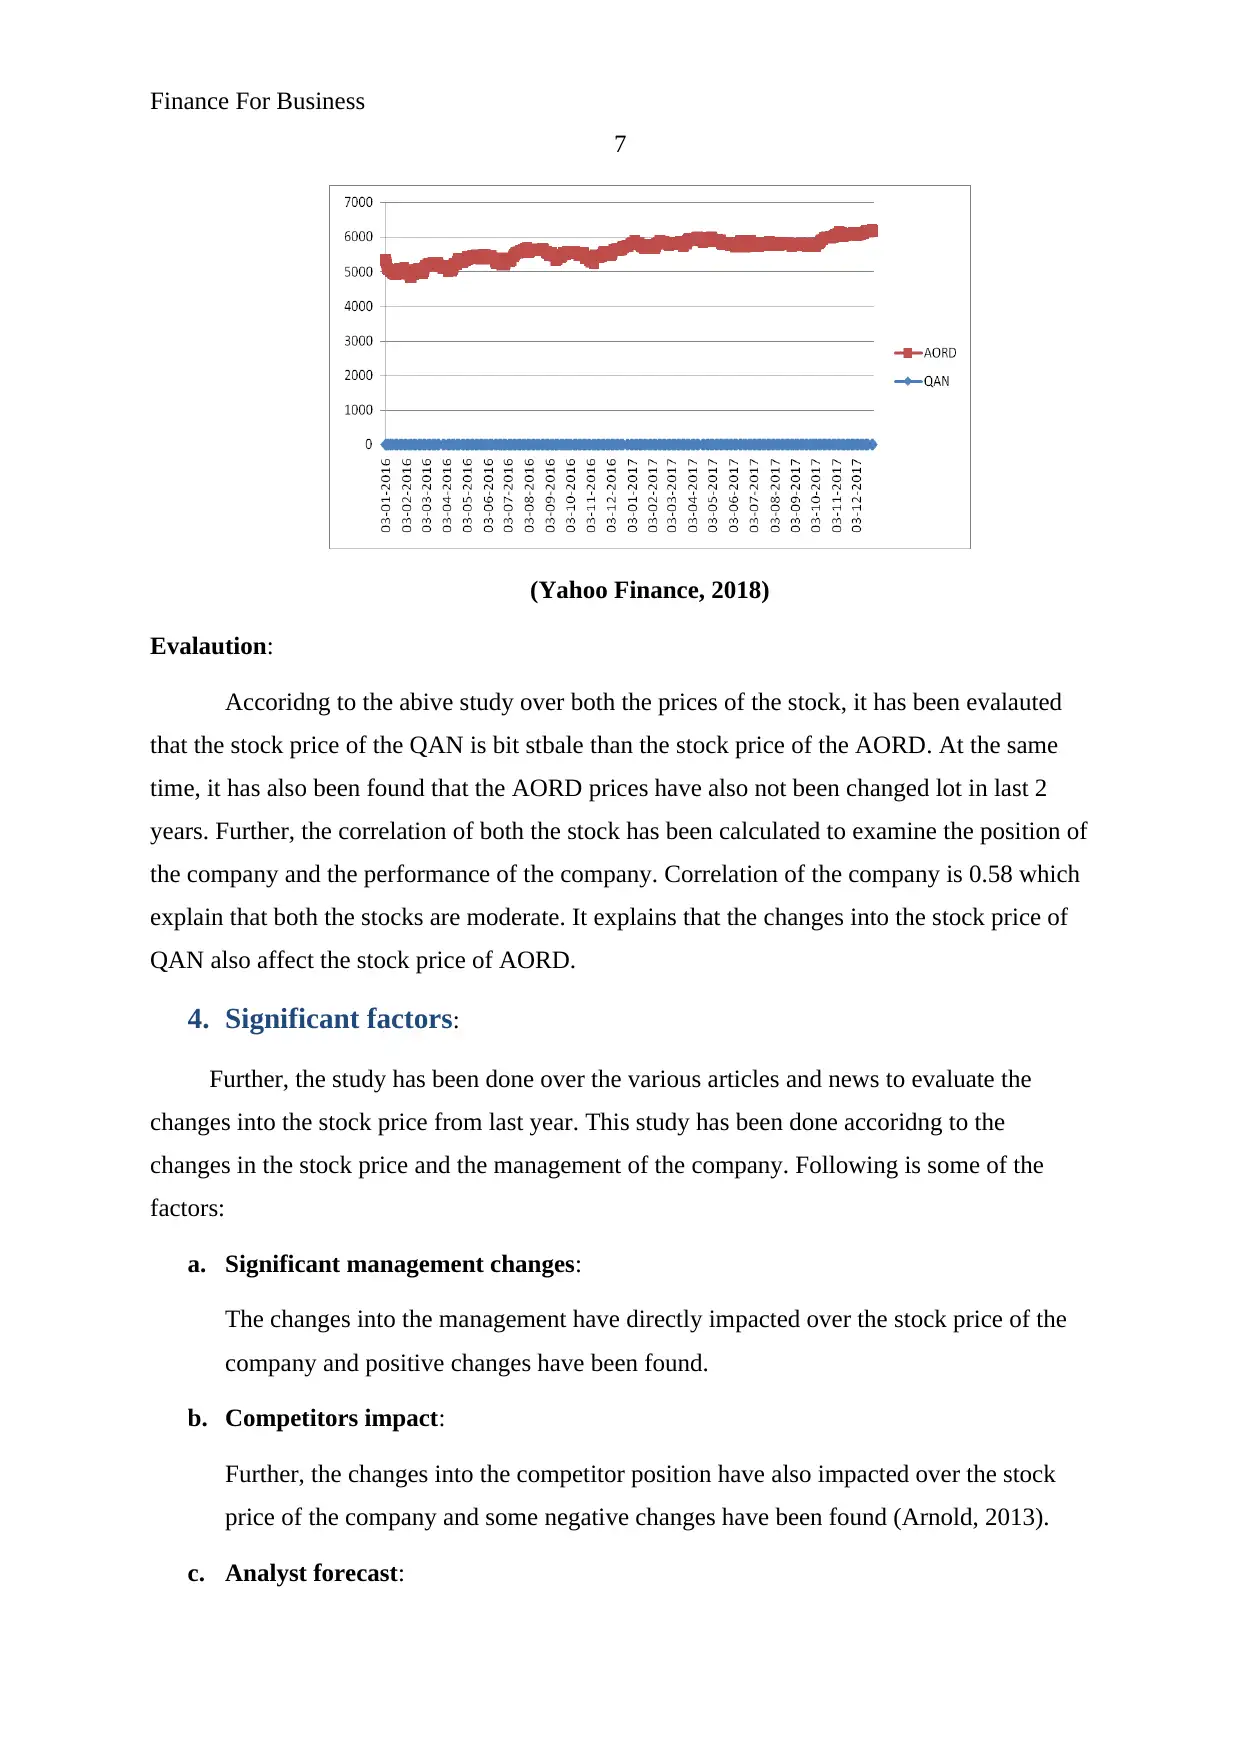
3. Changes in stock price:
More to it, the study has been carried further and it has been found that the how much
difference is among there in the QAN stock price in last 2 years and at the same time the
comparative study has been done over AORD to evaluate the differences and the correlation
among both the stocks. The following graph explains about the stock prices of both the stock.
Following is the graph which represents about the stock price of both the stock:
6
TA/OE:
Further, the impact of total assets and total equity on the return on assets and return on
equity of the company has been evaluated so that a better decision could be made by the
company. Further, the equation of TA and TE explains that the level of total assets and total
equity directly affects the performance and the position of the ROA and ROE of the
company. It is required for the company to evaluate the position and the performance of
company and thus the management must evaluate this phenomenon and make a better
decision and position accordingly.
TA/TE = (NPAT/ Total
assets)/(NPAT/TE)
TA/TE =Total assets/TE
(Garrison, Noreen, Brewer and McGowan, 2010)
ROA and ROE:
Further, the study has been carried on further and it has been evaluated that how the
ROA and ROE positions are different to each other. Through the study, it has been found that
the ROA is significantly lower than the ROE of the company and the differences are dew t
the level of the equity and the total assets of an organization. Accoridng to the books and the
articles, it has been found that the assets of the company could never be more than the equity
of the company due to teh accounting double entry system rule.
3. Changes in stock price:
More to it, the study has been carried further and it has been found that the how much
difference is among there in the QAN stock price in last 2 years and at the same time the
comparative study has been done over AORD to evaluate the differences and the correlation
among both the stocks. The following graph explains about the stock prices of both the stock.
Following is the graph which represents about the stock price of both the stock:
⊘ This is a preview!⊘
Do you want full access?
Subscribe today to unlock all pages.
Trusted by 1+ million students worldwide
Finance For Business
7
(Yahoo Finance, 2018)
Evalaution:
Accoridng to the abive study over both the prices of the stock, it has been evalauted
that the stock price of the QAN is bit stbale than the stock price of the AORD. At the same
time, it has also been found that the AORD prices have also not been changed lot in last 2
years. Further, the correlation of both the stock has been calculated to examine the position of
the company and the performance of the company. Correlation of the company is 0.58 which
explain that both the stocks are moderate. It explains that the changes into the stock price of
QAN also affect the stock price of AORD.
4. Significant factors:
Further, the study has been done over the various articles and news to evaluate the
changes into the stock price from last year. This study has been done accoridng to the
changes in the stock price and the management of the company. Following is some of the
factors:
a. Significant management changes:
The changes into the management have directly impacted over the stock price of the
company and positive changes have been found.
b. Competitors impact:
Further, the changes into the competitor position have also impacted over the stock
price of the company and some negative changes have been found (Arnold, 2013).
c. Analyst forecast:
Paraphrase This Document
Need a fresh take? Get an instant paraphrase of this document with our AI Paraphraser
Finance For Business
8
More, the news about financial position has also impacted over the stock price of the
company and some positive changes have been found.
d. Law suits:
More, the news about various law suits also impacted over the stock price of the
company and some negative and positive changes have been found (Yahoo Finance,
2018).
e. Industry wide factors:
More, the news about industry factors have also impacted over the stock price of the
company and some positive changes have been found (Baker and Nofsinger, 2010).
5. Calculation of CAPM and beta values:
Beta:
The further study explains that the beta of QAN stocks is 0.21% which explains about
the less risk of the company.
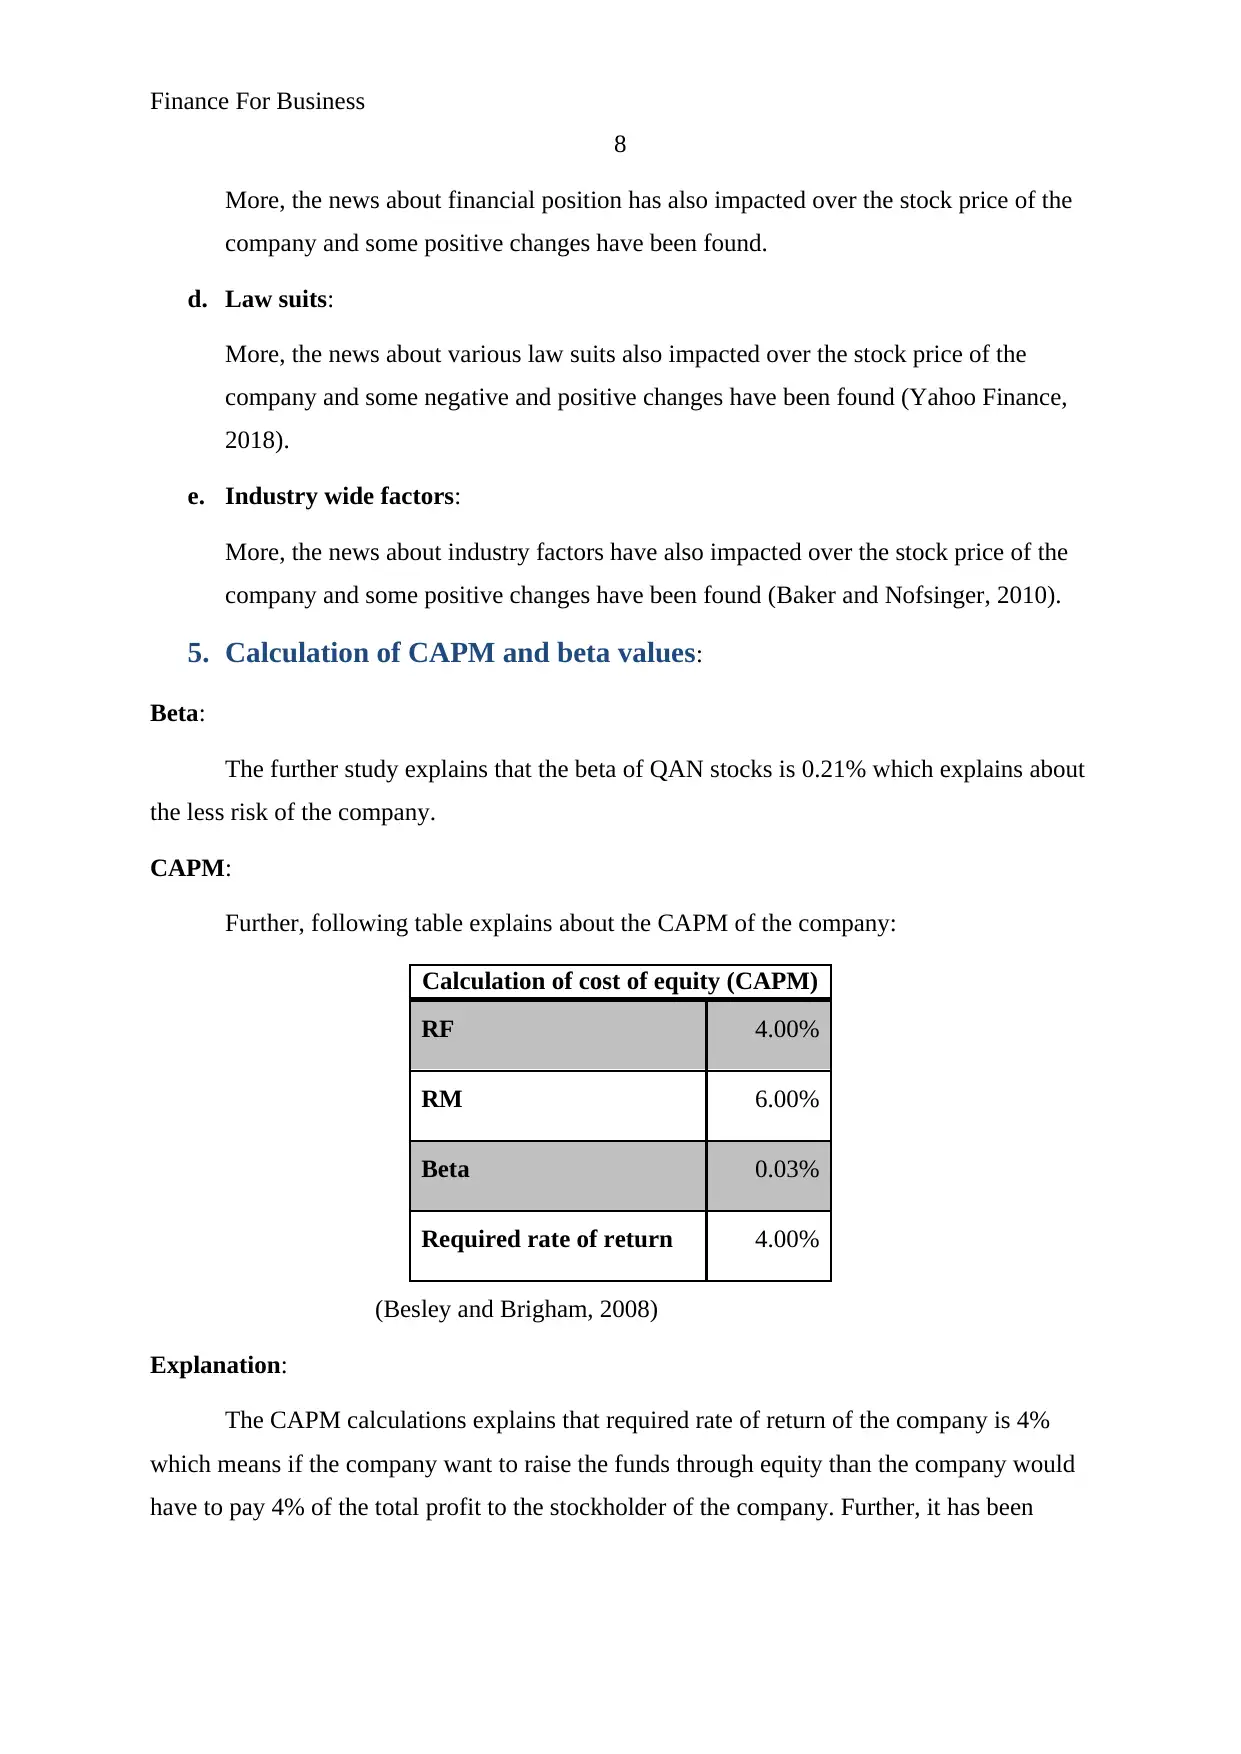
CAPM:
Further, following table explains about the CAPM of the company:
Calculation of cost of equity (CAPM)
RF 4.00%
RM 6.00%
Beta 0.03%
Required rate of return 4.00%
(Besley and Brigham, 2008)
Explanation:
The CAPM calculations explains that required rate of return of the company is 4%
which means if the company want to raise the funds through equity than the company would
have to pay 4% of the total profit to the stockholder of the company. Further, it has been
8
More, the news about financial position has also impacted over the stock price of the
company and some positive changes have been found.
d. Law suits:
More, the news about various law suits also impacted over the stock price of the
company and some negative and positive changes have been found (Yahoo Finance,
2018).
e. Industry wide factors:
More, the news about industry factors have also impacted over the stock price of the
company and some positive changes have been found (Baker and Nofsinger, 2010).
5. Calculation of CAPM and beta values:
Beta:
The further study explains that the beta of QAN stocks is 0.21% which explains about
the less risk of the company.
CAPM:
Further, following table explains about the CAPM of the company:
Calculation of cost of equity (CAPM)
RF 4.00%
RM 6.00%
Beta 0.03%
Required rate of return 4.00%
(Besley and Brigham, 2008)
Explanation:
The CAPM calculations explains that required rate of return of the company is 4%
which means if the company want to raise the funds through equity than the company would
have to pay 4% of the total profit to the stockholder of the company. Further, it has been
Finance For Business
9
found that the company should raise the funds through equity after analyzing the capital
structure of the company.
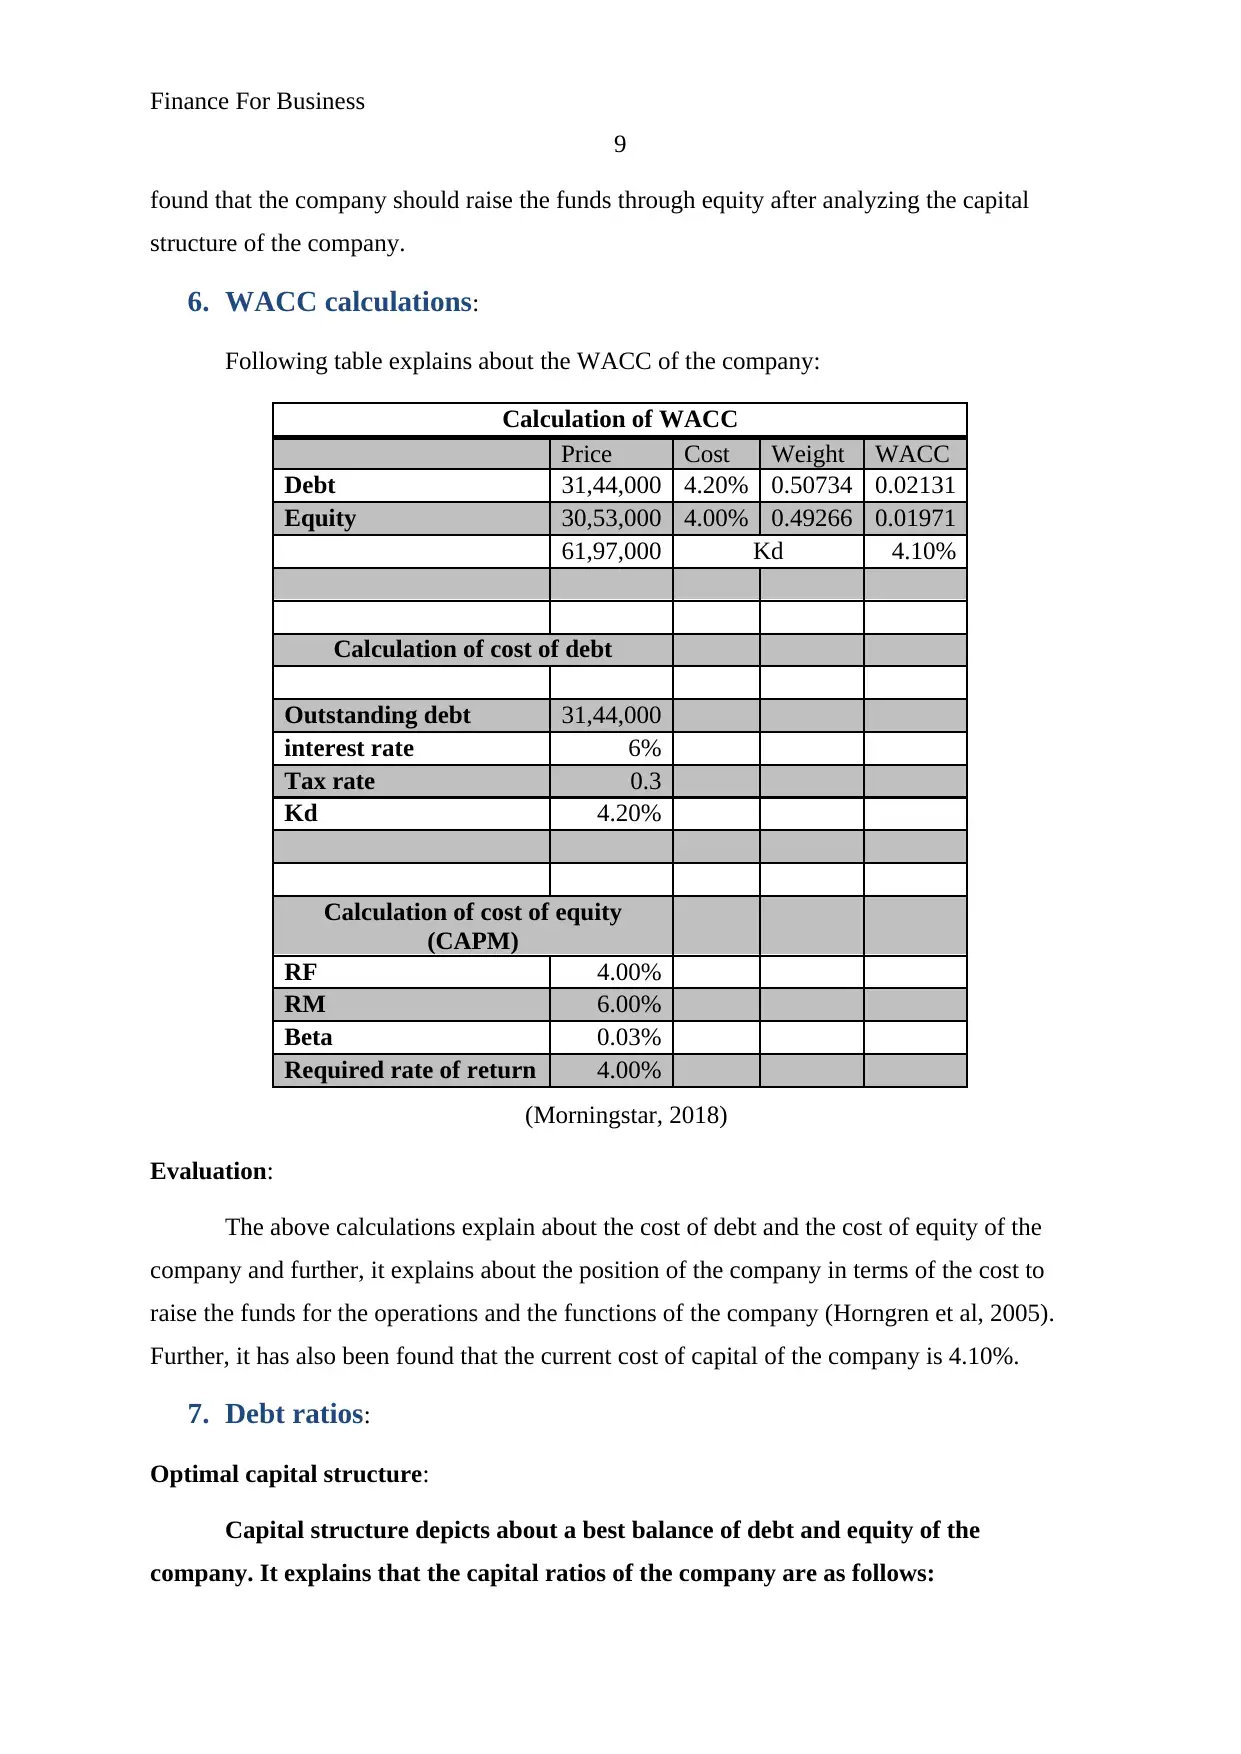
6. WACC calculations:
Following table explains about the WACC of the company:
Calculation of WACC
Price Cost Weight WACC
Debt 31,44,000 4.20% 0.50734 0.02131
Equity 30,53,000 4.00% 0.49266 0.01971
61,97,000 Kd 4.10%
Calculation of cost of debt
Outstanding debt 31,44,000
interest rate 6%
Tax rate 0.3
Kd 4.20%
Calculation of cost of equity
(CAPM)
RF 4.00%
RM 6.00%
Beta 0.03%
Required rate of return 4.00%
(Morningstar, 2018)
Evaluation:
The above calculations explain about the cost of debt and the cost of equity of the
company and further, it explains about the position of the company in terms of the cost to
raise the funds for the operations and the functions of the company (Horngren et al, 2005).
Further, it has also been found that the current cost of capital of the company is 4.10%.
7. Debt ratios:
Optimal capital structure:
Capital structure depicts about a best balance of debt and equity of the
company. It explains that the capital ratios of the company are as follows:
9
found that the company should raise the funds through equity after analyzing the capital
structure of the company.
6. WACC calculations:
Following table explains about the WACC of the company:
Calculation of WACC
Price Cost Weight WACC
Debt 31,44,000 4.20% 0.50734 0.02131
Equity 30,53,000 4.00% 0.49266 0.01971
61,97,000 Kd 4.10%
Calculation of cost of debt
Outstanding debt 31,44,000
interest rate 6%
Tax rate 0.3
Kd 4.20%
Calculation of cost of equity
(CAPM)
RF 4.00%
RM 6.00%
Beta 0.03%
Required rate of return 4.00%
(Morningstar, 2018)
Evaluation:
The above calculations explain about the cost of debt and the cost of equity of the
company and further, it explains about the position of the company in terms of the cost to
raise the funds for the operations and the functions of the company (Horngren et al, 2005).
Further, it has also been found that the current cost of capital of the company is 4.10%.
7. Debt ratios:
Optimal capital structure:
Capital structure depicts about a best balance of debt and equity of the
company. It explains that the capital ratios of the company are as follows:
⊘ This is a preview!⊘
Do you want full access?
Subscribe today to unlock all pages.
Trusted by 1+ million students worldwide
Finance For Business
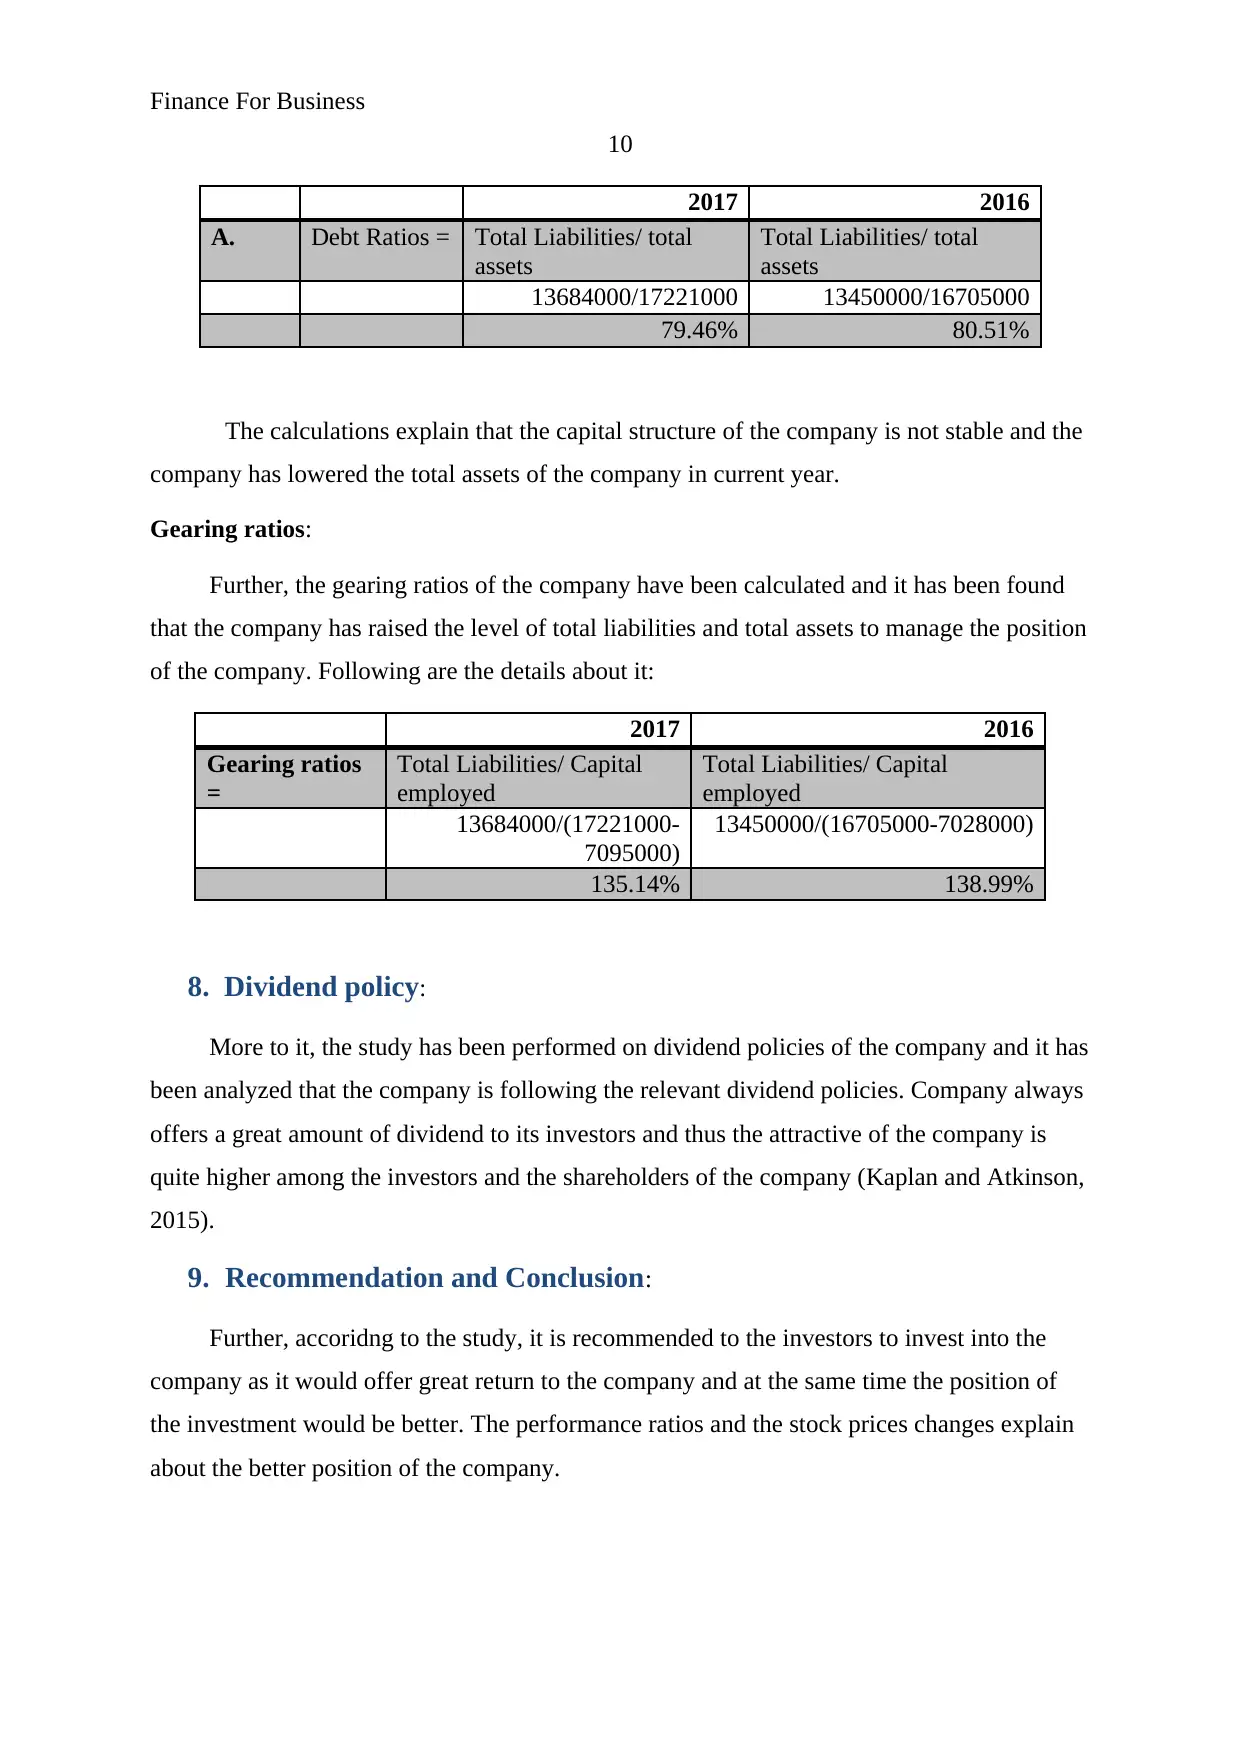
10
2017 2016
A. Debt Ratios = Total Liabilities/ total
assets
Total Liabilities/ total
assets
13684000/17221000 13450000/16705000
79.46% 80.51%
The calculations explain that the capital structure of the company is not stable and the
company has lowered the total assets of the company in current year.
Gearing ratios:
Further, the gearing ratios of the company have been calculated and it has been found
that the company has raised the level of total liabilities and total assets to manage the position
of the company. Following are the details about it:
2017 2016
Gearing ratios
=
Total Liabilities/ Capital
employed
Total Liabilities/ Capital
employed
13684000/(17221000-
7095000)
13450000/(16705000-7028000)
135.14% 138.99%
8. Dividend policy:
More to it, the study has been performed on dividend policies of the company and it has
been analyzed that the company is following the relevant dividend policies. Company always
offers a great amount of dividend to its investors and thus the attractive of the company is
quite higher among the investors and the shareholders of the company (Kaplan and Atkinson,
2015).
9. Recommendation and Conclusion:
Further, accoridng to the study, it is recommended to the investors to invest into the
company as it would offer great return to the company and at the same time the position of
the investment would be better. The performance ratios and the stock prices changes explain
about the better position of the company.
Paraphrase This Document
Need a fresh take? Get an instant paraphrase of this document with our AI Paraphraser
Finance For Business
11
References:
Ackert, L. and Deaves, R. 2009. Behavioral Finance: Psychology, Decision-Making, and
Markets. Cengage Learning.
Arnold, G., 2013. Corporate financial management. Pearson Higher Ed.
Baker, H.K. and Nofsinger, J.R. 2010. Behavioral Finance: Investors, Corporations, and
Markets. John Wiley & Sons.
Besley, S. and Brigham, E.F., 2008. Essentials of managerial finance. Thomson South-
Western.
Garrison, R.H., Noreen, E.W., Brewer, P.C. and McGowan, A., 2010. Managerial
accounting. Issues in Accounting Education, 25(4), pp.792-793.
Higgins, R. C., 2012. Analysis for financial management. McGraw-Hill/Irwin.
Hillier, D., Grinblatt, M. and Titman, S., 2011. Financial markets and corporate strategy.
McGraw Hill.
Hogarth, R.M. and Makridakis, S., 2011. Forecasting and planning: An
evaluation. Management science, 27(2), pp.115-138.
Horngren, C.T., Sundem, G.L., Stratton, W.O., Burgstahler, D. and Schatzberg, J., 2005.
Introduction to management accounting. Upper Saddle River, New Jersey: Prentice Hall.
Kaplan, R.S. and Atkinson, A.A., 2015. Advanced management accounting. PHI Learning.
Madura, J., 2011. International financial management. Cengage Learning.
Yahoo Finance. 2018. Qantas Airways Limited. viewed Jan 23, 2018,
https://in.finance.yahoo.com/quote/QAN.AX/history?
period1=1451586600&period2=1514658600&interval=1d&filter=history&frequency=1d
Morningstar. 2018. Qantas Airways Limited. viewed Jan 23, 2018,
http://financials.morningstar.com/cash-flow/cf.html?t=QAN®ion=aus&culture=en-US
Invetsors. 2018. Qantas Airways Limited. viewed Jan 23, 2018,
http://www.qantas.com/travel/airlines/investors/global/en
Finance For Business
12
Annual report. 2018. Qantas Airways Limited. viewed Jan 23, 2018,
https://www.qantas.com/infodetail/about/corporateGovernance/2016AnnualReview.pdf
12
Annual report. 2018. Qantas Airways Limited. viewed Jan 23, 2018,
https://www.qantas.com/infodetail/about/corporateGovernance/2016AnnualReview.pdf
⊘ This is a preview!⊘
Do you want full access?
Subscribe today to unlock all pages.
Trusted by 1+ million students worldwide
1 out of 36
Related Documents


Your All-in-One AI-Powered Toolkit for Academic Success.
+13062052269
info@desklib.com
Available 24*7 on WhatsApp / Email
![[object Object]](/_next/static/media/star-bottom.7253800d.svg)
Unlock your academic potential
Copyright © 2020–2026 A2Z Services. All Rights Reserved. Developed and managed by ZUCOL.