Qantas Airways Limited: Financial Analysis and Performance Report
VerifiedAdded on 2020/02/05
|15
|1613
|30
Report
AI Summary
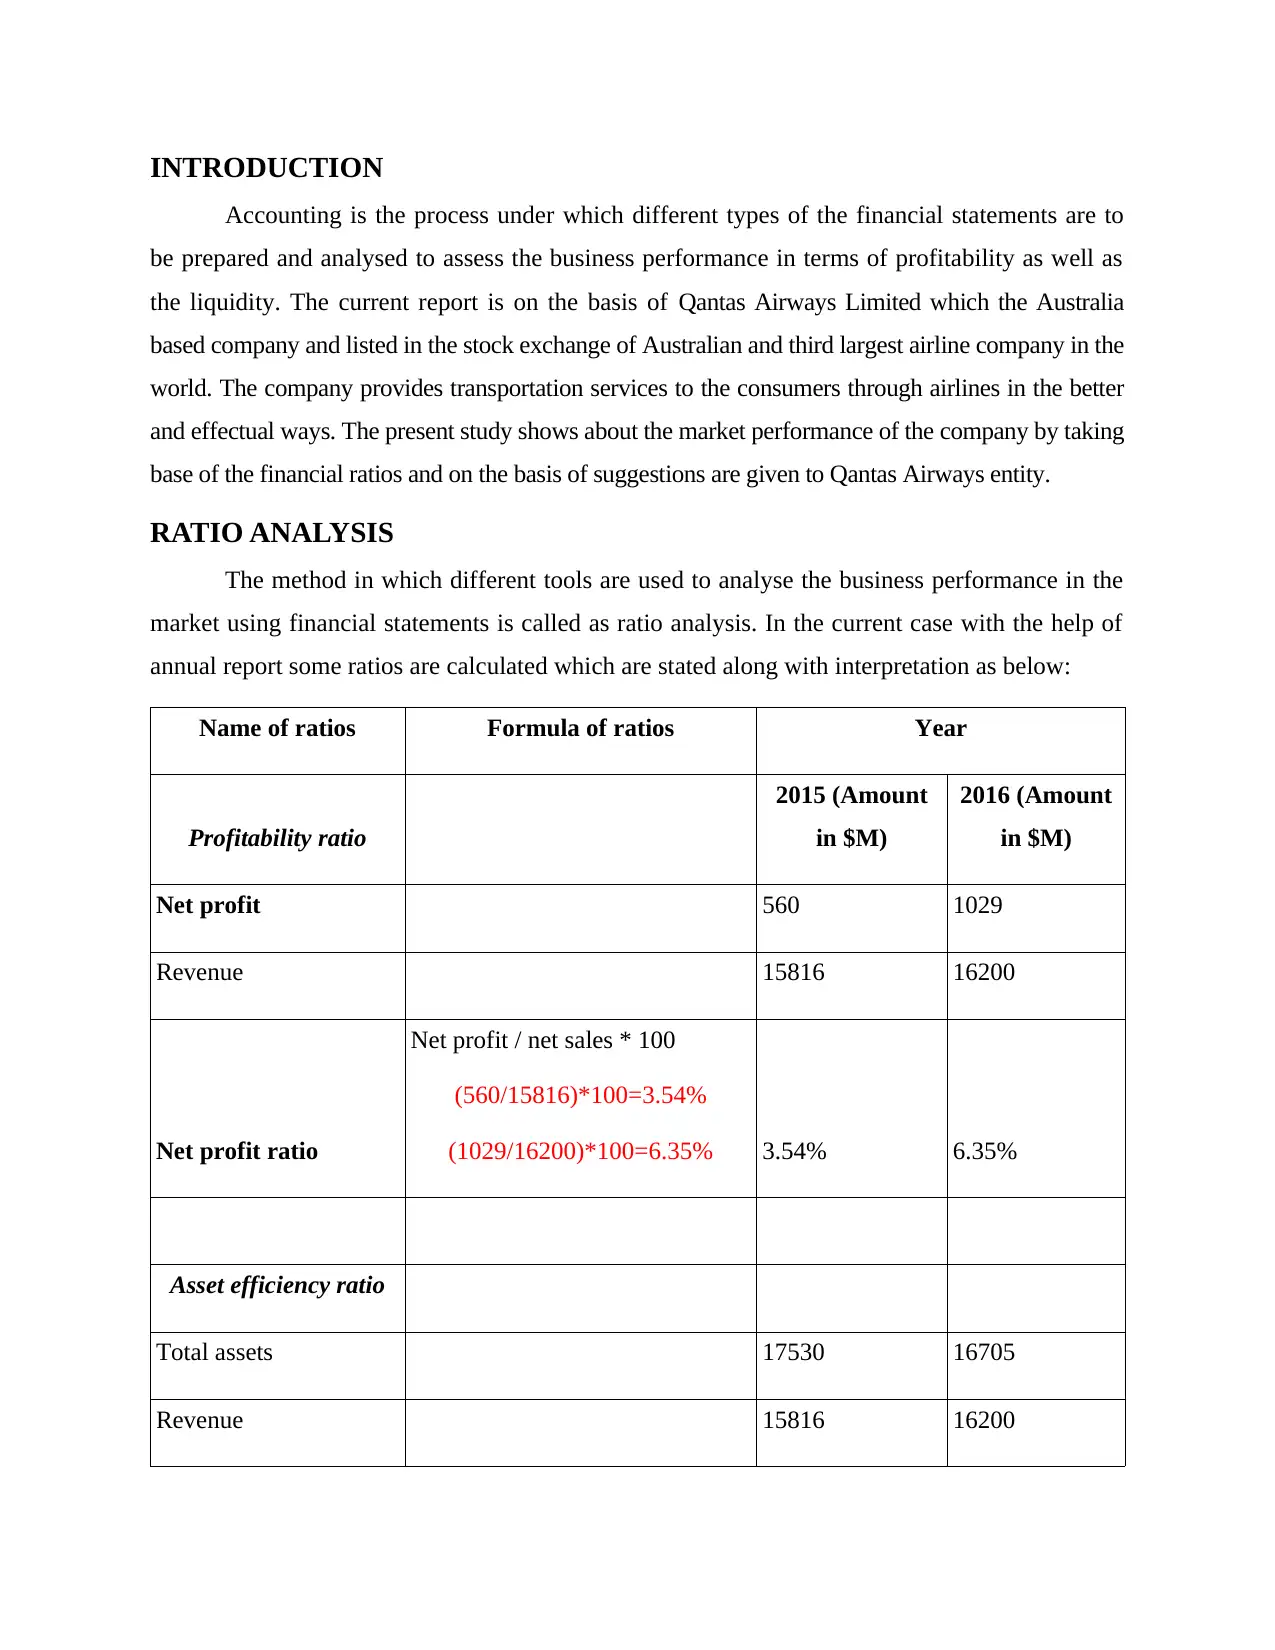
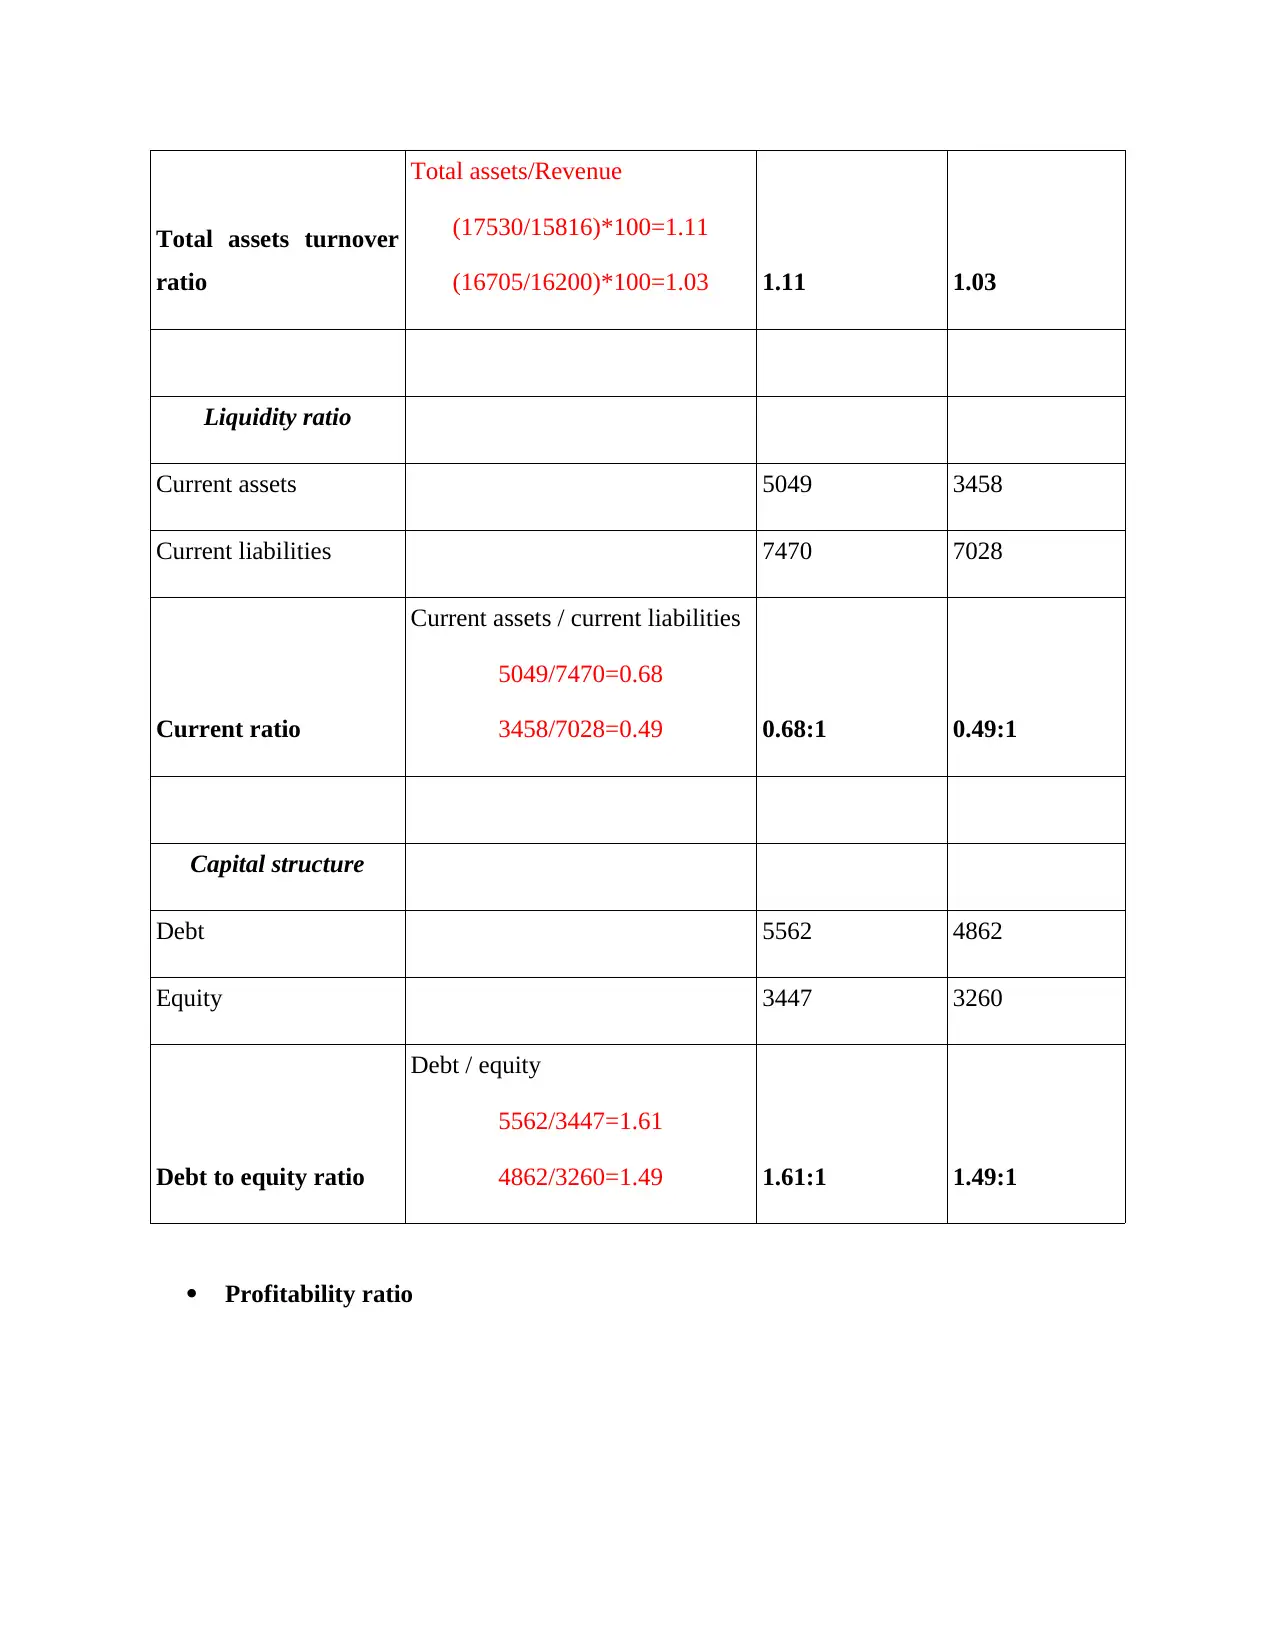
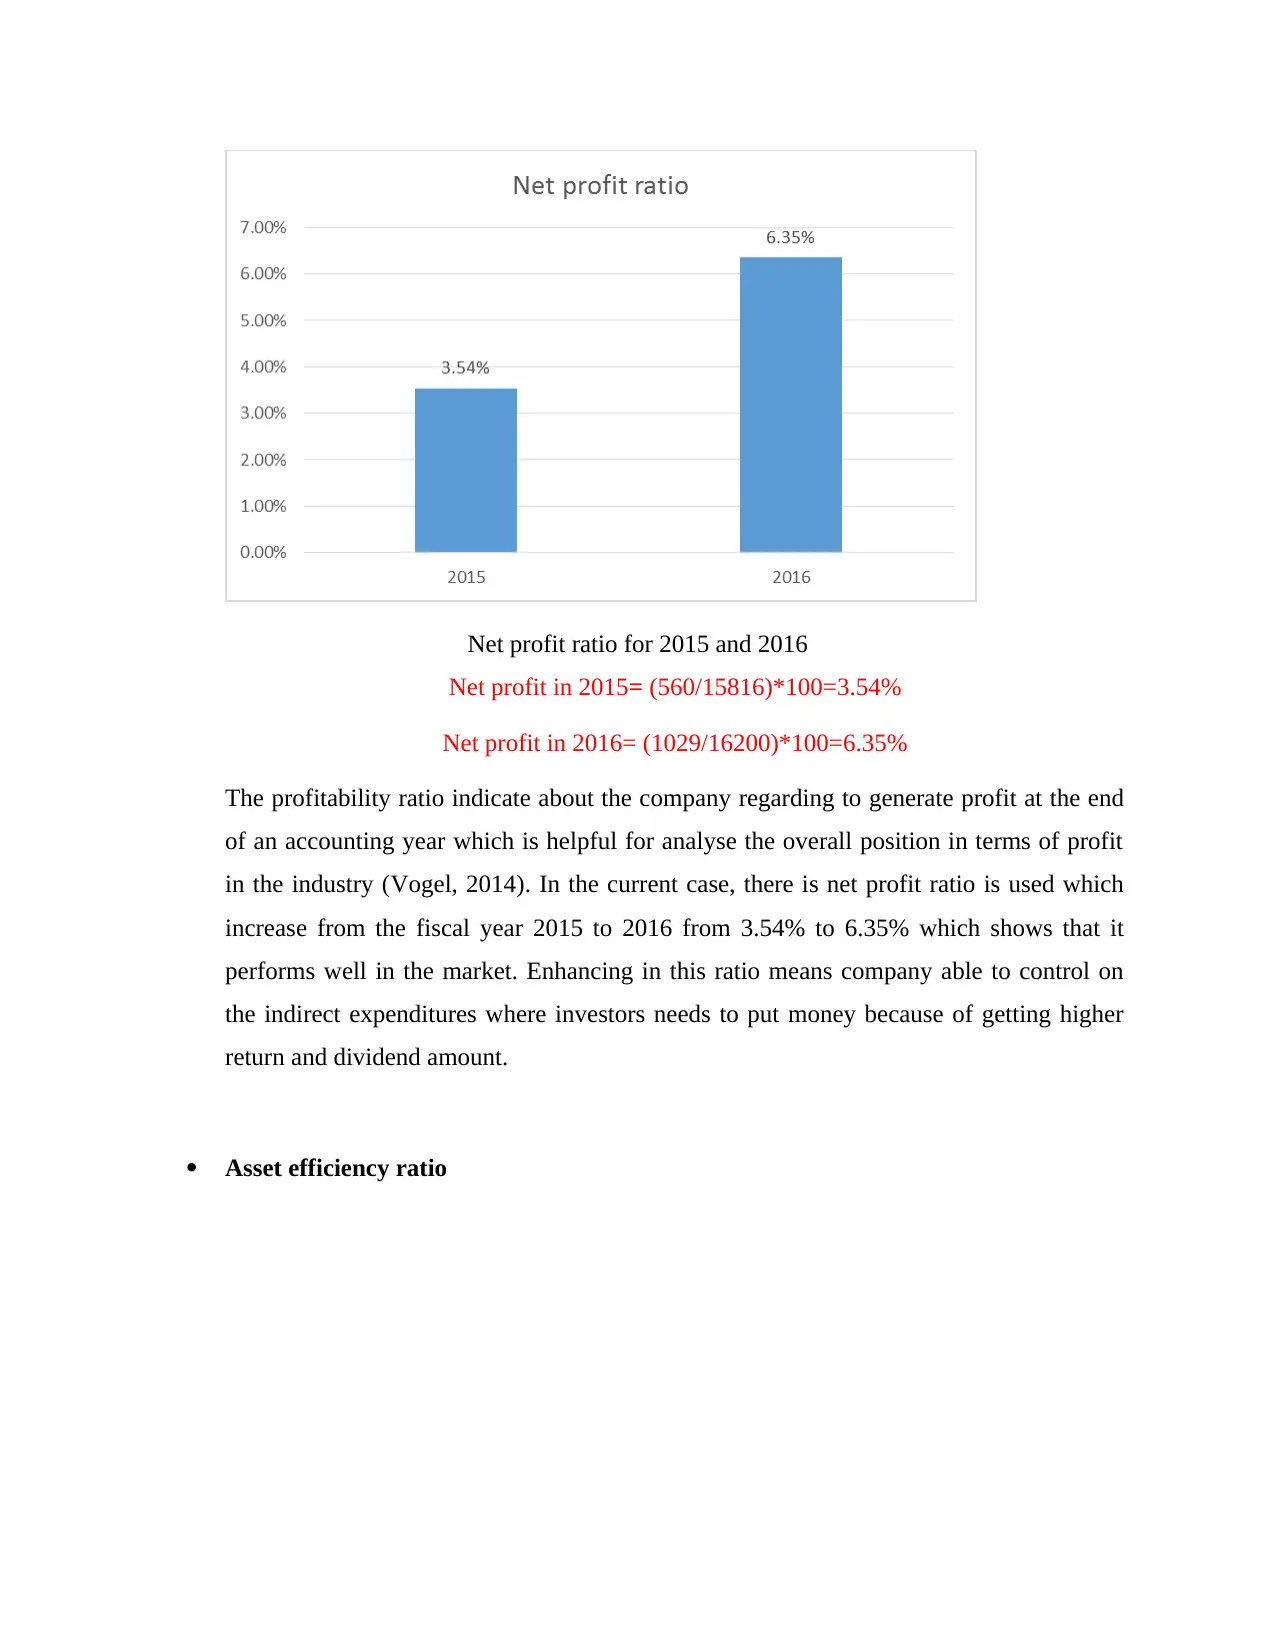
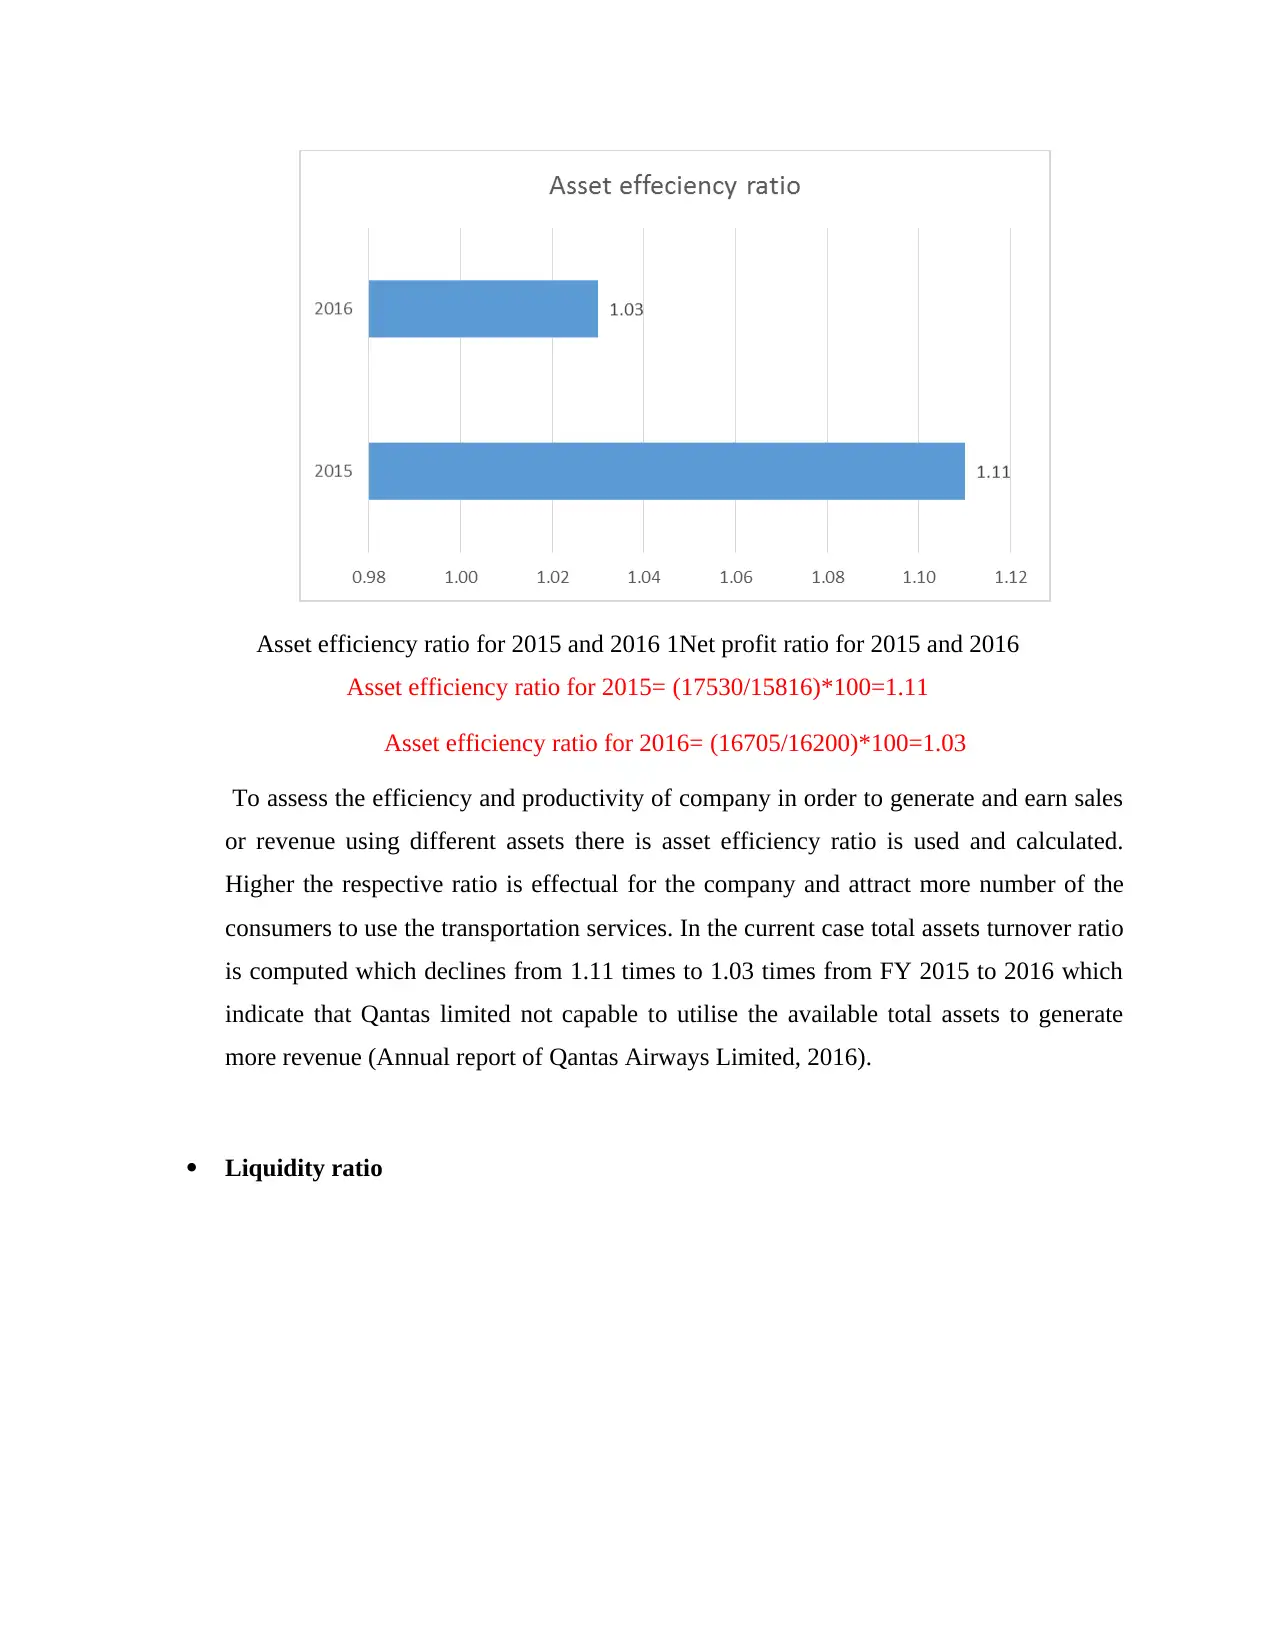
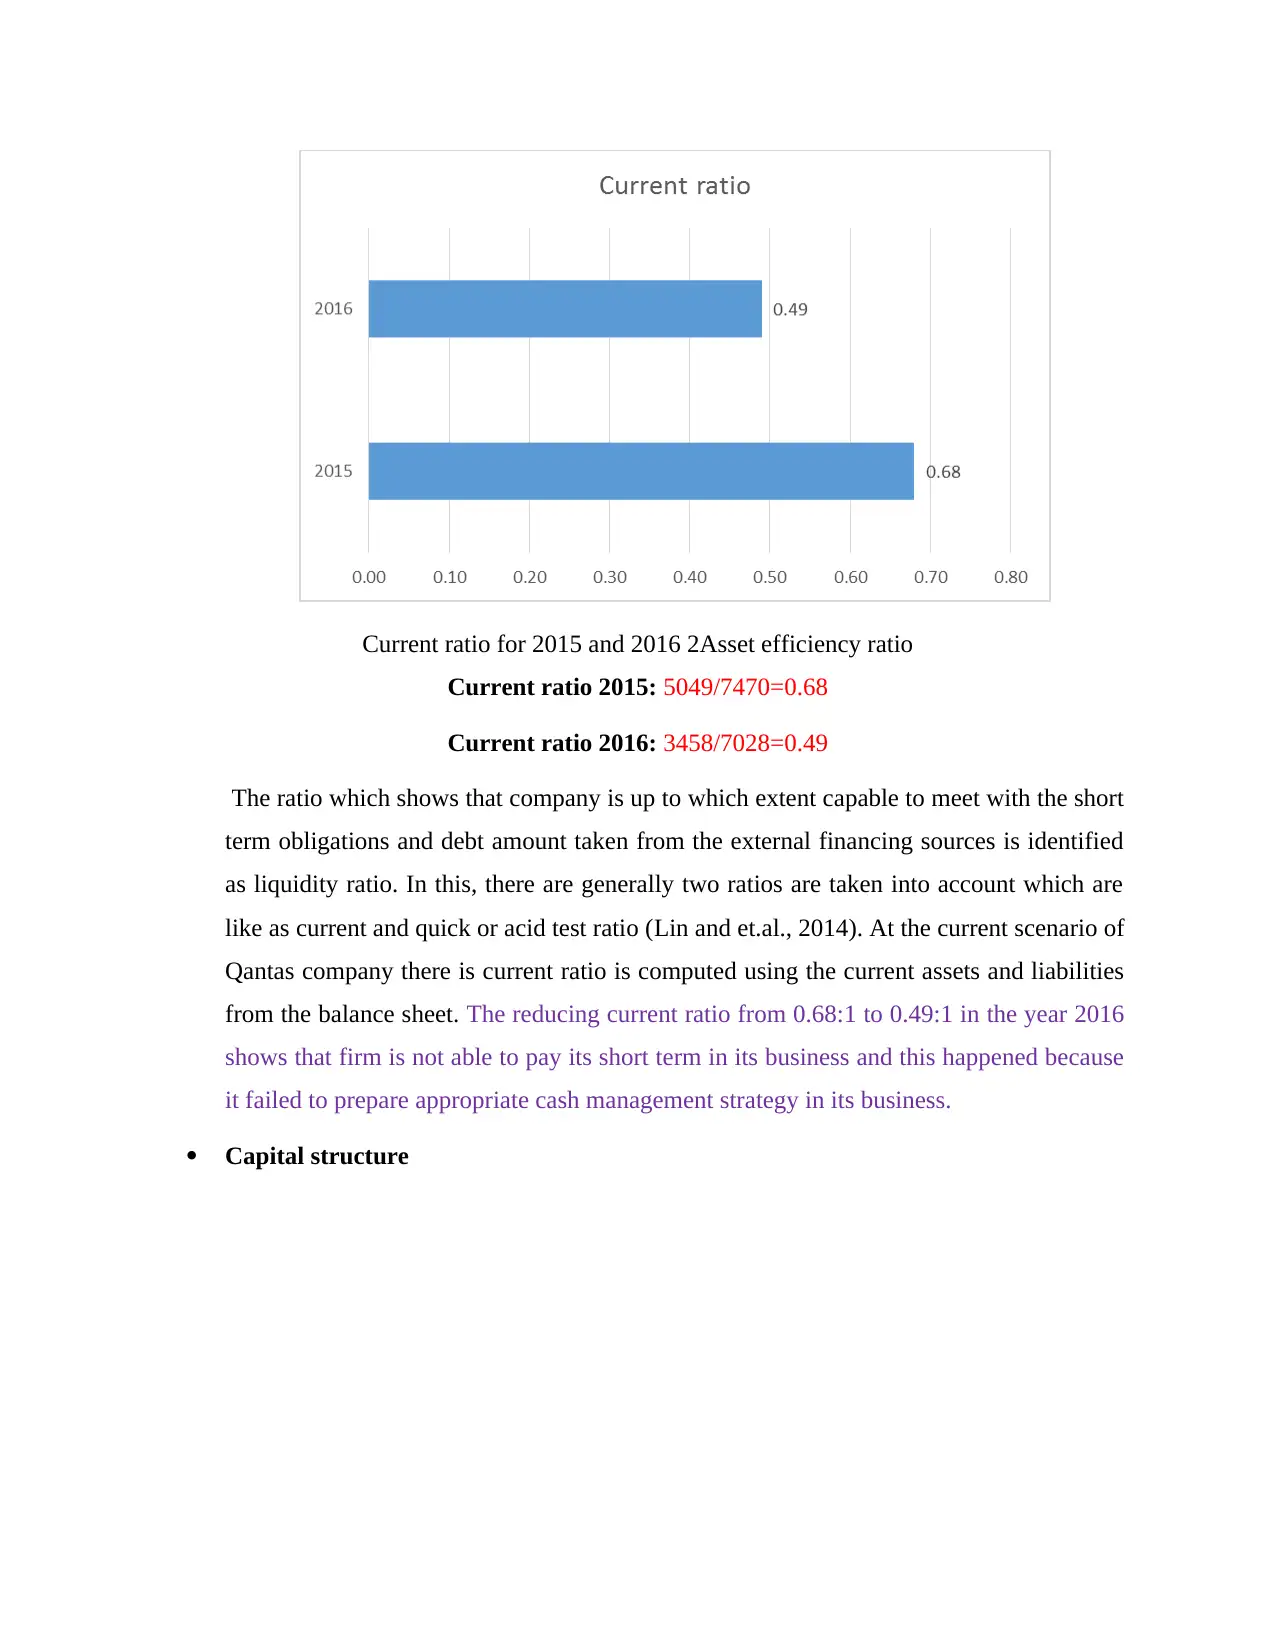
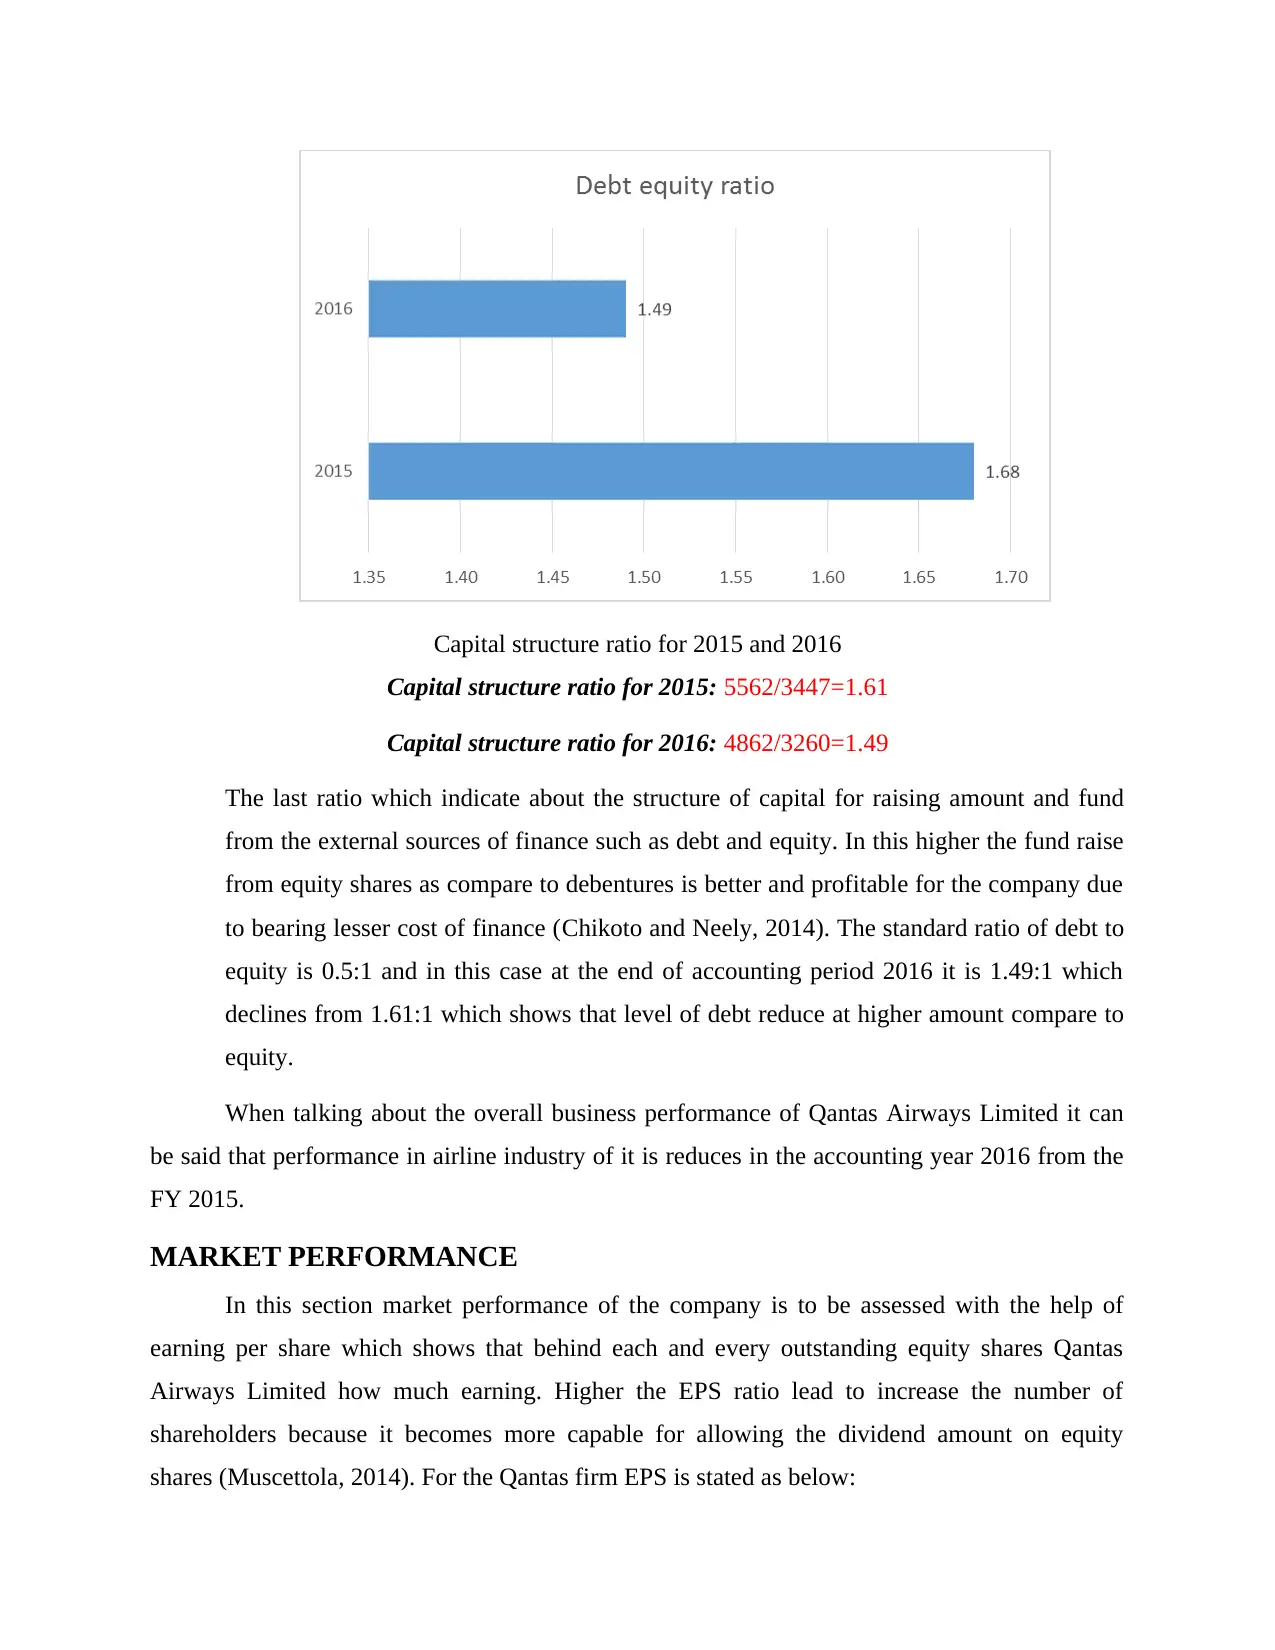
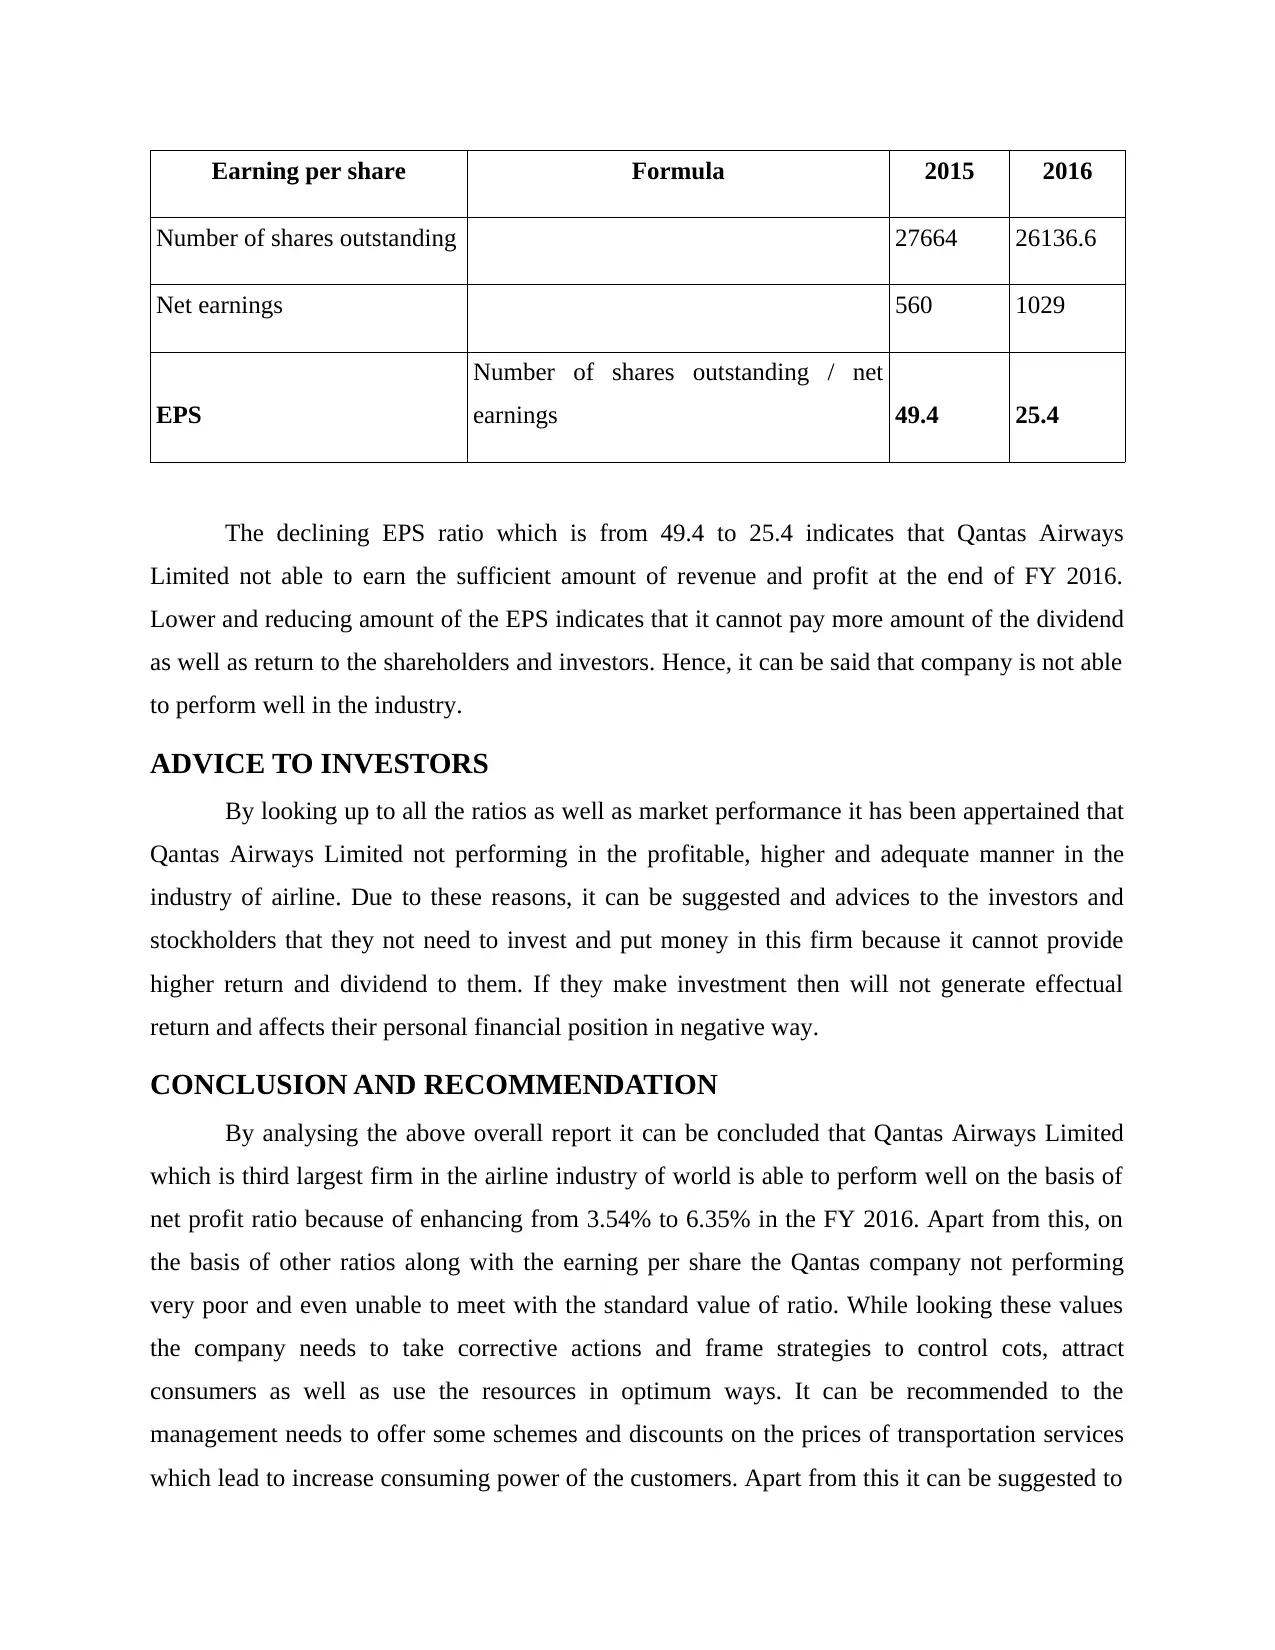
This report provides a comprehensive financial analysis of Qantas Airways Limited, a major player in the transportation and logistics industry. The analysis focuses on key financial ratios derived from the company's annual reports, including profitability, asset efficiency, liquidity, and capital structure ratios. The report calculates and interprets these ratios for the years 2015 and 2016, offering insights into Qantas's financial performance. It highlights the company's improved net profit ratio but notes concerns regarding liquidity and asset utilization. Furthermore, the analysis includes an examination of the company's market performance, specifically focusing on earnings per share (EPS). Based on the findings, the report provides advice to investors and concludes with recommendations for Qantas's management, suggesting strategies to control costs, attract consumers, and optimize resource utilization. The report emphasizes the need for strategic adjustments to improve overall financial health and market position.

ACCOUNTING
Paraphrase This Document
Need a fresh take? Get an instant paraphrase of this document with our AI Paraphraser

EXECUTIVE SUMMARY
The study is about the Qantas Airways Limited which operating in the transportation and
logistics industry and having third position in the world on the basis of largeness. Main activities
of the company is to provide effectual and higher quality of the transportation services through
flights in the world. In the current case, performance of the Qantas firm is to be analysed by
considering the financial ratios on the basis of annual report. It can be said that, the company
performs well in the industry for generating net profit but unable to enhance liquidity position.
For this it needs to take the corrective actions and make strategies for control cost and increase
the number of consumers.

⊘ This is a preview!⊘
Do you want full access?
Subscribe today to unlock all pages.

Trusted by 1+ million students worldwide

INTRODUCTION
Accounting is the process under which different types of the financial statements are to
be prepared and analysed to assess the business performance in terms of profitability as well as
the liquidity. The current report is on the basis of Qantas Airways Limited which the Australia
based company and listed in the stock exchange of Australian and third largest airline company in the
world. The company provides transportation services to the consumers through airlines in the better
and effectual ways. The present study shows about the market performance of the company by taking
base of the financial ratios and on the basis of suggestions are given to Qantas Airways entity.
RATIO ANALYSIS
The method in which different tools are used to analyse the business performance in the
market using financial statements is called as ratio analysis. In the current case with the help of
annual report some ratios are calculated which are stated along with interpretation as below:
Name of ratios Formula of ratios Year
Profitability ratio
2015 (Amount
in $M)
2016 (Amount
in $M)
Net profit 560 1029
Revenue 15816 16200
Net profit ratio
Net profit / net sales * 100
(560/15816)*100=3.54%
(1029/16200)*100=6.35% 3.54% 6.35%
Asset efficiency ratio
Total assets 17530 16705
Revenue 15816 16200
Paraphrase This Document
Need a fresh take? Get an instant paraphrase of this document with our AI Paraphraser

Total assets turnover
ratio
Total assets/Revenue
(17530/15816)*100=1.11
(16705/16200)*100=1.03 1.11 1.03
Liquidity ratio
Current assets 5049 3458
Current liabilities 7470 7028
Current ratio
Current assets / current liabilities
5049/7470=0.68
3458/7028=0.49 0.68:1 0.49:1
Capital structure
Debt 5562 4862
Equity 3447 3260
Debt to equity ratio
Debt / equity
5562/3447=1.61
4862/3260=1.49 1.61:1 1.49:1
Profitability ratio

Net profit ratio for 2015 and 2016
Net profit in 2015= (560/15816)*100=3.54%
Net profit in 2016= (1029/16200)*100=6.35%
The profitability ratio indicate about the company regarding to generate profit at the end
of an accounting year which is helpful for analyse the overall position in terms of profit
in the industry (Vogel, 2014). In the current case, there is net profit ratio is used which
increase from the fiscal year 2015 to 2016 from 3.54% to 6.35% which shows that it
performs well in the market. Enhancing in this ratio means company able to control on
the indirect expenditures where investors needs to put money because of getting higher
return and dividend amount.
Asset efficiency ratio
⊘ This is a preview!⊘
Do you want full access?
Subscribe today to unlock all pages.

Trusted by 1+ million students worldwide

Asset efficiency ratio for 2015 and 2016 1Net profit ratio for 2015 and 2016
Asset efficiency ratio for 2015= (17530/15816)*100=1.11
Asset efficiency ratio for 2016= (16705/16200)*100=1.03
To assess the efficiency and productivity of company in order to generate and earn sales
or revenue using different assets there is asset efficiency ratio is used and calculated.
Higher the respective ratio is effectual for the company and attract more number of the
consumers to use the transportation services. In the current case total assets turnover ratio
is computed which declines from 1.11 times to 1.03 times from FY 2015 to 2016 which
indicate that Qantas limited not capable to utilise the available total assets to generate
more revenue (Annual report of Qantas Airways Limited, 2016).
Liquidity ratio
Paraphrase This Document
Need a fresh take? Get an instant paraphrase of this document with our AI Paraphraser

Current ratio for 2015 and 2016 2Asset efficiency ratio
Current ratio 2015: 5049/7470=0.68
Current ratio 2016: 3458/7028=0.49
The ratio which shows that company is up to which extent capable to meet with the short
term obligations and debt amount taken from the external financing sources is identified
as liquidity ratio. In this, there are generally two ratios are taken into account which are
like as current and quick or acid test ratio (Lin and et.al., 2014). At the current scenario of
Qantas company there is current ratio is computed using the current assets and liabilities
from the balance sheet. The reducing current ratio from 0.68:1 to 0.49:1 in the year 2016
shows that firm is not able to pay its short term in its business and this happened because
it failed to prepare appropriate cash management strategy in its business.
Capital structure

Capital structure ratio for 2015 and 2016
Capital structure ratio for 2015: 5562/3447=1.61
Capital structure ratio for 2016: 4862/3260=1.49
The last ratio which indicate about the structure of capital for raising amount and fund
from the external sources of finance such as debt and equity. In this higher the fund raise
from equity shares as compare to debentures is better and profitable for the company due
to bearing lesser cost of finance (Chikoto and Neely, 2014). The standard ratio of debt to
equity is 0.5:1 and in this case at the end of accounting period 2016 it is 1.49:1 which
declines from 1.61:1 which shows that level of debt reduce at higher amount compare to
equity.
When talking about the overall business performance of Qantas Airways Limited it can
be said that performance in airline industry of it is reduces in the accounting year 2016 from the
FY 2015.
MARKET PERFORMANCE
In this section market performance of the company is to be assessed with the help of
earning per share which shows that behind each and every outstanding equity shares Qantas
Airways Limited how much earning. Higher the EPS ratio lead to increase the number of
shareholders because it becomes more capable for allowing the dividend amount on equity
shares (Muscettola, 2014). For the Qantas firm EPS is stated as below:
⊘ This is a preview!⊘
Do you want full access?
Subscribe today to unlock all pages.

Trusted by 1+ million students worldwide

Earning per share Formula 2015 2016
Number of shares outstanding 27664 26136.6
Net earnings 560 1029
EPS
Number of shares outstanding / net
earnings 49.4 25.4
The declining EPS ratio which is from 49.4 to 25.4 indicates that Qantas Airways
Limited not able to earn the sufficient amount of revenue and profit at the end of FY 2016.
Lower and reducing amount of the EPS indicates that it cannot pay more amount of the dividend
as well as return to the shareholders and investors. Hence, it can be said that company is not able
to perform well in the industry.
ADVICE TO INVESTORS
By looking up to all the ratios as well as market performance it has been appertained that
Qantas Airways Limited not performing in the profitable, higher and adequate manner in the
industry of airline. Due to these reasons, it can be suggested and advices to the investors and
stockholders that they not need to invest and put money in this firm because it cannot provide
higher return and dividend to them. If they make investment then will not generate effectual
return and affects their personal financial position in negative way.
CONCLUSION AND RECOMMENDATION
By analysing the above overall report it can be concluded that Qantas Airways Limited
which is third largest firm in the airline industry of world is able to perform well on the basis of
net profit ratio because of enhancing from 3.54% to 6.35% in the FY 2016. Apart from this, on
the basis of other ratios along with the earning per share the Qantas company not performing
very poor and even unable to meet with the standard value of ratio. While looking these values
the company needs to take corrective actions and frame strategies to control cots, attract
consumers as well as use the resources in optimum ways. It can be recommended to the
management needs to offer some schemes and discounts on the prices of transportation services
which lead to increase consuming power of the customers. Apart from this it can be suggested to
Paraphrase This Document
Need a fresh take? Get an instant paraphrase of this document with our AI Paraphraser

investors that they should not put money in Qantas because of reducing EPS from 49.4 to 25.4 %
at the end of FY 2016.

⊘ This is a preview!⊘
Do you want full access?
Subscribe today to unlock all pages.

Trusted by 1+ million students worldwide
1 out of 15

Your All-in-One AI-Powered Toolkit for Academic Success.
+13062052269
info@desklib.com
Available 24*7 on WhatsApp / Email
Unlock your academic potential
Copyright © 2020–2025 A2Z Services. All Rights Reserved. Developed and managed by ZUCOL.