Financial Performance of Qantas Airways: A Comparative Analysis

Verified

Added on  2023/06/06

|6
|785
|243
Report
AI Summary
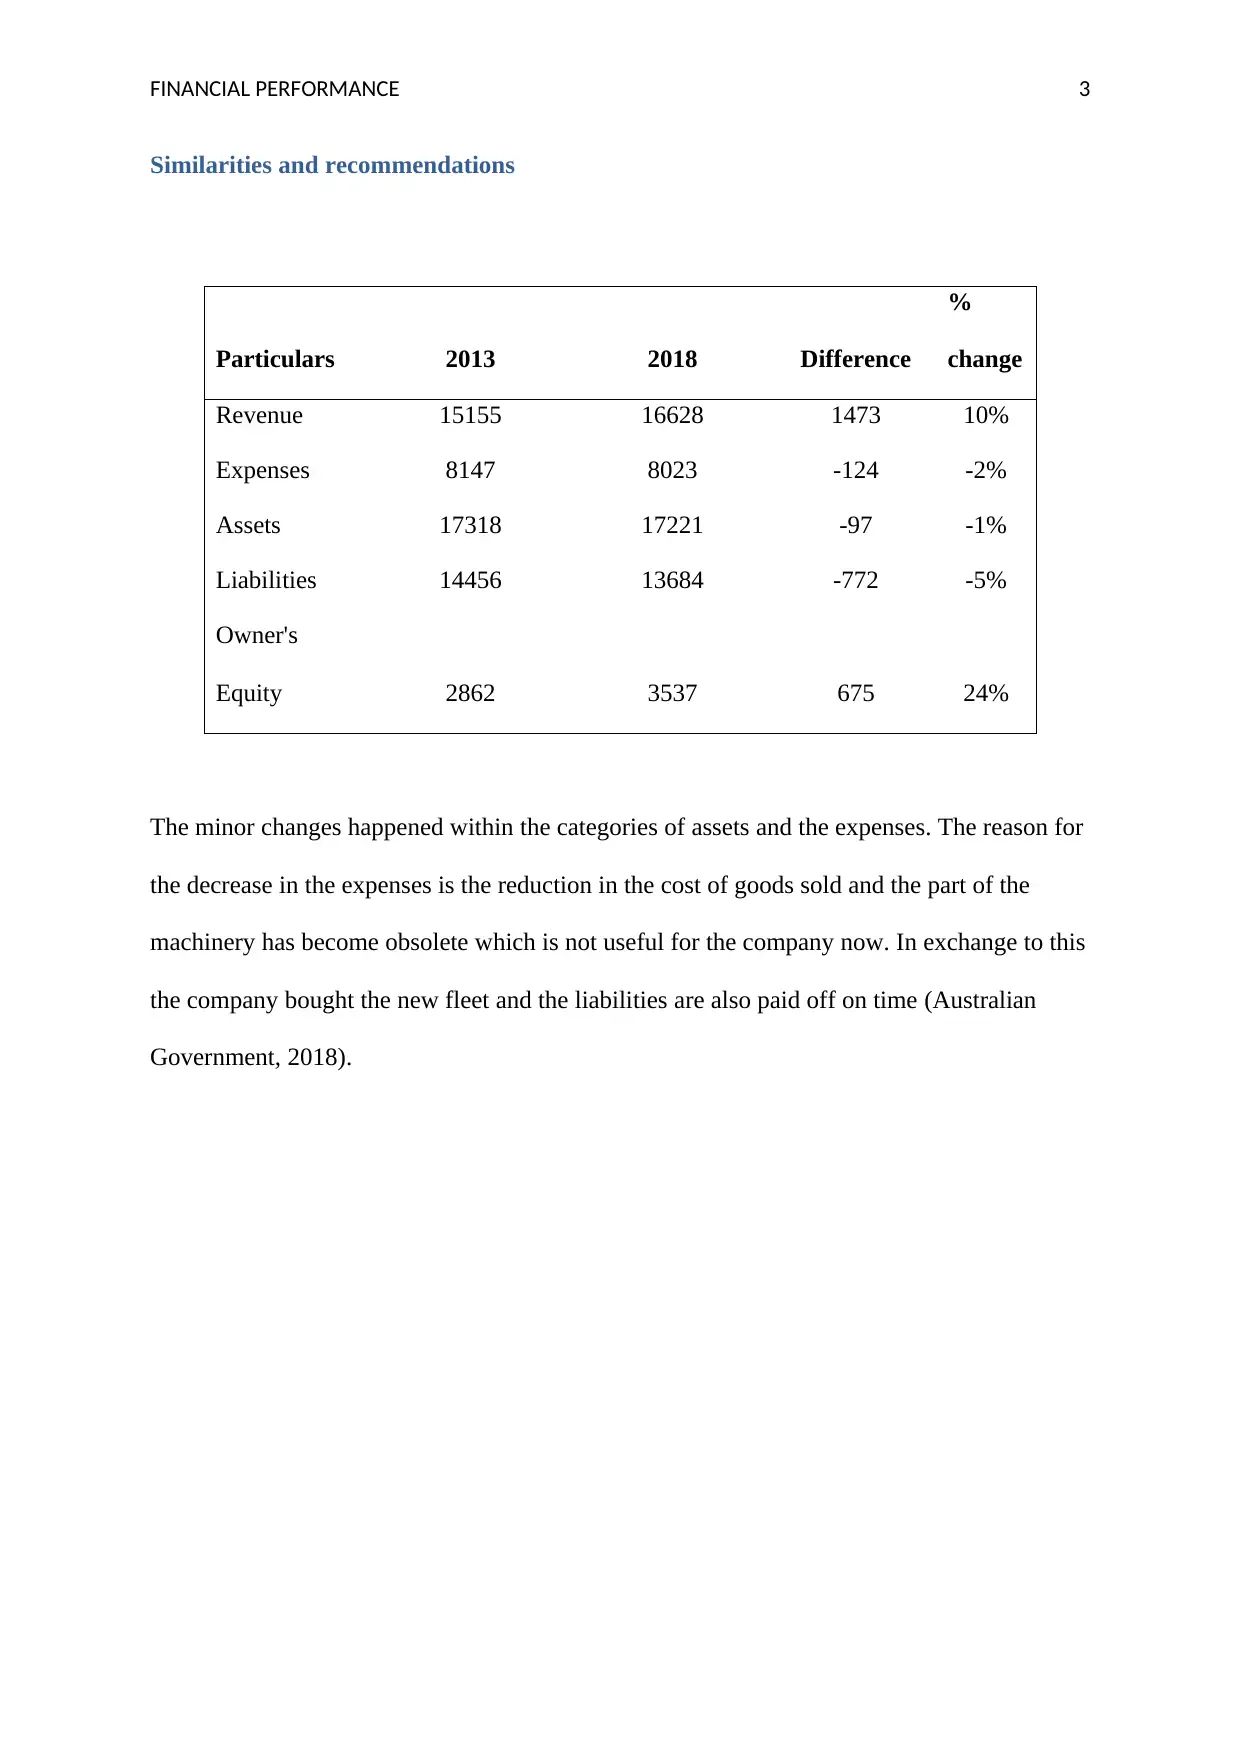
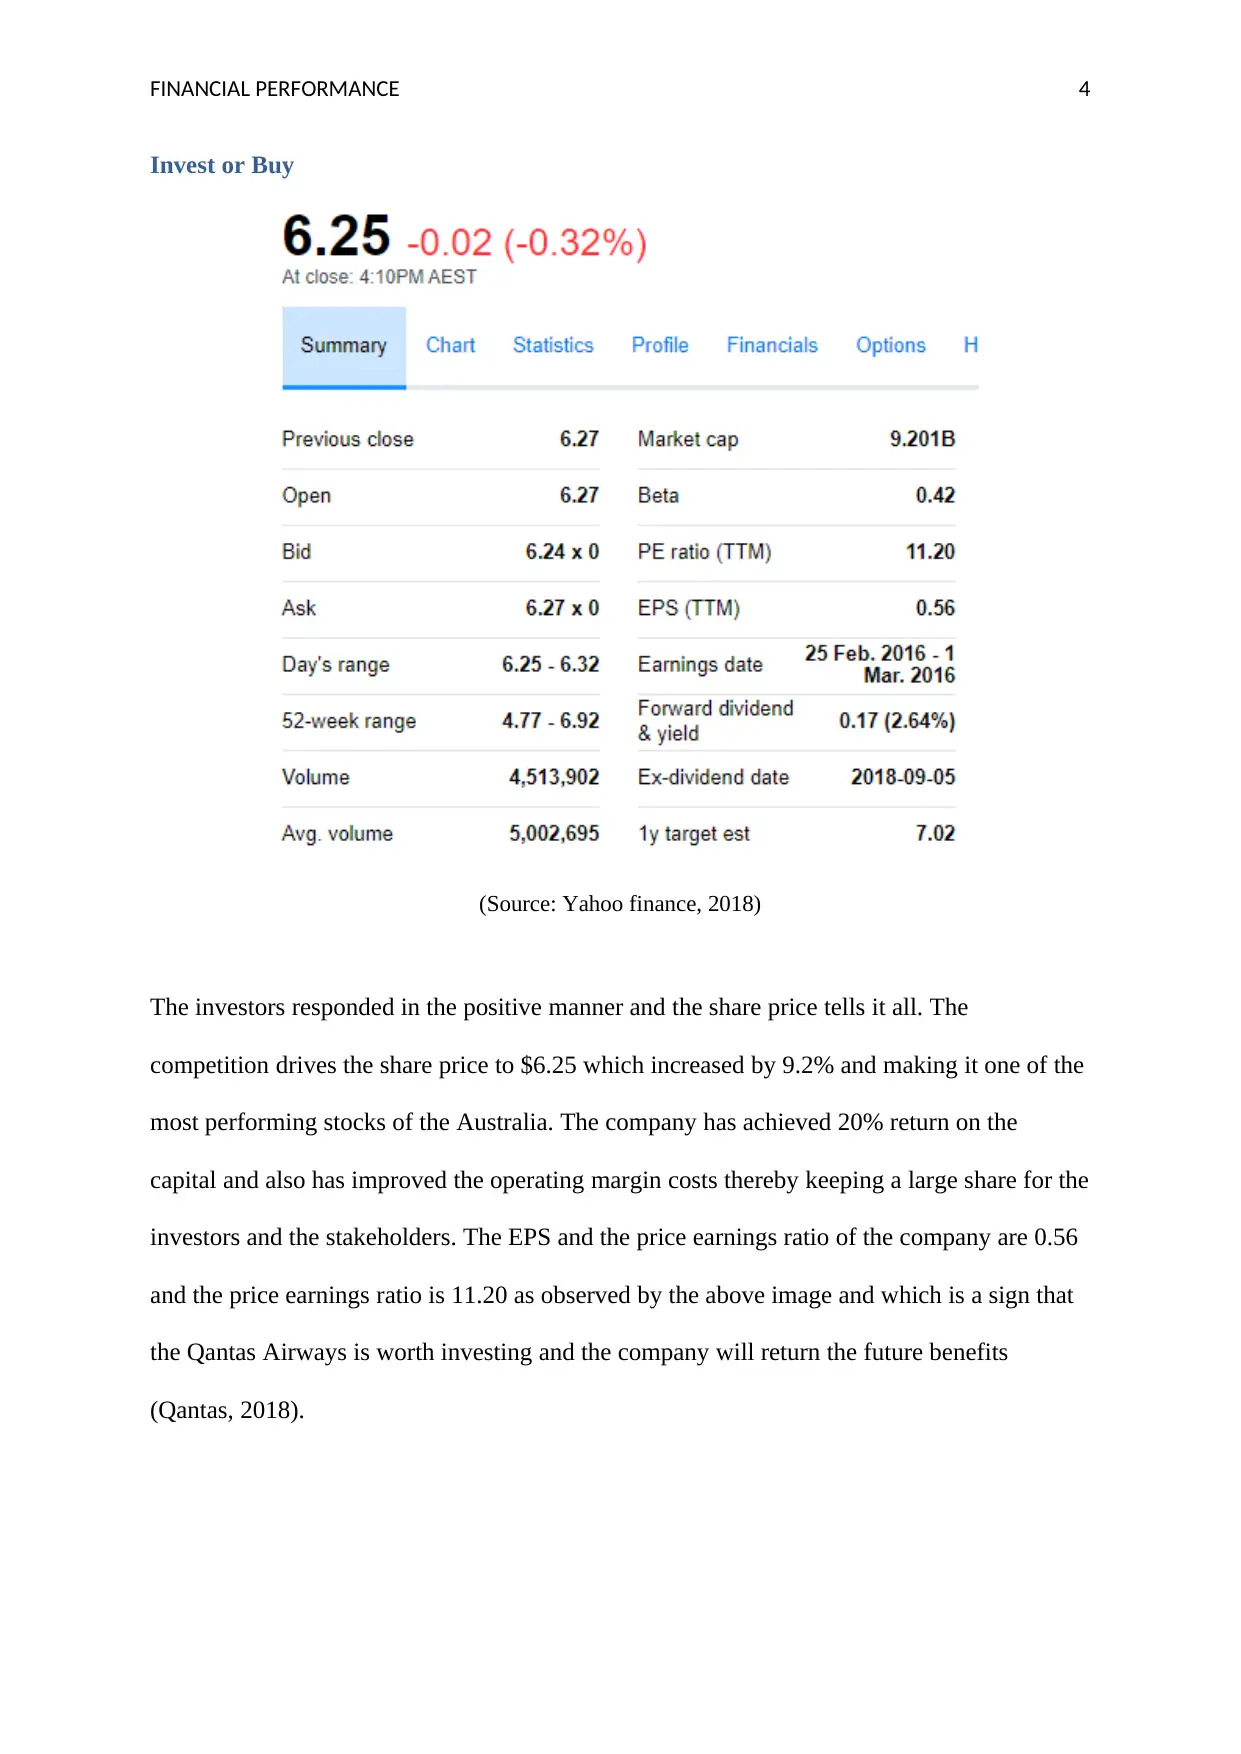
This report provides a comprehensive analysis of Qantas Airways' financial performance, comparing the years 2013 and 2018. It examines key financial metrics, including operating revenues, staff costs, assets, liabilities, and owner's equity. The report highlights significant changes, such as revenue increases, expense reductions, and shifts in assets and liabilities. It also explores the impact of factors like new aircraft acquisitions, fuel costs, and market competition on the airline's profitability. Furthermore, the report assesses Qantas's investment potential based on its share price, return on capital, and price-earnings ratio, concluding with a recommendation for investors. The report references financial data and external sources to support its findings.
Document Page
Running Head: FINANCIAL PERFORMANCE 0
Financial Performance
tabler-icon-diamond-filled.svg

Paraphrase This Document

Need a fresh take? Get an instant paraphrase of this document with our AI Paraphraser
Document Page
FINANCIAL PERFORMANCE 1
Table of Contents
Assessment of the performance 2013........................................................................................2
Assessment of the performance 2018........................................................................................2
Similarities and recommendations.............................................................................................3
Invest or Buy..............................................................................................................................4
References..................................................................................................................................5
Document Page
FINANCIAL PERFORMANCE 2
Assessment of the performance 2013
The performance of the Qantas Airways in the year 2013 was to be a turning point for the
future progress of the Qantas Airways. The operating revenues were 15155 billion and the
staff costs which is one of the critical factors for the Qantas Airways, the 24.5% of the
revenues which amounts to $38.2 million. The company also adopted the policies to improve
the cost strategies. The assets of the Qantas in the year 2013 are 17318 and the liabilities are
14456. The owner’s equity of the Qantas is 2862 with the 2% increase from the year 2012
due to the increase in the retained earnings (Shapiro, 2008).
Assessment of the performance 2018
To upgrade the performance of the Qantas Airways and to keep a competitive advantage over
the competitors the Qantas Airways introduced the new aircraft airbus A320. Qantas
achieved the profits and climbed to $607million in the first half of the financial year 2018.
The flying kangaroo posed its revenue and lifted up by 5.8 per cent to $16.67 billion. The
main gain was driven by its domestic and the budgeted flights business. The earnings from
the Qantas domestic flights went up by 20% to 442 million and Jet star’s earnings accelerated
by 17% to $320 million (Chau. 2018). Qantas as compared to the year 2013 have the assets
1% more amounting to 17222 and the liabilities has been decreased by the 5%. The
international capacity growth, high costs of the fuels and the competitive domestic market is
the reason for such kind of the performance. The airline also disclosed a tax expense of $250
million and did not pay the tax due to the utilisation of the money or the purpose of the carry
forward tax losses.
Document Page
FINANCIAL PERFORMANCE 3
Similarities and recommendations
Particulars 2013 2018 Difference
%
change
Revenue 15155 16628 1473 10%
Expenses 8147 8023 -124 -2%
Assets 17318 17221 -97 -1%
Liabilities 14456 13684 -772 -5%
Owner's
Equity 2862 3537 675 24%
The minor changes happened within the categories of assets and the expenses. The reason for
the decrease in the expenses is the reduction in the cost of goods sold and the part of the
machinery has become obsolete which is not useful for the company now. In exchange to this
the company bought the new fleet and the liabilities are also paid off on time (Australian
Government, 2018).
tabler-icon-diamond-filled.svg

Paraphrase This Document

Need a fresh take? Get an instant paraphrase of this document with our AI Paraphraser
Document Page
FINANCIAL PERFORMANCE 4
Invest or Buy
(Source: Yahoo finance, 2018)
The investors responded in the positive manner and the share price tells it all. The
competition drives the share price to $6.25 which increased by 9.2% and making it one of the
most performing stocks of the Australia. The company has achieved 20% return on the
capital and also has improved the operating margin costs thereby keeping a large share for the
investors and the stakeholders. The EPS and the price earnings ratio of the company are 0.56
and the price earnings ratio is 11.20 as observed by the above image and which is a sign that
the Qantas Airways is worth investing and the company will return the future benefits
(Qantas, 2018).
Document Page
FINANCIAL PERFORMANCE 5
References
Australian Government, (2018) Airline On Time Performance, 2017-18 Financial Year
Report [Online] Available from https://bitre.gov.au/statistics/aviation/otp_annual.aspx
[Accessed on 1st September 2018]
Chau. D. (2018) Qantas could start paying corporate tax again after $607 million profit [Online]
Available from http://www.abc.net.au/news/2018-02-22/qantas-half-year-results-607-million-
profit/9473154 [Accessed on 1st September 2018]
Qantas, (2018) QANTAS GROUP FULL YEAR 2017 FINANCIAL RESULT [Online]
Available from https://www.qantasnewsroom.com.au/media-releases/qantas-group-full-year-
2017-financial-result/ [Accessed on 1st September 2018]
Shapiro, A. C. (2008) Capital budgeting and investment analysis. India: Pearson Education.
TCS consultancy, (2017) [Online] Available from https://www.tcs.com/qantas-enhances-
productivity-improves-alignment-of-it-with-business [Accessed on 24th August 2018]
Yahoo finance, (2018) Qantas Airways [Online] Available from
https://au.finance.yahoo.com/quote/QAN.AX/ [Accessed on 24th August 2018]
chevron_up_icon
1 out of 6
circle_padding
hide_on_mobile
zoom_out_icon
[object Object]