Qantas Financial Report: Detailed Analysis of Performance (2014-2017)
VerifiedAdded on 2023/06/12
|27
|3228
|401
Report
AI Summary
This report offers a comprehensive financial analysis of Qantas Airways between 2014 and 2017. It examines the company's income statement, statement of financial position, and cash flow statement to assess its financial health and performance. The analysis includes profitability ratios (ROA, ROE), efficiency ratios (asset turnover, inventory turnover, debtors turnover, creditors turnover), liquidity ratios (current ratio, acid-test ratio, cash ratio, cash flow to sales, cash flow to total debt), and capital structure ratios (debt to equity, debt ratio, equity ratio). The findings indicate variations in Qantas's financial performance during the period, with revenue growth but some financial weaknesses, suggesting the need for measures to improve its overall financial health. The report uses financial data from Qantas's annual reports to evaluate the company's ability to generate income, manage expenses, and meet its short-term and long-term obligations.
Running head: QANTAS ANALYSIS 1
Qantas Analysis
Author
Institution
Date
Qantas Analysis
Author
Institution
Date
Paraphrase This Document
Need a fresh take? Get an instant paraphrase of this document with our AI Paraphraser
QANTAS ANALYSIS 2
1. Executive Summary
Qantas is the largest Australian international and domestic airline founded in 1920. The
company also holds wider portfolio of investment and businesses ranging from Qantas
Freight, Qantas Loyalty, Jetstar, Qantas Holiday, Qantas Link as well as Qantas Catering. As
from the analysis, it was found that Qantas experienced significant variation between 2014
and 2017 in its financial performance. Its revenue shows significant growth over the last four
years. Besides, based on the above analysis, it was found that the company is financially
weak. Hence, it calls for necessary measures in order to boost its financial performance and
health over time.
QANTAS ANALYSIS 3
Table of Contents
1. Executive Summary...............................................................................................................2
2. Introduction............................................................................................................................4
3. Income Statement...................................................................................................................4
4. Statement of Financial Position.............................................................................................5
5. Cash Flow Statement..............................................................................................................6
6. Financial ratio analysis...........................................................................................................7
6.1 Profitability ratios.............................................................................................................7
6.2 Efficiency ratios................................................................................................................8
6.3 Liquidity ratios...............................................................................................................10
6.4 Capital Structure Ratios..................................................................................................11
7. Conclusion............................................................................................................................11
8. Appendix..............................................................................................................................13
9. References............................................................................................................................34
⊘ This is a preview!⊘
Do you want full access?
Subscribe today to unlock all pages.
Trusted by 1+ million students worldwide
QANTAS ANALYSIS 4
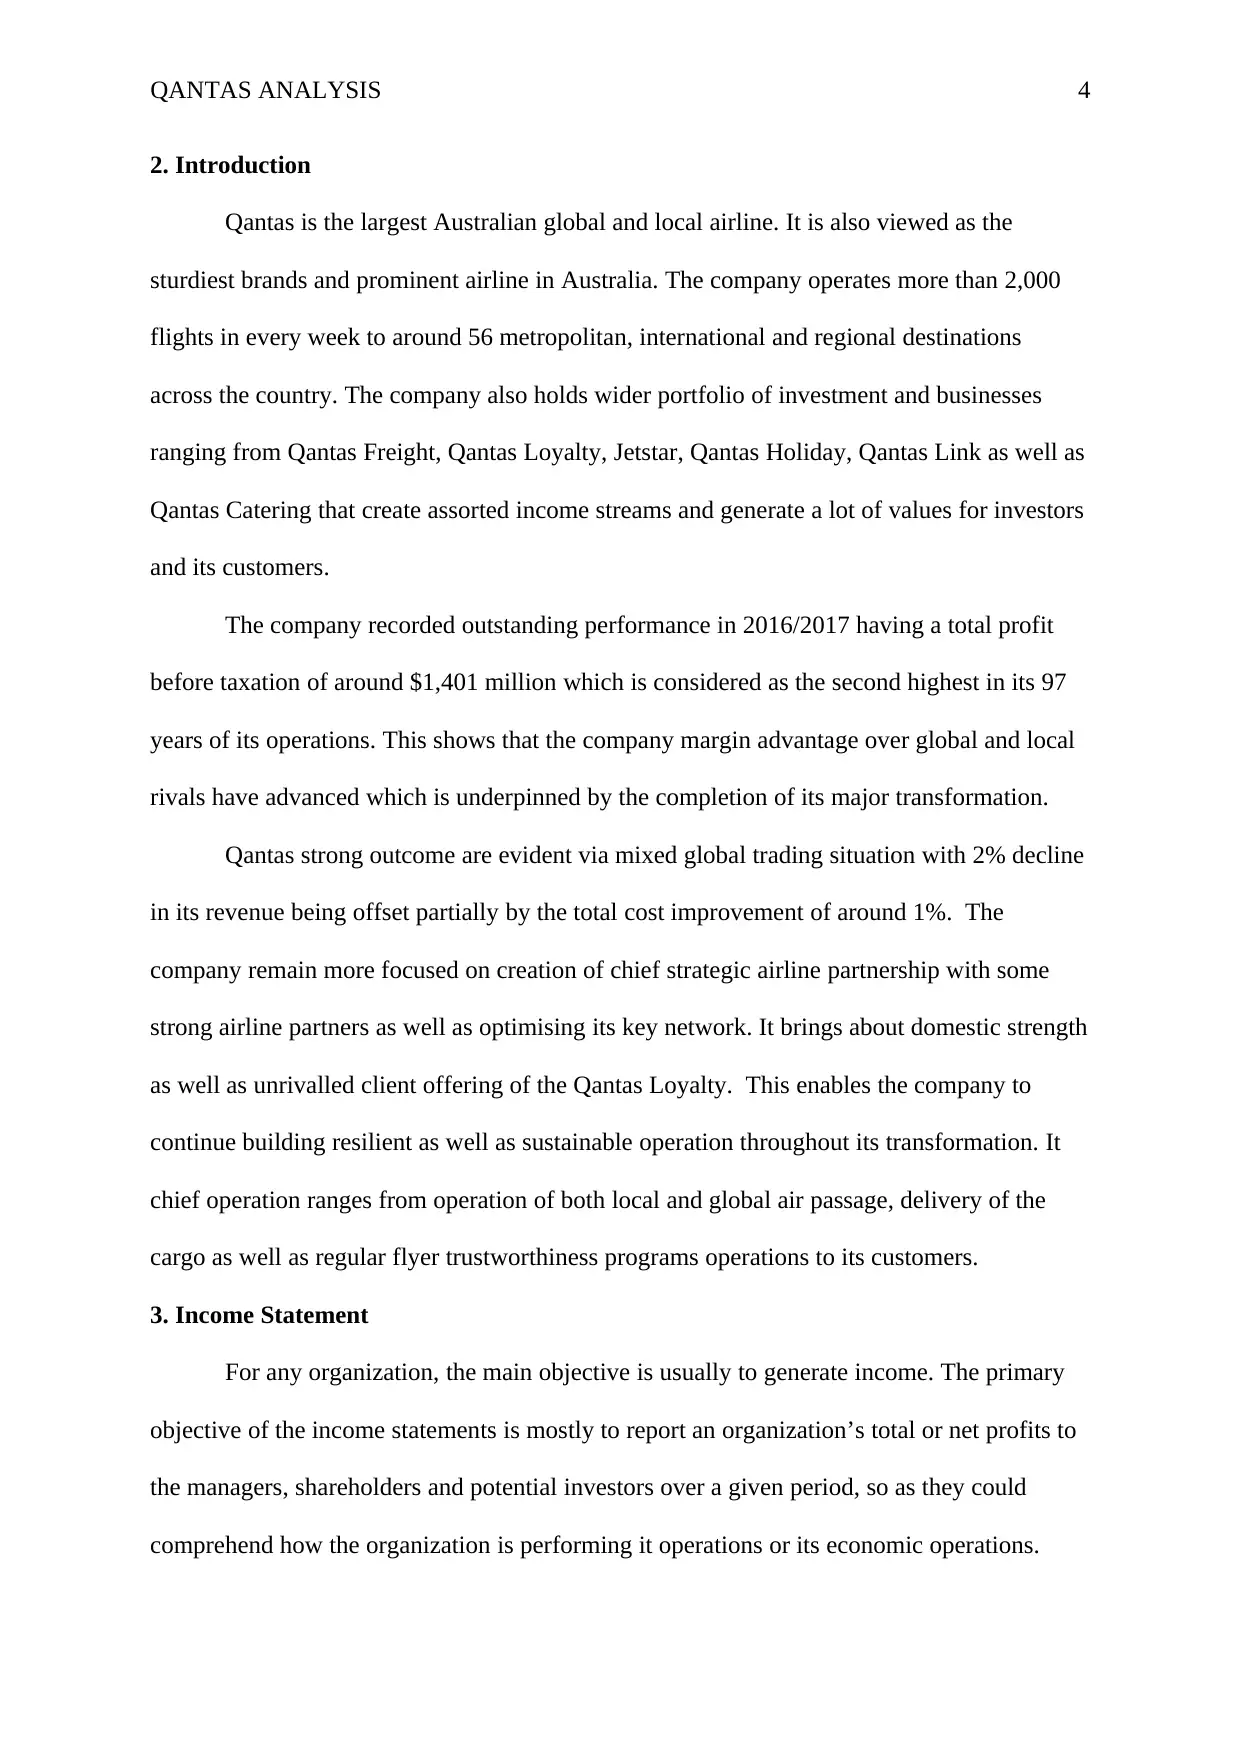
2. Introduction
Qantas is the largest Australian global and local airline. It is also viewed as the
sturdiest brands and prominent airline in Australia. The company operates more than 2,000
flights in every week to around 56 metropolitan, international and regional destinations
across the country. The company also holds wider portfolio of investment and businesses
ranging from Qantas Freight, Qantas Loyalty, Jetstar, Qantas Holiday, Qantas Link as well as
Qantas Catering that create assorted income streams and generate a lot of values for investors
and its customers.
The company recorded outstanding performance in 2016/2017 having a total profit
before taxation of around $1,401 million which is considered as the second highest in its 97
years of its operations. This shows that the company margin advantage over global and local
rivals have advanced which is underpinned by the completion of its major transformation.
Qantas strong outcome are evident via mixed global trading situation with 2% decline
in its revenue being offset partially by the total cost improvement of around 1%. The
company remain more focused on creation of chief strategic airline partnership with some
strong airline partners as well as optimising its key network. It brings about domestic strength
as well as unrivalled client offering of the Qantas Loyalty. This enables the company to
continue building resilient as well as sustainable operation throughout its transformation. It
chief operation ranges from operation of both local and global air passage, delivery of the
cargo as well as regular flyer trustworthiness programs operations to its customers.
3. Income Statement
For any organization, the main objective is usually to generate income. The primary
objective of the income statements is mostly to report an organization’s total or net profits to
the managers, shareholders and potential investors over a given period, so as they could
comprehend how the organization is performing it operations or its economic operations.
Paraphrase This Document
Need a fresh take? Get an instant paraphrase of this document with our AI Paraphraser
QANTAS ANALYSIS 5
Besides, income statement help reveal significant insights into how efficiently the
management would be controlling most of its expenses and costs, amount of interest charged
on income, as well as amount of tax paid. Based on horizontal and vertical analysis, it is
evident that the company net revenue increased in 2015 to 2016 then decreased in 2017. Its
total expenditures decreased with a minimal margin. On the other hand, the company net
income increased in 2015 to 2016 then decreased in the year 2017.
Based on Appendix 8.1, 8.2 and 8.3, it is evident that Qantas gross profit increased for
the last three financial years; 2015, 2016 and 2017. Its operating income trend increased
significantly for the first two years 2015 and 2016 but later decreased in 2016. This is said to
result in consistent increase in net income in 2015 and 2016 but a consistent decrease in its
net income in 2017.
Besides, through vertical and horizontal analysis under Appendix 8.3 and 8.2
respectively, sales revenue for Qantas experienced a significant growth in 2016 of around
2.62 but the growth decreased in 2017. The growth was followed by significant decrease in
its cost of sales resulting in a consistent increase in gross profit over the same period. Its
expenditure as the percentage of total sales was significantly high ranging from 93.3% in
2015, 89.86% in 2016 and 91.47% in 2017. Furthermore, its net profit as percentage of the
sales remained relatively low from 3.54% in 2015 to 5.31% in 2017.
4. Statement of Financial Position
This is also referred to balance sheet which is viewed as the snapshot of an
organization’s financial position or condition. In essence, the statement of the financial
position indicated if an organization’s activity was being financed by either liabilities or
owners’ equity. It usually indicates how much an organization owns in term of assets as well
as how much it owes others in terms of liabilities while the difference between these two
components is the equity also referred to as the shareholders’ equity. Based on figure 1
QANTAS ANALYSIS 6
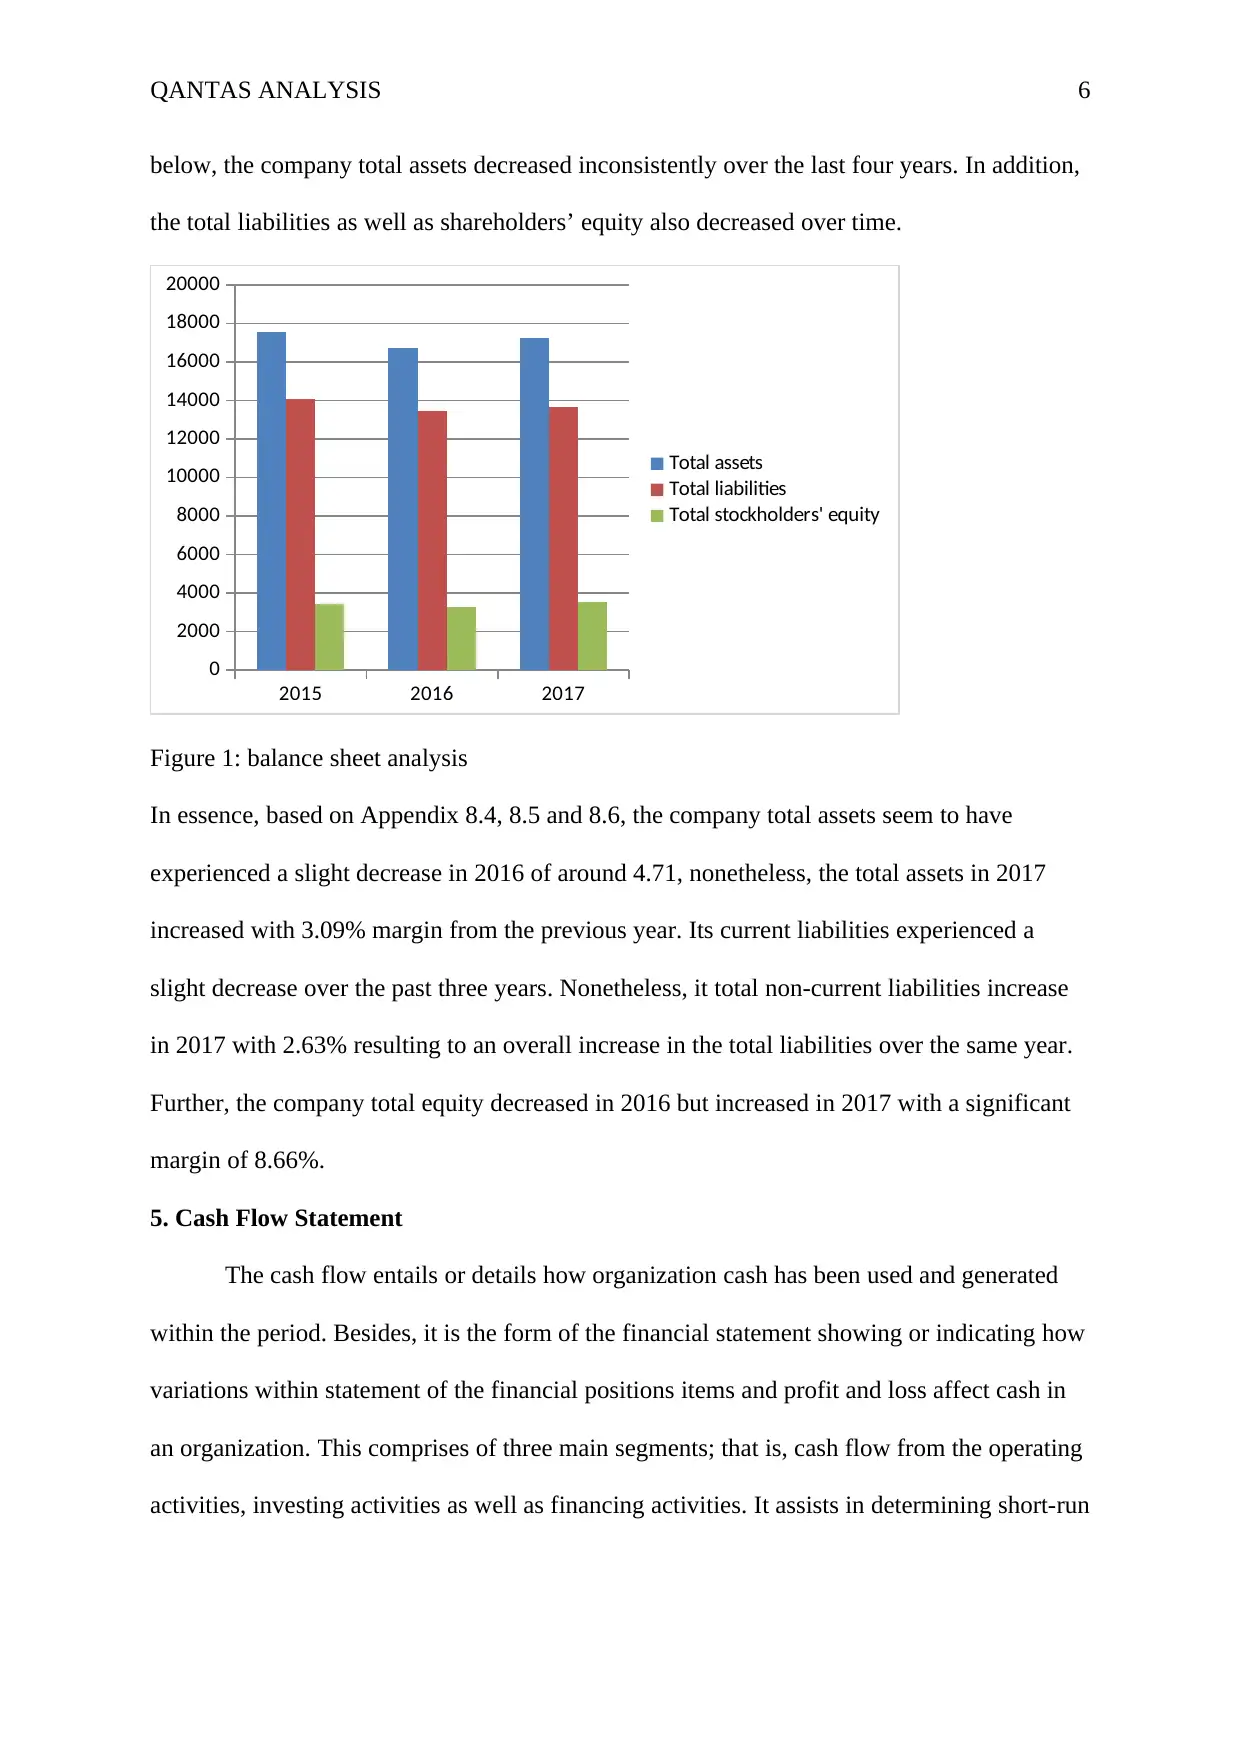
below, the company total assets decreased inconsistently over the last four years. In addition,
the total liabilities as well as shareholders’ equity also decreased over time.
2015 2016 2017
0
2000
4000
6000
8000
10000
12000
14000
16000
18000
20000
Total assets
Total liabilities
Total stockholders' equity
Figure 1: balance sheet analysis
In essence, based on Appendix 8.4, 8.5 and 8.6, the company total assets seem to have
experienced a slight decrease in 2016 of around 4.71, nonetheless, the total assets in 2017
increased with 3.09% margin from the previous year. Its current liabilities experienced a
slight decrease over the past three years. Nonetheless, it total non-current liabilities increase
in 2017 with 2.63% resulting to an overall increase in the total liabilities over the same year.
Further, the company total equity decreased in 2016 but increased in 2017 with a significant
margin of 8.66%.
5. Cash Flow Statement
The cash flow entails or details how organization cash has been used and generated
within the period. Besides, it is the form of the financial statement showing or indicating how
variations within statement of the financial positions items and profit and loss affect cash in
an organization. This comprises of three main segments; that is, cash flow from the operating
activities, investing activities as well as financing activities. It assists in determining short-run
⊘ This is a preview!⊘
Do you want full access?
Subscribe today to unlock all pages.
Trusted by 1+ million students worldwide
QANTAS ANALYSIS 7
viability of an organization, especially its capacity to settle its bills. In other words, this is
mostly concerned with how cash flow into and out of the firm.
Cash flow from the operating activities: based on the analysis, cash from its operations
increased with a significant margin. The capacity for the firm in generating strong cash
inflow is not alarming at all.
Cash flow from its investing activities: The cash flow from its investing activities decreased
over time.
Cash flow from its financing activities: The figure decreased over time. The decrease
would have been as a result of natural calamities.
6. Financial ratio analysis
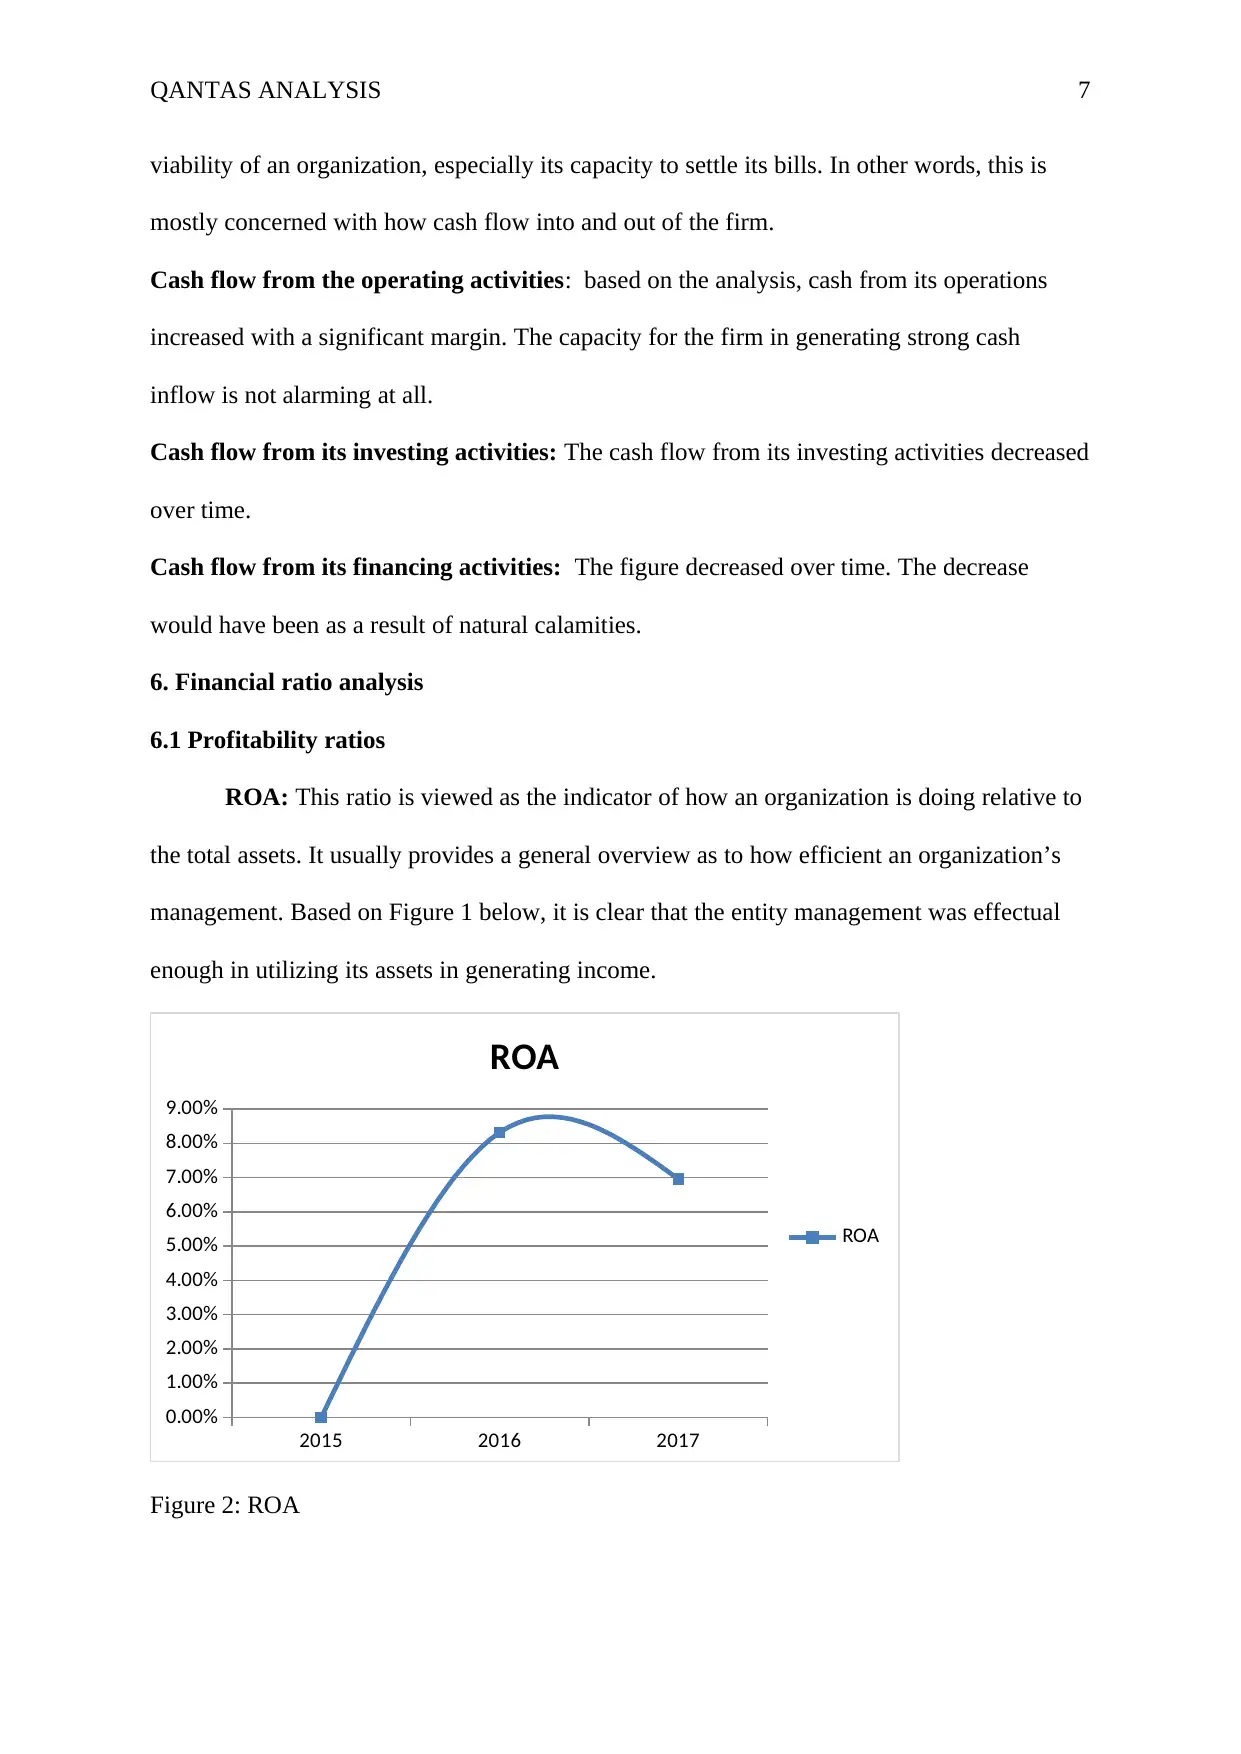
6.1 Profitability ratios
ROA: This ratio is viewed as the indicator of how an organization is doing relative to
the total assets. It usually provides a general overview as to how efficient an organization’s
management. Based on Figure 1 below, it is clear that the entity management was effectual
enough in utilizing its assets in generating income.
2015 2016 2017
0.00%
1.00%
2.00%
3.00%
4.00%
5.00%
6.00%
7.00%
8.00%
9.00%
ROA
ROA
Figure 2: ROA
viability of an organization, especially its capacity to settle its bills. In other words, this is
mostly concerned with how cash flow into and out of the firm.
Cash flow from the operating activities: based on the analysis, cash from its operations
increased with a significant margin. The capacity for the firm in generating strong cash
inflow is not alarming at all.
Cash flow from its investing activities: The cash flow from its investing activities decreased
over time.
Cash flow from its financing activities: The figure decreased over time. The decrease
would have been as a result of natural calamities.
6. Financial ratio analysis
6.1 Profitability ratios
ROA: This ratio is viewed as the indicator of how an organization is doing relative to
the total assets. It usually provides a general overview as to how efficient an organization’s
management. Based on Figure 1 below, it is clear that the entity management was effectual
enough in utilizing its assets in generating income.
2015 2016 2017
0.00%
1.00%
2.00%
3.00%
4.00%
5.00%
6.00%
7.00%
8.00%
9.00%
ROA
ROA
Figure 2: ROA
Paraphrase This Document
Need a fresh take? Get an instant paraphrase of this document with our AI Paraphraser
QANTAS ANALYSIS 8
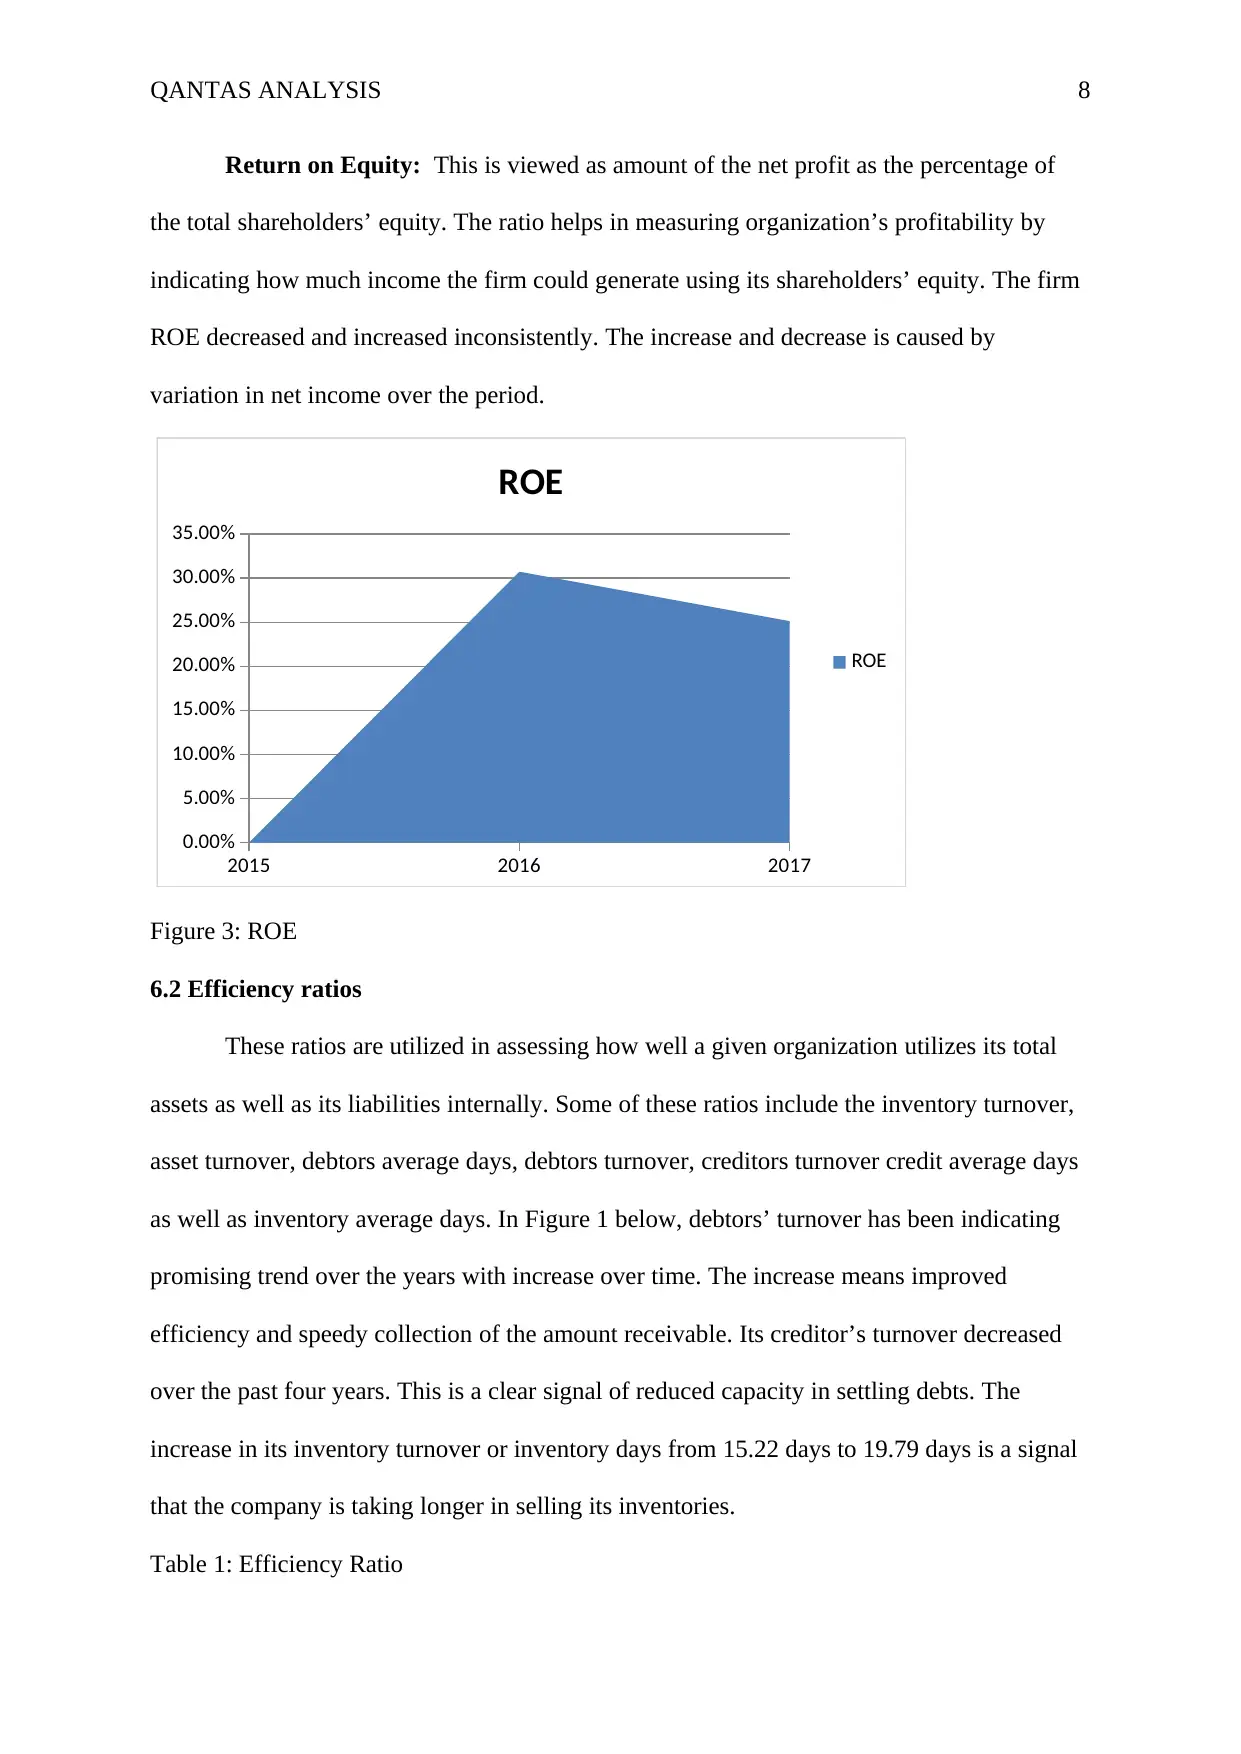
Return on Equity: This is viewed as amount of the net profit as the percentage of
the total shareholders’ equity. The ratio helps in measuring organization’s profitability by
indicating how much income the firm could generate using its shareholders’ equity. The firm
ROE decreased and increased inconsistently. The increase and decrease is caused by
variation in net income over the period.
2015 2016 2017
0.00%
5.00%
10.00%
15.00%
20.00%
25.00%
30.00%
35.00%
ROE
ROE
Figure 3: ROE
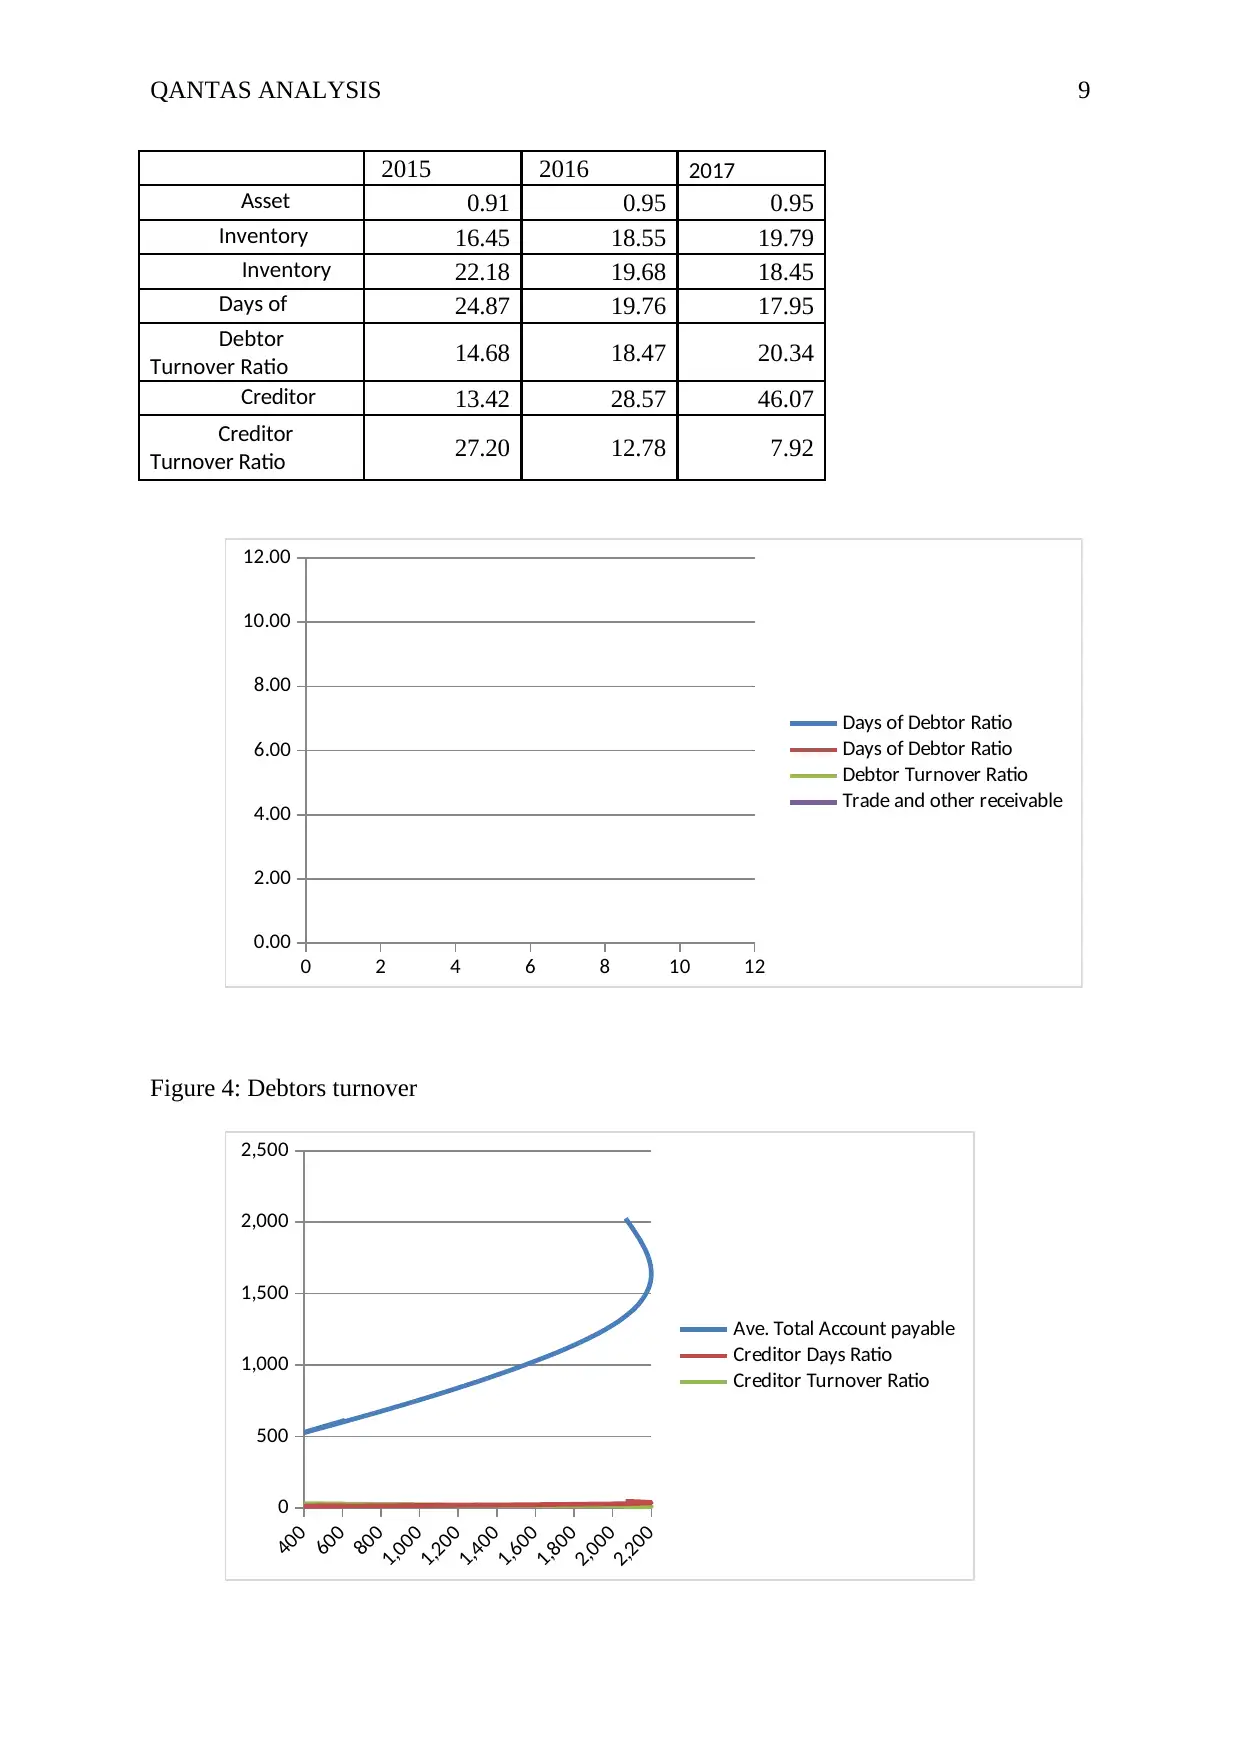
6.2 Efficiency ratios
These ratios are utilized in assessing how well a given organization utilizes its total
assets as well as its liabilities internally. Some of these ratios include the inventory turnover,
asset turnover, debtors average days, debtors turnover, creditors turnover credit average days
as well as inventory average days. In Figure 1 below, debtors’ turnover has been indicating
promising trend over the years with increase over time. The increase means improved
efficiency and speedy collection of the amount receivable. Its creditor’s turnover decreased
over the past four years. This is a clear signal of reduced capacity in settling debts. The
increase in its inventory turnover or inventory days from 15.22 days to 19.79 days is a signal
that the company is taking longer in selling its inventories.
Table 1: Efficiency Ratio
Return on Equity: This is viewed as amount of the net profit as the percentage of
the total shareholders’ equity. The ratio helps in measuring organization’s profitability by
indicating how much income the firm could generate using its shareholders’ equity. The firm
ROE decreased and increased inconsistently. The increase and decrease is caused by
variation in net income over the period.
2015 2016 2017
0.00%
5.00%
10.00%
15.00%
20.00%
25.00%
30.00%
35.00%
ROE
ROE
Figure 3: ROE
6.2 Efficiency ratios
These ratios are utilized in assessing how well a given organization utilizes its total
assets as well as its liabilities internally. Some of these ratios include the inventory turnover,
asset turnover, debtors average days, debtors turnover, creditors turnover credit average days
as well as inventory average days. In Figure 1 below, debtors’ turnover has been indicating
promising trend over the years with increase over time. The increase means improved
efficiency and speedy collection of the amount receivable. Its creditor’s turnover decreased
over the past four years. This is a clear signal of reduced capacity in settling debts. The
increase in its inventory turnover or inventory days from 15.22 days to 19.79 days is a signal
that the company is taking longer in selling its inventories.
Table 1: Efficiency Ratio
QANTAS ANALYSIS 9
2015 2016 2017
Asset
turnover Ratio
0.91 0.95 0.95
Inventory
Days Ratio
16.45 18.55 19.79
Inventory
Turnover
22.18 19.68 18.45
Days of
Debtor Ratio
24.87 19.76 17.95
Debtor
Turnover Ratio 14.68 18.47 20.34
Creditor
Days Ratio
13.42 28.57 46.07
Creditor
Turnover Ratio 27.20 12.78 7.92
0 2 4 6 8 10 12
0.00
2.00
4.00
6.00
8.00
10.00
12.00
Days of Debtor Ratio
Days of Debtor Ratio
Debtor Turnover Ratio
Trade and other receivable
Figure 4: Debtors turnover
400
600
800
1,000
1,200
1,400
1,600
1,800
2,000
2,200
0
500
1,000
1,500
2,000
2,500
Ave. Total Account payable
Creditor Days Ratio
Creditor Turnover Ratio
⊘ This is a preview!⊘
Do you want full access?
Subscribe today to unlock all pages.
Trusted by 1+ million students worldwide
QANTAS ANALYSIS 10
Figure 5: Creditors days
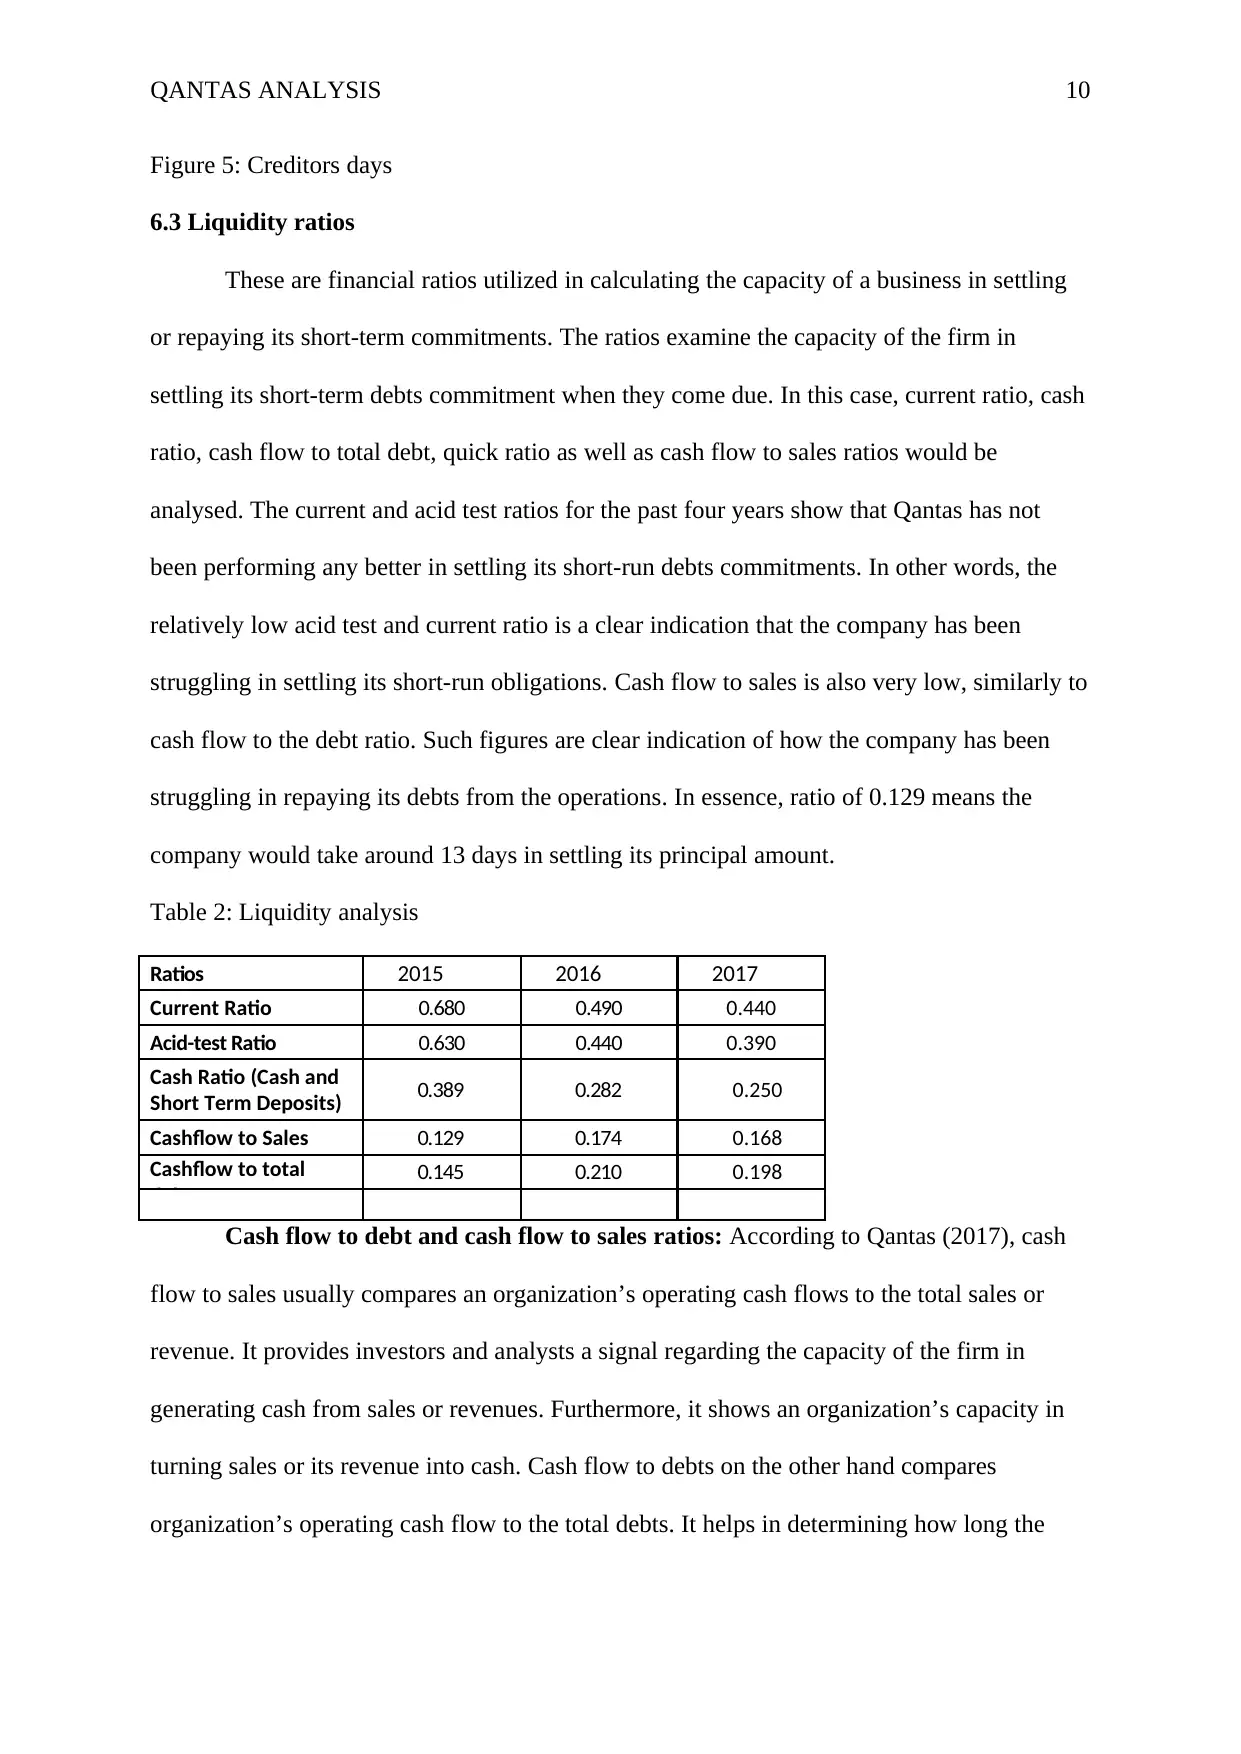
6.3 Liquidity ratios
These are financial ratios utilized in calculating the capacity of a business in settling
or repaying its short-term commitments. The ratios examine the capacity of the firm in
settling its short-term debts commitment when they come due. In this case, current ratio, cash
ratio, cash flow to total debt, quick ratio as well as cash flow to sales ratios would be
analysed. The current and acid test ratios for the past four years show that Qantas has not
been performing any better in settling its short-run debts commitments. In other words, the
relatively low acid test and current ratio is a clear indication that the company has been
struggling in settling its short-run obligations. Cash flow to sales is also very low, similarly to
cash flow to the debt ratio. Such figures are clear indication of how the company has been
struggling in repaying its debts from the operations. In essence, ratio of 0.129 means the
company would take around 13 days in settling its principal amount.
Table 2: Liquidity analysis
Ratios 2015 2016 2017
Current Ratio 0.680 0.490 0.440
Acid-test Ratio 0.630 0.440 0.390
Cash Ratio (Cash and
Short Term Deposits) 0.389 0.282 0.250
Cashflow to Sales 0.129 0.174 0.168
Cashflow to total
debt
0.145 0.210 0.198
Cash flow to debt and cash flow to sales ratios: According to Qantas (2017), cash
flow to sales usually compares an organization’s operating cash flows to the total sales or
revenue. It provides investors and analysts a signal regarding the capacity of the firm in
generating cash from sales or revenues. Furthermore, it shows an organization’s capacity in
turning sales or its revenue into cash. Cash flow to debts on the other hand compares
organization’s operating cash flow to the total debts. It helps in determining how long the
Figure 5: Creditors days
6.3 Liquidity ratios
These are financial ratios utilized in calculating the capacity of a business in settling
or repaying its short-term commitments. The ratios examine the capacity of the firm in
settling its short-term debts commitment when they come due. In this case, current ratio, cash
ratio, cash flow to total debt, quick ratio as well as cash flow to sales ratios would be
analysed. The current and acid test ratios for the past four years show that Qantas has not
been performing any better in settling its short-run debts commitments. In other words, the
relatively low acid test and current ratio is a clear indication that the company has been
struggling in settling its short-run obligations. Cash flow to sales is also very low, similarly to
cash flow to the debt ratio. Such figures are clear indication of how the company has been
struggling in repaying its debts from the operations. In essence, ratio of 0.129 means the
company would take around 13 days in settling its principal amount.
Table 2: Liquidity analysis
Ratios 2015 2016 2017
Current Ratio 0.680 0.490 0.440
Acid-test Ratio 0.630 0.440 0.390
Cash Ratio (Cash and
Short Term Deposits) 0.389 0.282 0.250
Cashflow to Sales 0.129 0.174 0.168
Cashflow to total
debt
0.145 0.210 0.198
Cash flow to debt and cash flow to sales ratios: According to Qantas (2017), cash
flow to sales usually compares an organization’s operating cash flows to the total sales or
revenue. It provides investors and analysts a signal regarding the capacity of the firm in
generating cash from sales or revenues. Furthermore, it shows an organization’s capacity in
turning sales or its revenue into cash. Cash flow to debts on the other hand compares
organization’s operating cash flow to the total debts. It helps in determining how long the
Paraphrase This Document
Need a fresh take? Get an instant paraphrase of this document with our AI Paraphraser
QANTAS ANALYSIS 11
company would take in repaying or settling its total debt commitments in case all the cash
flow is devoted to debt repayments.
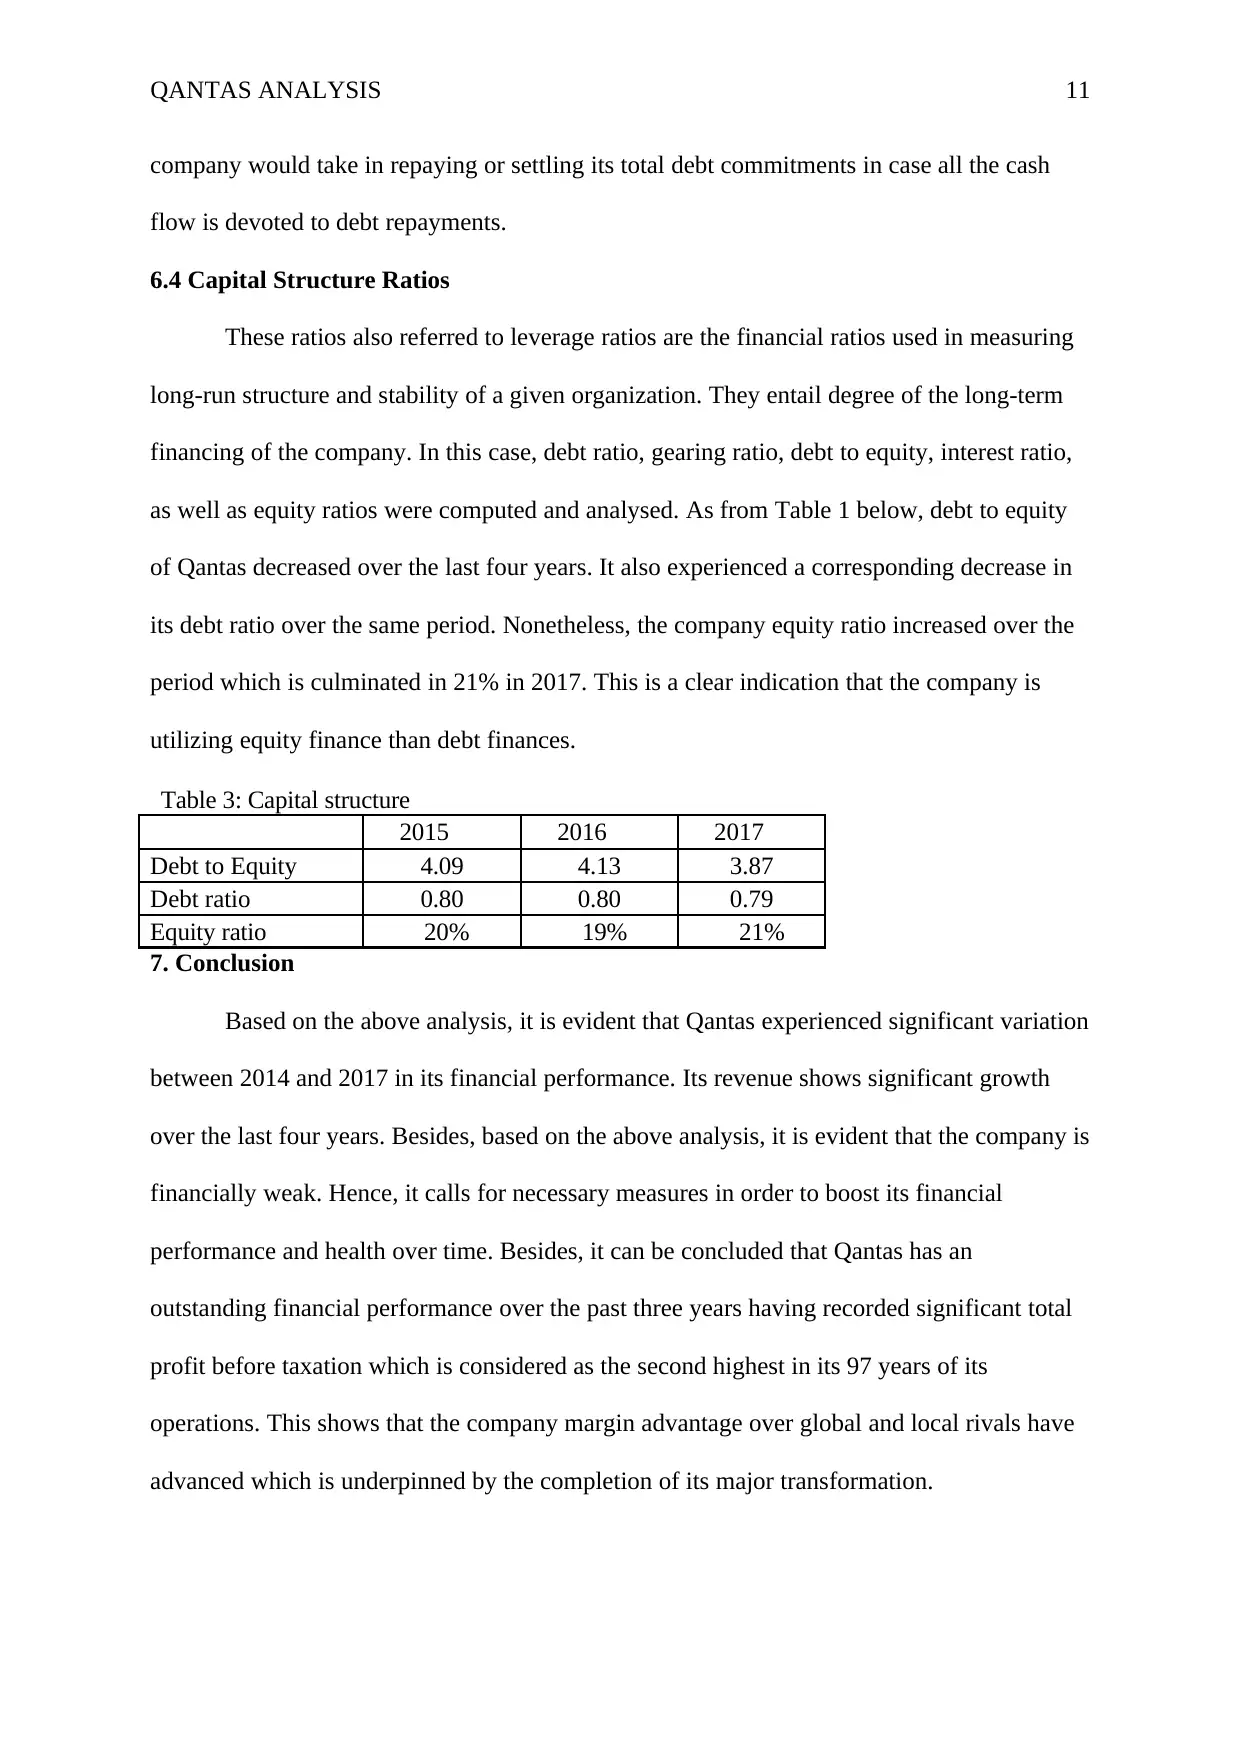
6.4 Capital Structure Ratios
These ratios also referred to leverage ratios are the financial ratios used in measuring
long-run structure and stability of a given organization. They entail degree of the long-term
financing of the company. In this case, debt ratio, gearing ratio, debt to equity, interest ratio,
as well as equity ratios were computed and analysed. As from Table 1 below, debt to equity
of Qantas decreased over the last four years. It also experienced a corresponding decrease in
its debt ratio over the same period. Nonetheless, the company equity ratio increased over the
period which is culminated in 21% in 2017. This is a clear indication that the company is
utilizing equity finance than debt finances.
Table 3: Capital structure
2015 2016 2017
Debt to Equity 4.09 4.13 3.87
Debt ratio 0.80 0.80 0.79
Equity ratio 20% 19% 21%
7. Conclusion
Based on the above analysis, it is evident that Qantas experienced significant variation
between 2014 and 2017 in its financial performance. Its revenue shows significant growth
over the last four years. Besides, based on the above analysis, it is evident that the company is
financially weak. Hence, it calls for necessary measures in order to boost its financial
performance and health over time. Besides, it can be concluded that Qantas has an
outstanding financial performance over the past three years having recorded significant total
profit before taxation which is considered as the second highest in its 97 years of its
operations. This shows that the company margin advantage over global and local rivals have
advanced which is underpinned by the completion of its major transformation.
company would take in repaying or settling its total debt commitments in case all the cash
flow is devoted to debt repayments.
6.4 Capital Structure Ratios
These ratios also referred to leverage ratios are the financial ratios used in measuring
long-run structure and stability of a given organization. They entail degree of the long-term
financing of the company. In this case, debt ratio, gearing ratio, debt to equity, interest ratio,
as well as equity ratios were computed and analysed. As from Table 1 below, debt to equity
of Qantas decreased over the last four years. It also experienced a corresponding decrease in
its debt ratio over the same period. Nonetheless, the company equity ratio increased over the
period which is culminated in 21% in 2017. This is a clear indication that the company is
utilizing equity finance than debt finances.
Table 3: Capital structure
2015 2016 2017
Debt to Equity 4.09 4.13 3.87
Debt ratio 0.80 0.80 0.79
Equity ratio 20% 19% 21%
7. Conclusion
Based on the above analysis, it is evident that Qantas experienced significant variation
between 2014 and 2017 in its financial performance. Its revenue shows significant growth
over the last four years. Besides, based on the above analysis, it is evident that the company is
financially weak. Hence, it calls for necessary measures in order to boost its financial
performance and health over time. Besides, it can be concluded that Qantas has an
outstanding financial performance over the past three years having recorded significant total
profit before taxation which is considered as the second highest in its 97 years of its
operations. This shows that the company margin advantage over global and local rivals have
advanced which is underpinned by the completion of its major transformation.
QANTAS ANALYSIS 12
Based its profitability ratios, it can be stated that the company experienced strong
financial results in 2015 and 2016 followed by significant deterioration in the financial year
2017. Its liquidity ratios and capital structure ratio results are clear signs that the company is
in greater risk in settling all both its short- and long-term debts commitments.
⊘ This is a preview!⊘
Do you want full access?
Subscribe today to unlock all pages.
Trusted by 1+ million students worldwide
1 out of 27
Related Documents


Your All-in-One AI-Powered Toolkit for Academic Success.
+13062052269
info@desklib.com
Available 24*7 on WhatsApp / Email
![[object Object]](/_next/static/media/star-bottom.7253800d.svg)
Unlock your academic potential
Copyright © 2020–2026 A2Z Services. All Rights Reserved. Developed and managed by ZUCOL.