BSMAN 3009: Qantas Airways Financial Analysis and Performance Report
VerifiedAdded on 2023/06/03
|20
|4521
|452
Report
AI Summary
This report presents a financial analysis of Qantas Airways, evaluating its performance through various financial ratios. The analysis covers profitability, liquidity, capital structure, and asset efficiency, providing a comprehensive overview of Qantas's financial health. The report compares Qantas's performance with its competitor, Virgin Australia, to provide an industry perspective. Key ratios such as Return on Capital Employed, Net Profit Margin, Current Ratio, Quick Ratio, Debt to Equity Ratio, and Interest Coverage Ratio are calculated and interpreted. The study aims to assess Qantas's financial strengths and weaknesses, offering insights into its operational efficiency and market position within the Australian aviation industry. The report concludes with recommendations based on the financial findings.

Running Head: Accounting for managers
1
Project Report: Accounting for managers
1
Project Report: Accounting for managers
Paraphrase This Document
Need a fresh take? Get an instant paraphrase of this document with our AI Paraphraser

Accounting for managers
2
Contents
Introduction................................................................................................................................3
Company overview....................................................................................................................3
Financial analysis.......................................................................................................................3
Profitability analysis...............................................................................................................4
Return on capital employed................................................................................................4
Net profit margin................................................................................................................5
Liquidity analysis...................................................................................................................6
Current Ratio.......................................................................................................................6
Quick Ratio.........................................................................................................................7
Capital structure analysis........................................................................................................8
Debt to equity ratio.............................................................................................................8
Interest coverage ratio.........................................................................................................9
Asset efficiency analysis......................................................................................................10
Trade payable payment period ratio.................................................................................10
Receivables Turnover (days)............................................................................................11
Market performance analysis...............................................................................................11
Earnings per share.............................................................................................................12
Dividend coverage ratio....................................................................................................13
Recommendation and conclusion............................................................................................13
References................................................................................................................................15
Appendix..................................................................................................................................17

Accounting for managers
3
Introduction:
Financial analysis is an approach which is used by the financial managers and the
external stakeholders such as suppliers, financial institution, stakeholders etc to identify the
performance and the overall position of the business. The financial analysis study makes it
easy for the business to evaluate the business, project, budgets, financial information and
other financial entities in order to make better strategies and policies to meet the common
goal of the business (Brigham & Ehrhardt, 2013). In this report, the financial analysis study
has been performed on the Qantas airways to identify the overall performance of the
company and the changes in the company from that last year. Along with that, the financial
performance of the company has been compared with the peer competitor, virgin Australia to
measure the industry performance of the business. In order to identify the financial
performance of the business, ratio analysis, one of the financial analysis method, has been
applied on Qantas limited and Virgin Australia limited.
Company overview:
Qantas airways in an Australian company which is operating in the Australian
aviation industry. The company has been founded on 16th November 1920. The business has
been commenced in the month of March in 1921. Headquarter of the company is in
Queensland, Australia. Currently, the company has almost 127 fleet sizes which are largest in
the Australian market and it is offering its services on 85 destinations (Home, 2018). The
Qantas is the oldest aviation company in the Australian market and third oldest at
international market. Around 95% of market share of Australian aviation industry is held by
the Qantas limited. The company manages its operations and activities through its subsidiary
companies.
Financial analysis:
Financial analysis is an analytical process which involves various methods to collect
the financial information and evaluates them in order to identify the financial process and
make decision about the company’s performance. In the report, the ratio analysis method has
been taken into the concern to identify the financial performance and make decision about the
company’s investment level. Ratio analysis study ensures that whether the entity is stable,
liquid, solvency or profitable enough to manage the monetary investment of the company
(Moyer, McGuigan, Rao & Kretlow, 2011). The ratio analysis study of Qantas limited is as
follows:
⊘ This is a preview!⊘
Do you want full access?
Subscribe today to unlock all pages.
Trusted by 1+ million students worldwide

Accounting for managers
4
Profitability analysis:
Profitability ratio analysis is a metrics which evaluates the financial statement of the
company to identify the total earnings generated by the company against the relative
expenses and the available resources of the business. Normally, it is measurement basis
which evaluates the profitability position of the business. It simply identifies the capability of
the business to generate the profitability. The ratio is important for the internal as well as
external stakeholders of the business to identify that how much profit has been generated by
the business and through which alterations, the profitability position of the business could be
improved more (Vogrl, 2014). In the report, the return on capital employed and the net
profitability ratios have been calculated and compared with the profitability ratios of Virgin
Australia limited to measure the changes and performance of the company in the aviation
industry of Australia. The profitability analysis study of Qantas airways is as follows:
Return on capital employed:
Return on capital employed is a profitability ratio which measures the total earnings
before interest and tax against the capital employed of the business. It identifies that how
much earnings could be generated before deducting the interest and tax expenses against the
capital employed of the business (Baker & English, 2011). The ROCE study has been
perform on Qantas limited and Virgin Australia to identify the performance of Qantas limited
in the industry:
Figure 1: Return on capital employed
(Annual report, 2018)
Paraphrase This Document
Need a fresh take? Get an instant paraphrase of this document with our AI Paraphraser

Accounting for managers
5
Return on capital employed of Qantas explains that the return from the last year has
been improved. The ROCE was 15.4% and 16.08% in the year of 2017 and 2018. It explains
that the profitability position of the company has been improved from the last year. Further,
in order to identify the industry position of the company, Virgin Australia’s ROCE has been
calculated and it has been found that the profitability position of the company has been
improved from 8.28% to 17.44%. The increment rate of virgin is quite higher as well as the
profitability position of the company is also highest. It explains that the Qantas is required to
improve the profitability position in the market.
Net profit margin:
Net profit margin is a profitability ratio which measures the total net profit against the
total sales of the business. It identifies that how much net earnings could be generated against
the total sales of the business (Brigham & Daves, 2012). The net profit margin study has been
performed on Qantas limited and Virgin Australia to identify the performance of Qantas
limited in the industry:
Figure 2: Net profit margin
(Annual report, 2018)
Net profit position of Qantas explains that the net profit margin was 5.4% and 5.9% in
the year of 2017 and 2018. It explains that the profitability position of the company has been
improved from the last year. Further, in order to identify the industry position of the
company, Virgin Australia’s net profit margin has been calculated and it has been found that
the profitability position of the company has been reduced from 8.-4.4% to -12.6% (Chandra,

Accounting for managers
6
2011). The rate explains that the Qantas profit margin is highest in the market and lead to the
conclusion that better position is maintained by the company.
Liquidity analysis:
Liquidity ratio analysis is a metrics which evaluates the financial statement of the
company to identify the total cash and short term debt assets managed by the company
against the short term debt obligation of the business. Normally, it is measurement basis
which evaluates the liquidity position of the business. It simply identifies the capability of the
business to manage the funds against the short term debt obligation of the company. The ratio
is important for the internal as well as external stakeholders of the business to identify that
whether the business is enough capable to meet the short term debt obligation or the company
does not have enough funds to maintain the liquidity position (Haney, 2009). In the report,
the current ratio and quick ratio have been calculated and compared with the liquidity ratios
of Virgin Australia limited to measure the changes and performance of the company in the
aviation industry of Australia. The liquidity analysis study of Qantas airways is as follows:
Current Ratio:
Current ratio is a liquidity ratio which measures the total current assets against the
current liabilities of the business. It identifies that how much current assets are managed by
the company against the current liabilities to pay off the short term debt obligation of the
company (Gibson, 2011). The current ratio study has been performed on Qantas limited and
Virgin Australia to identify the performance of Qantas limited in the industry:
Figure 3: Current Ratio
⊘ This is a preview!⊘
Do you want full access?
Subscribe today to unlock all pages.
Trusted by 1+ million students worldwide

Accounting for managers
7
(Annual report, 2018)
Current ratio of Qantas explains that the liquidity position of the company has been
improved from 0.44 to 0.49 in the year of 2018. These changes have occurred because of the
higher current assets of the business. However, the industry position explains that the current
ratio of virgin is 0.78 which is quite higher than the Qantas and explains that the liquidity risk
of the industry is quite better than the Qantas position. Qantas is required to improve the
level of the current assets to manage the liquidity risk and short term debt obligation position
of the business.
Quick Ratio:
Quick ratio is a liquidity ratio which measures the total quick assets against the
current liabilities of the business. It identifies that how much quick assets are managed by the
company against the current liabilities to pay off the short term debt obligation of the
company (Baker, Dutta & Saadi, 2010). The quick ratio study has been performed on Qantas
limited and Virgin Australia to identify the performance of Qantas limited in the industry:
Figure 4: Quick ratio
(Annual report, 2017)
Further, the quick ratio of Qantas explains that the liquidity position of the company
has been improved from 0.39 to 0.44 in the year of 2018. These changes have occurred
because of the higher availability of quick assets of the business. However, the industry
position explains that the current ratio of virgin is 0.77 which is quite higher than the Qantas
and explains that the liquidity risk of the industry is quite better than the Qantas position.
Paraphrase This Document
Need a fresh take? Get an instant paraphrase of this document with our AI Paraphraser

Accounting for managers
8
Qantas is required to improve the level of the current assets to manage the liquidity risk and
short term debt obligation position of the business
Capital structure analysis:
Capital structure ratio analysis is a metrics which evaluates the financial statement of
the company to identify the total debts and liabilities managed by the company against the
total resources and the total equity of the business. Normally, it is measurement basis which
evaluates the long term debt obligation of the business. It simply identifies the capability of
the business to manage the funds against the long term debt obligation of the company. The
ratio is important for the internal as well as external stakeholders of the business to identify
the leverage position and financial risk of the business (Ahrendsen & Katchova, 2012). In the
report, the debt to equity ratio and interest coverage ratio have been calculated and compared
with the capital structure ratios of Virgin Australia limited to measure the changes and
performance of the company in the aviation industry of Australia. The capital structure
analysis study of Qantas airways is as follows:
Debt to equity ratio:
Debt to equity ratio is a capital structure ratio which measures the total debt against
the available equity of the company. It identifies that how much debts are managed by the
company against the equity to manage the optimal capital structure level of the company. The
debt to equity ratio study has been performed on Qantas limited and Virgin Australia to
identify the performance of Qantas limited in the industry:
Figure 5: Debt to equity ratio

Accounting for managers
9
(Annual report, 2017)
Debt to equity ratio of Qantas explains that the capital structure position of the
company has been reduced from 186.29% and 179.35% in the year of 2018. These changes
have occurred because of the lower equity of the business. However, the industry position
explains that the debt to equity ratio of virgin is 235.84% which is quite higher than the
Qantas and explains that the long term liabilities of the industry and Qantas both are higher
than the equity level (Madhura, 2015). Qantas is required to reduce the debt level in order to
manage the optimal capital level and the long term debt obligation of the business.
Interest coverage ratio:
Interest coverage ratio is a capital structure ratio which measures that whether the
company is able to pay the interest amount from the available earnings. The interest coverage
ratio study has been performed on Qantas limited and Virgin Australia to identify the
performance of Qantas limited in the industry:
Figure 6: Interest coverage ratio
(Annual report, 2018)
Interest coverage ratio of Qantas explains that the level of the company has been
improved from 6.63 to 7.73 in the year of 2018. These explain that the EBIT level of the
business has been improved and it improved the interest payment capabilities of the business.
However, the industry position explains that the interest coverage ratio of virgin is 3.72
which is lower than the Qantas and explains that the capital structure position of Qantas is
better in the industry.
⊘ This is a preview!⊘
Do you want full access?
Subscribe today to unlock all pages.
Trusted by 1+ million students worldwide

Accounting for managers
10
Asset efficiency analysis:
Asset efficiency analysis ratio analysis is a metrics which evaluates the financial
statement of the company to identify the total sales generated by the company against the
total resources of the business. Normally, it is measurement basis which evaluates the various
short term assets and liabilities against the resources to measure the total sales generation
capabilities of the business (Brigham & Houston, 2012). It simply identifies the capability of
the business to manage and improve the sales level and working capital position of the
business. The ratio is important for the internal stakeholders of the business to identify the
working capital requirement and make the changes into the internal function of the business
(Brigham & Houston, 2012). In the report, the Trade payable payment period ratio and
Receivables Turnover (days) have been calculated and compared with the asset efficiency
ratios of Virgin Australia limited to measure the changes and performance of the company in
the aviation industry of Australia. The asset efficiency analysis study of Qantas airways is as
follows:
Trade payable payment period ratio:
Trade payable payment period ratio is an asset efficiency ratio which measures the
total time period in which the payable amount would be paid by the business to its creditors.
The trade payable payment period ratio study has been performed on Qantas limited and
Virgin Australia to identify the performance of Qantas limited in the industry:
Figure 7: Trade payable payment period ratio
(Annual report, 2017)
Paraphrase This Document
Need a fresh take? Get an instant paraphrase of this document with our AI Paraphraser
Accounting for managers
11
Trade payable payment period ratio of Qantas explains that the asset efficiency
position of the company has been improved from 117 days to 123 days in the year of 2018.
These changes have occurred because of higher turnover of credit days. However, the
industry position explains that the payable day ratio of virgin is 298 days which is quite
higher than the Qantas and explains that the efficacy position of Qantas is lower and it could
be improved by the company through making the changes in the credit days.
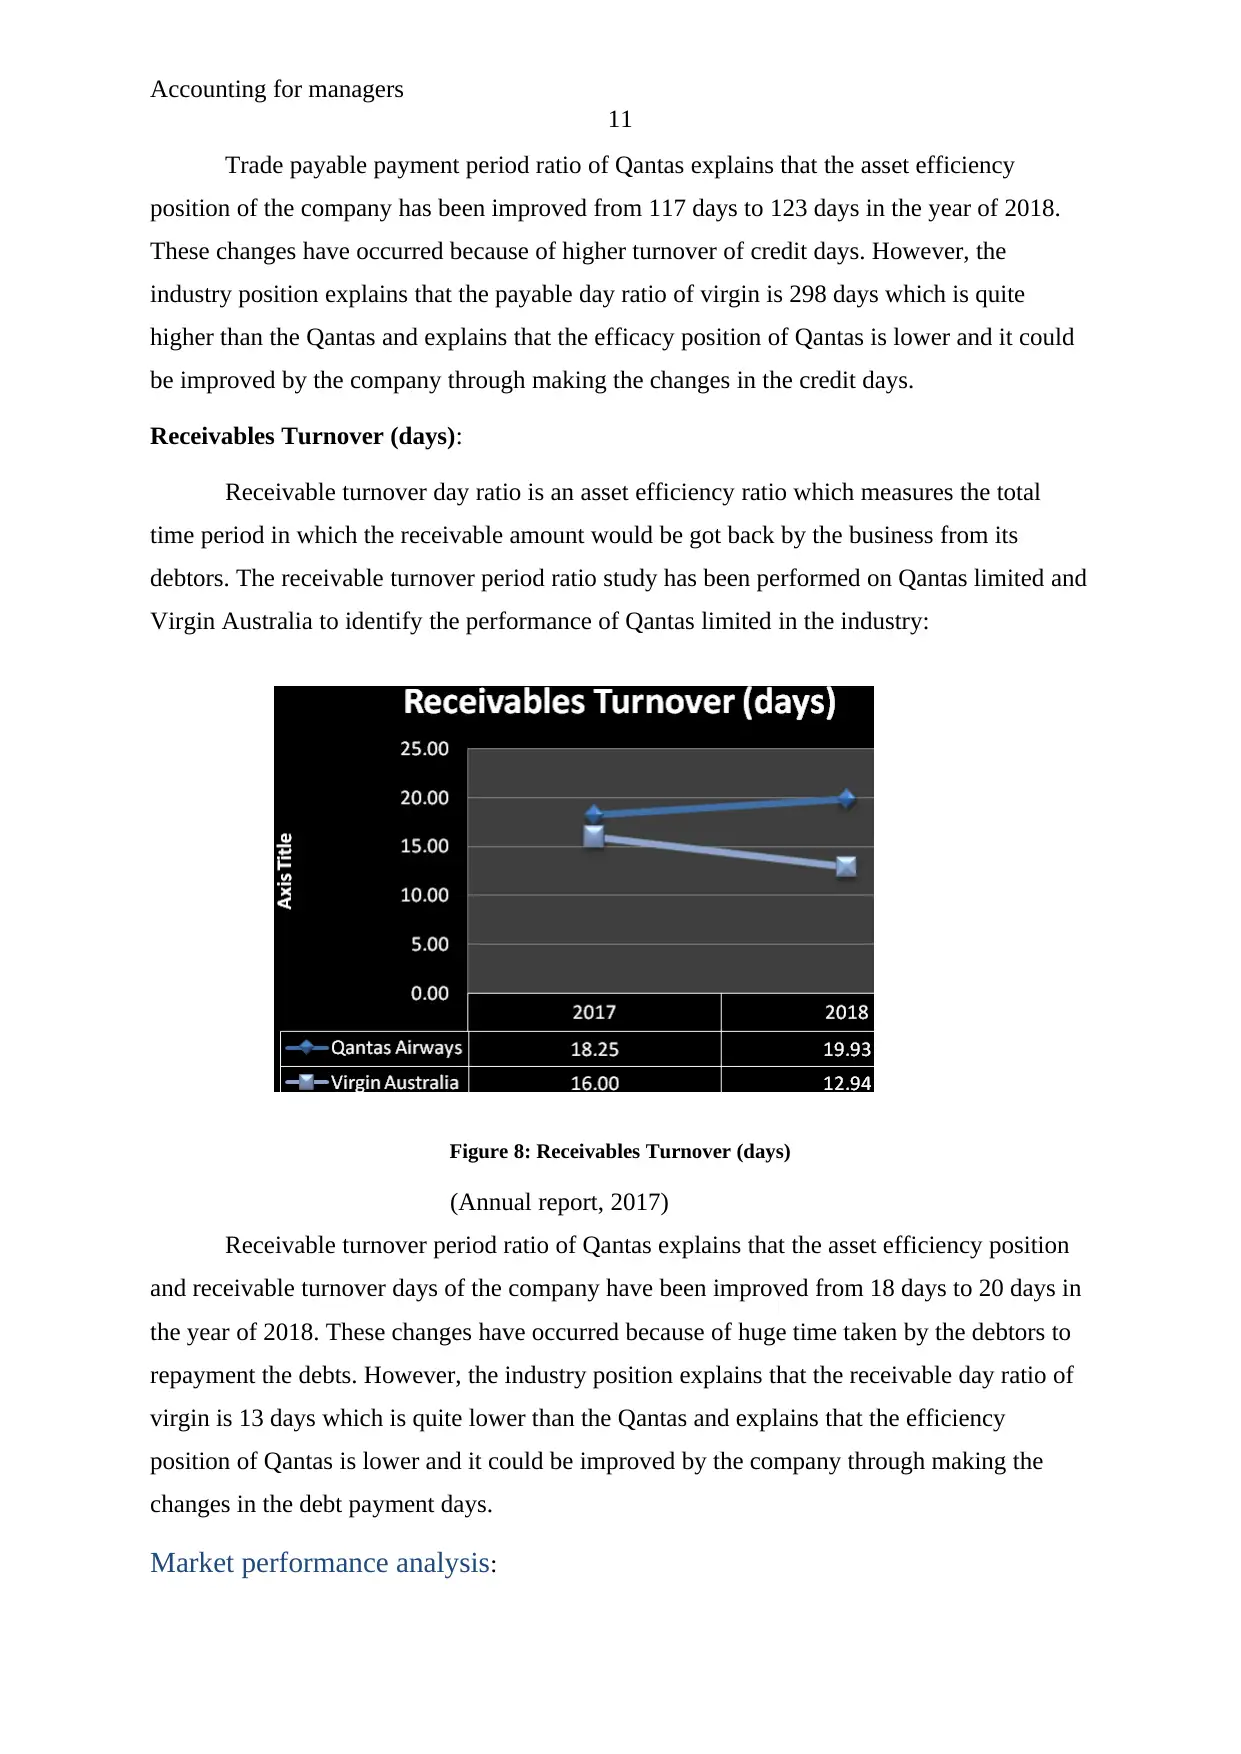
Receivables Turnover (days):
Receivable turnover day ratio is an asset efficiency ratio which measures the total
time period in which the receivable amount would be got back by the business from its
debtors. The receivable turnover period ratio study has been performed on Qantas limited and
Virgin Australia to identify the performance of Qantas limited in the industry:
Figure 8: Receivables Turnover (days)
(Annual report, 2017)
Receivable turnover period ratio of Qantas explains that the asset efficiency position
and receivable turnover days of the company have been improved from 18 days to 20 days in
the year of 2018. These changes have occurred because of huge time taken by the debtors to
repayment the debts. However, the industry position explains that the receivable day ratio of
virgin is 13 days which is quite lower than the Qantas and explains that the efficiency
position of Qantas is lower and it could be improved by the company through making the
changes in the debt payment days.
Market performance analysis:
11
Trade payable payment period ratio of Qantas explains that the asset efficiency
position of the company has been improved from 117 days to 123 days in the year of 2018.
These changes have occurred because of higher turnover of credit days. However, the
industry position explains that the payable day ratio of virgin is 298 days which is quite
higher than the Qantas and explains that the efficacy position of Qantas is lower and it could
be improved by the company through making the changes in the credit days.
Receivables Turnover (days):
Receivable turnover day ratio is an asset efficiency ratio which measures the total
time period in which the receivable amount would be got back by the business from its
debtors. The receivable turnover period ratio study has been performed on Qantas limited and
Virgin Australia to identify the performance of Qantas limited in the industry:
Figure 8: Receivables Turnover (days)
(Annual report, 2017)
Receivable turnover period ratio of Qantas explains that the asset efficiency position
and receivable turnover days of the company have been improved from 18 days to 20 days in
the year of 2018. These changes have occurred because of huge time taken by the debtors to
repayment the debts. However, the industry position explains that the receivable day ratio of
virgin is 13 days which is quite lower than the Qantas and explains that the efficiency
position of Qantas is lower and it could be improved by the company through making the
changes in the debt payment days.
Market performance analysis:
Accounting for managers
12
Market performance analysis ratio analysis is a metrics which evaluates the financial
statement of the company to identify the total profit and earnings generated by the company
for each of the shareholders of the business. Normally, it is measurement basis which
evaluates the capital position and stockholder’s position in the company. It simply identifies
the capability of the business to offer the dividend to its shareholders among the available
profit (Higgins, 2012). The ratio is important for the external stakeholders of the business to
identify the total return generated by the company and total return which would be distributed
by the company in the market. In the report, the earnings per share and dividend coverage
ratio have been calculated and compared with the market performance ratios of Virgin
Australia limited to measure the changes and performance of the company in the aviation
industry of Australia. The market performance analysis study of Qantas airways is as follows:
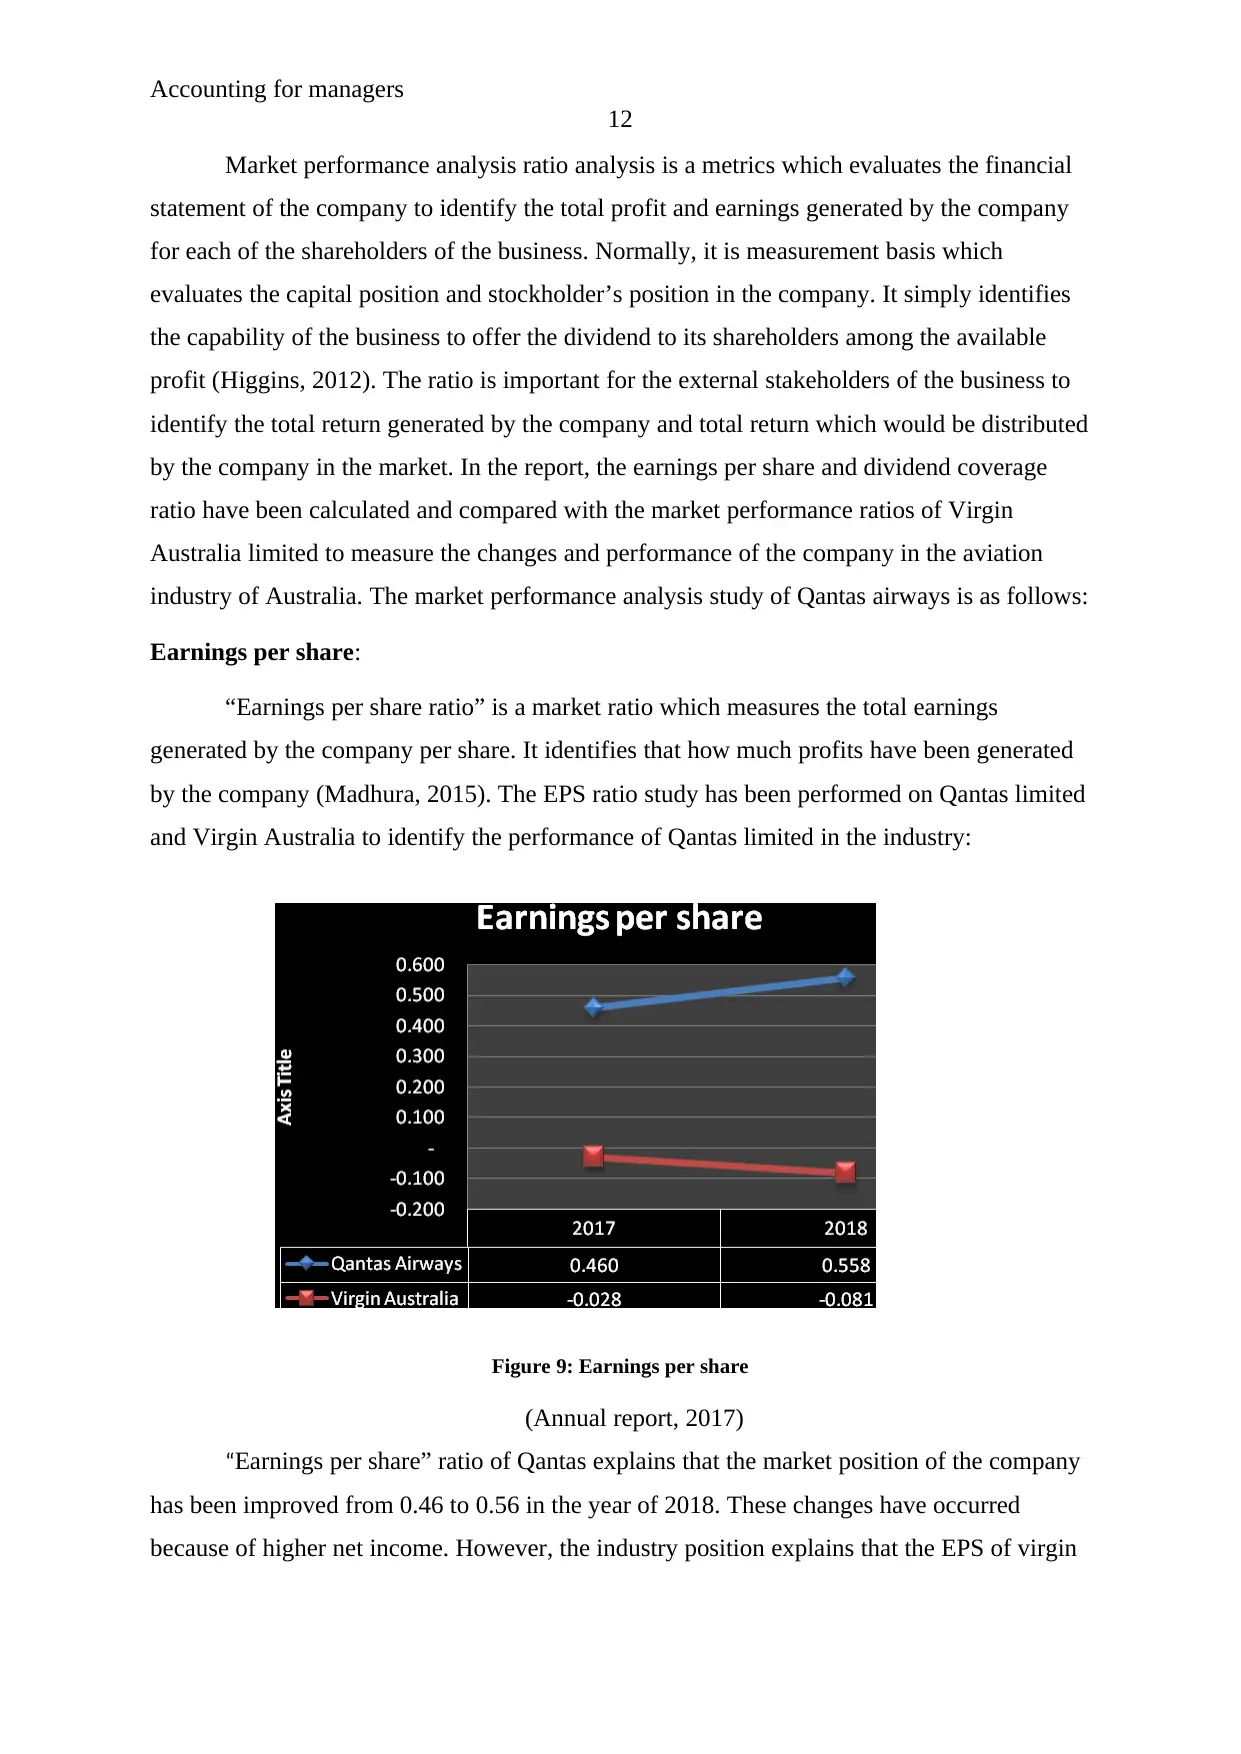
Earnings per share:
“Earnings per share ratio” is a market ratio which measures the total earnings
generated by the company per share. It identifies that how much profits have been generated
by the company (Madhura, 2015). The EPS ratio study has been performed on Qantas limited
and Virgin Australia to identify the performance of Qantas limited in the industry:
Figure 9: Earnings per share
(Annual report, 2017)
“Earnings per share” ratio of Qantas explains that the market position of the company
has been improved from 0.46 to 0.56 in the year of 2018. These changes have occurred
because of higher net income. However, the industry position explains that the EPS of virgin
12
Market performance analysis ratio analysis is a metrics which evaluates the financial
statement of the company to identify the total profit and earnings generated by the company
for each of the shareholders of the business. Normally, it is measurement basis which
evaluates the capital position and stockholder’s position in the company. It simply identifies
the capability of the business to offer the dividend to its shareholders among the available
profit (Higgins, 2012). The ratio is important for the external stakeholders of the business to
identify the total return generated by the company and total return which would be distributed
by the company in the market. In the report, the earnings per share and dividend coverage
ratio have been calculated and compared with the market performance ratios of Virgin
Australia limited to measure the changes and performance of the company in the aviation
industry of Australia. The market performance analysis study of Qantas airways is as follows:
Earnings per share:
“Earnings per share ratio” is a market ratio which measures the total earnings
generated by the company per share. It identifies that how much profits have been generated
by the company (Madhura, 2015). The EPS ratio study has been performed on Qantas limited
and Virgin Australia to identify the performance of Qantas limited in the industry:
Figure 9: Earnings per share
(Annual report, 2017)
“Earnings per share” ratio of Qantas explains that the market position of the company
has been improved from 0.46 to 0.56 in the year of 2018. These changes have occurred
because of higher net income. However, the industry position explains that the EPS of virgin
⊘ This is a preview!⊘
Do you want full access?
Subscribe today to unlock all pages.
Trusted by 1+ million students worldwide
1 out of 20
Related Documents


Your All-in-One AI-Powered Toolkit for Academic Success.
+13062052269
info@desklib.com
Available 24*7 on WhatsApp / Email
![[object Object]](/_next/static/media/star-bottom.7253800d.svg)
Unlock your academic potential
Copyright © 2020–2026 A2Z Services. All Rights Reserved. Developed and managed by ZUCOL.