Financial Analysis of Qantas Airline: An Investment Consideration
VerifiedAdded on 2021/06/16
|15
|3343
|18
Report
AI Summary
This report provides a comprehensive financial analysis of Qantas Airline, focusing on its performance from 2015 to 2017. The analysis utilizes various financial ratios, including liquidity, efficiency, solvency, and profitability ratios, to assess the airline's financial health and investment potential. The report calculates and interprets ratios such as current ratio, quick ratio, accounts receivable turnover, debt-to-asset ratio, and profit margin. The findings offer insights into Qantas's ability to manage its short-term obligations, operational efficiency, leverage, and profitability. The analysis aims to determine whether Qantas is a good consideration for investment, offering recommendations based on the financial performance evaluation. The report provides a detailed overview of the company's financial statements, enabling a thorough understanding of its financial position and performance trends.
Running head: HOSPITALITY FINANCE AND REVENUE
Hospitality finance and revenue
Name of the student
Name of the university
Student ID
Author note
Hospitality finance and revenue
Name of the student
Name of the university
Student ID
Author note
Paraphrase This Document
Need a fresh take? Get an instant paraphrase of this document with our AI Paraphraser
1HOSPITALITY FINANCE AND REVENUE
Abstract
The main objective of the report is to analyse the financial performance of Qantas airline to
consider it from the investment aspect. The report will consider the financial statement of the
company for the year ended 2015, 2016 and 2017 and will calculate various ratios like
profitability ratio, solvency ratio, liquidity ratio and efficiency ratio. After analysing the
company’s performance through the ratios conclusions will be provide to measure whether
the company is a good consideration for investment or not and based on that some
recommendations will be provided.
2HOSPITALITY FINANCE AND REVENUE
Table of Contents
1.0 Introduction..........................................................................................................................3
2.0 Analysis of ratio...................................................................................................................3
2.1 Liquidity ratio...................................................................................................................5
2.2 Efficiency ratio.................................................................................................................6
2.3 Solvency ratio...................................................................................................................7
2.4 Profitability ratio..............................................................................................................9
3.0 Conclusion..........................................................................................................................10
4.0 Recommendation................................................................................................................10
Reference..................................................................................................................................12
⊘ This is a preview!⊘
Do you want full access?
Subscribe today to unlock all pages.
Trusted by 1+ million students worldwide
3HOSPITALITY FINANCE AND REVENUE
1.0 Introduction
The aim of the report is analysing Qantas Airline’s financial report with the
investment aspect. The report will interpret and analyse the performance taking into account
various financial ratio for the current year that is 2017 and comparing it with the previous
years that is 2016 and 2015. Ratios that will be considered are the efficiency ratio,
profitability ratio, liquidity ratio and solvency ratio. After analysing the performance of the
company through the ratios conclusions will be provide to measure whether the company is a
good consideration for investment or not and based on that some recommendations will be
provided.
Established in the year 1920, Qantas airline is counted among the largest domestic as
well as internal airlines in Australia. The company is engaged in mainly transportation
service through two of its complementary brand named as Qantas and Jetstar. Qantas is well
known for providing excellent services to its customers and for the engineering, maintenance,
customer’s safety, operational liability. Additional business carried out by the airline is the Q
catering under the specialist market. The company employs more than 30,000 employs out of
which more than 93% is Australian based. It provides regional, domestic and international
services and its main objective is to revolutionalise air transport all over the market segments.
The company achieves its objectives through providing smooth experience through all over
the domestic as well as the international market apart from retaining the excellence in service
level (Flights | Qantas AU, 2018).
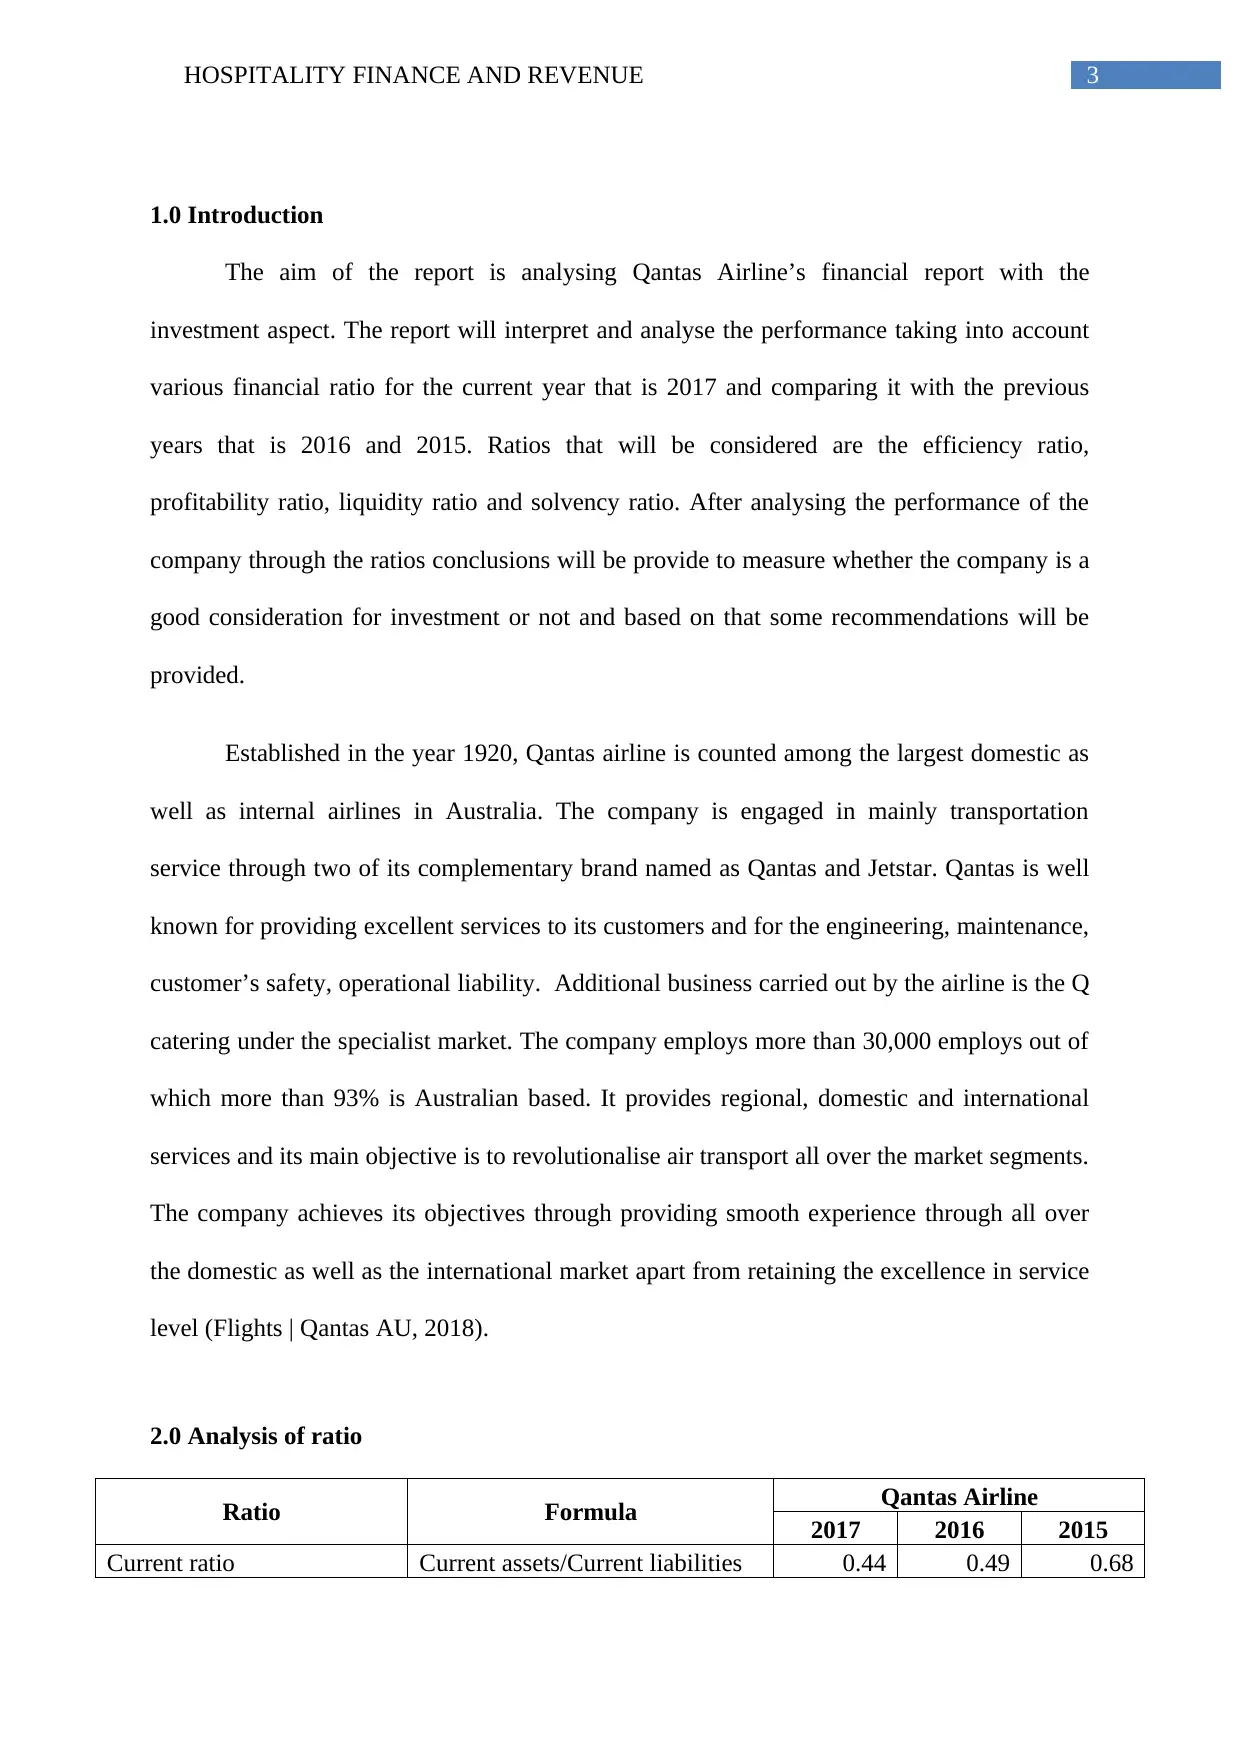
2.0 Analysis of ratio
Ratio Formula Qantas Airline
2017 2016 2015
Current ratio Current assets/Current liabilities 0.44 0.49 0.68
1.0 Introduction
The aim of the report is analysing Qantas Airline’s financial report with the
investment aspect. The report will interpret and analyse the performance taking into account
various financial ratio for the current year that is 2017 and comparing it with the previous
years that is 2016 and 2015. Ratios that will be considered are the efficiency ratio,
profitability ratio, liquidity ratio and solvency ratio. After analysing the performance of the
company through the ratios conclusions will be provide to measure whether the company is a
good consideration for investment or not and based on that some recommendations will be
provided.
Established in the year 1920, Qantas airline is counted among the largest domestic as
well as internal airlines in Australia. The company is engaged in mainly transportation
service through two of its complementary brand named as Qantas and Jetstar. Qantas is well
known for providing excellent services to its customers and for the engineering, maintenance,
customer’s safety, operational liability. Additional business carried out by the airline is the Q
catering under the specialist market. The company employs more than 30,000 employs out of
which more than 93% is Australian based. It provides regional, domestic and international
services and its main objective is to revolutionalise air transport all over the market segments.
The company achieves its objectives through providing smooth experience through all over
the domestic as well as the international market apart from retaining the excellence in service
level (Flights | Qantas AU, 2018).
2.0 Analysis of ratio
Ratio Formula Qantas Airline
2017 2016 2015
Current ratio Current assets/Current liabilities 0.44 0.49 0.68
Paraphrase This Document
Need a fresh take? Get an instant paraphrase of this document with our AI Paraphraser
4HOSPITALITY FINANCE AND REVENUE
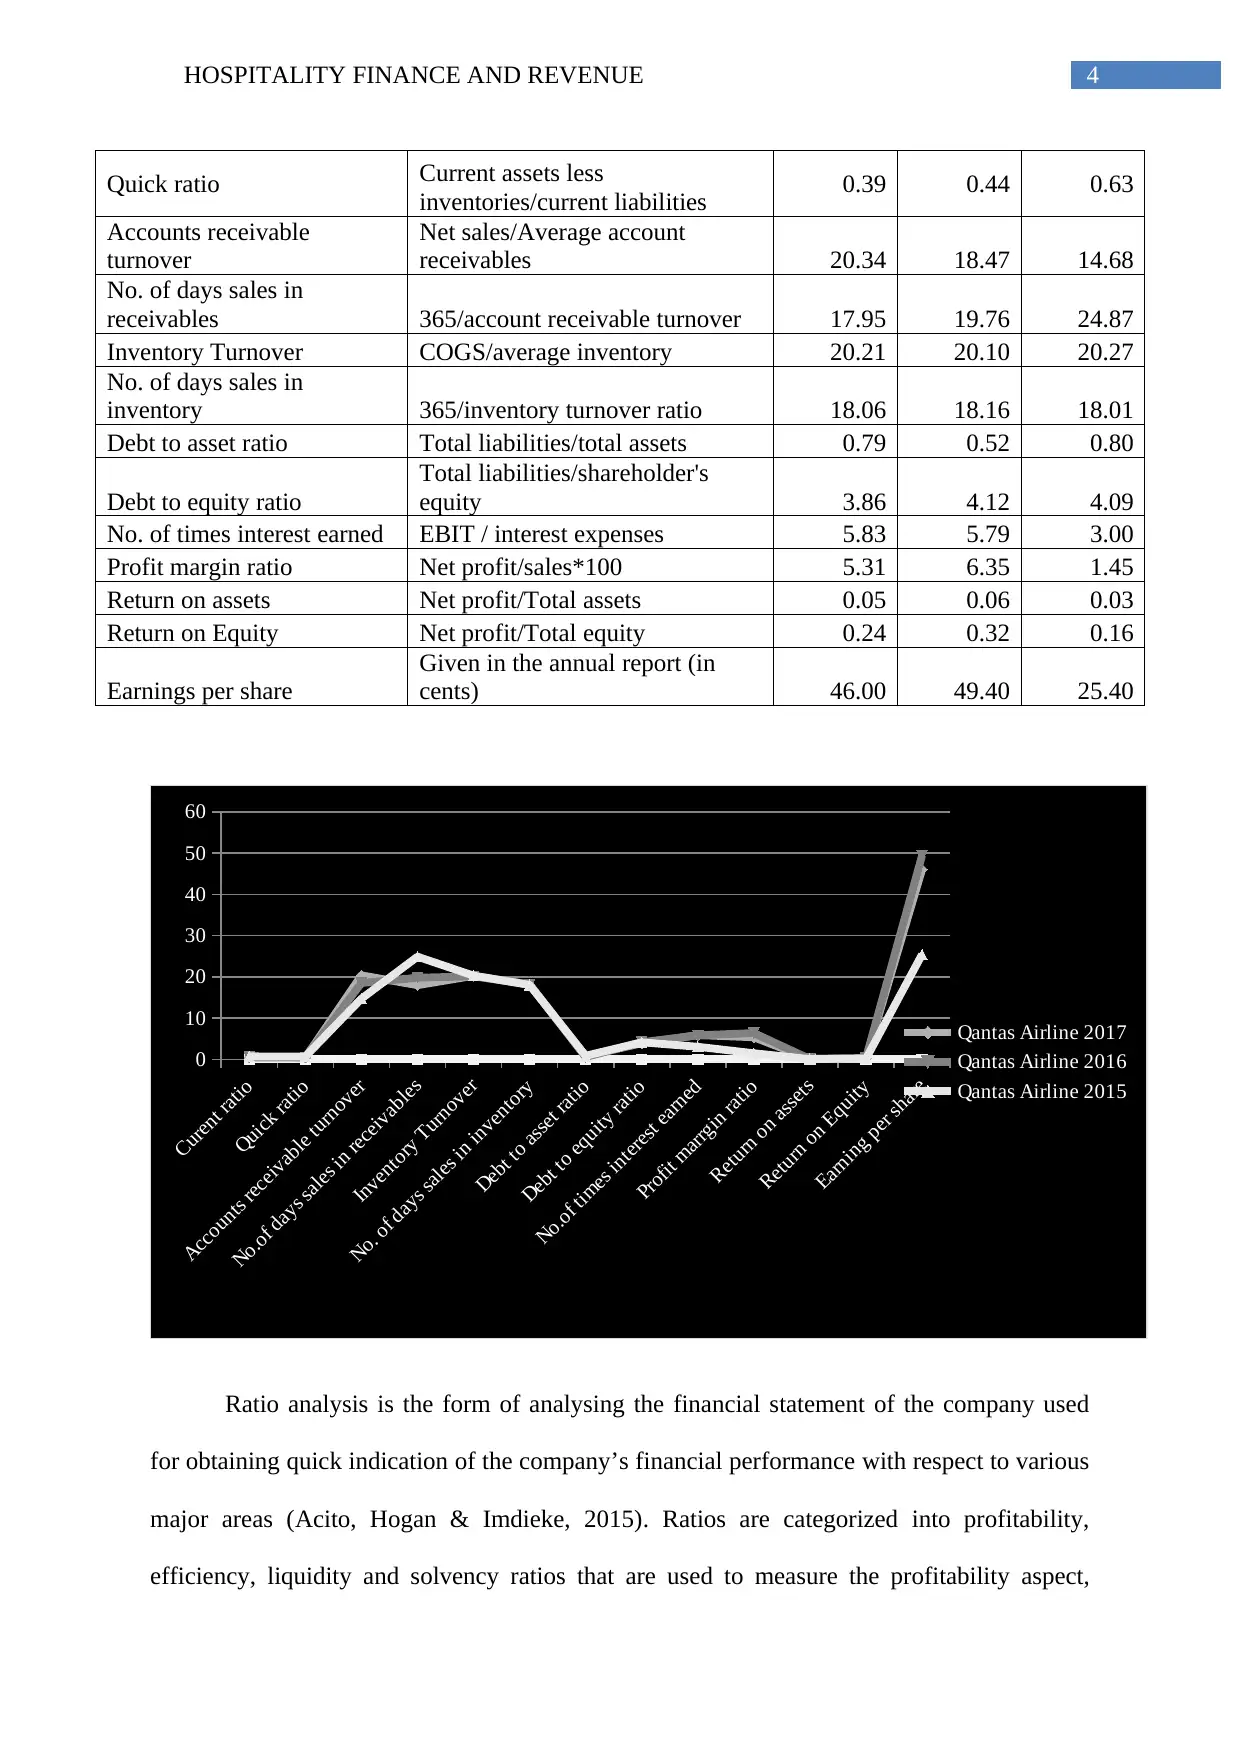
Quick ratio Current assets less
inventories/current liabilities 0.39 0.44 0.63
Accounts receivable
turnover
Net sales/Average account
receivables 20.34 18.47 14.68
No. of days sales in
receivables 365/account receivable turnover 17.95 19.76 24.87
Inventory Turnover COGS/average inventory 20.21 20.10 20.27
No. of days sales in
inventory 365/inventory turnover ratio 18.06 18.16 18.01
Debt to asset ratio Total liabilities/total assets 0.79 0.52 0.80
Debt to equity ratio
Total liabilities/shareholder's
equity 3.86 4.12 4.09
No. of times interest earned EBIT / interest expenses 5.83 5.79 3.00
Profit margin ratio Net profit/sales*100 5.31 6.35 1.45
Return on assets Net profit/Total assets 0.05 0.06 0.03
Return on Equity Net profit/Total equity 0.24 0.32 0.16
Earnings per share
Given in the annual report (in
cents) 46.00 49.40 25.40
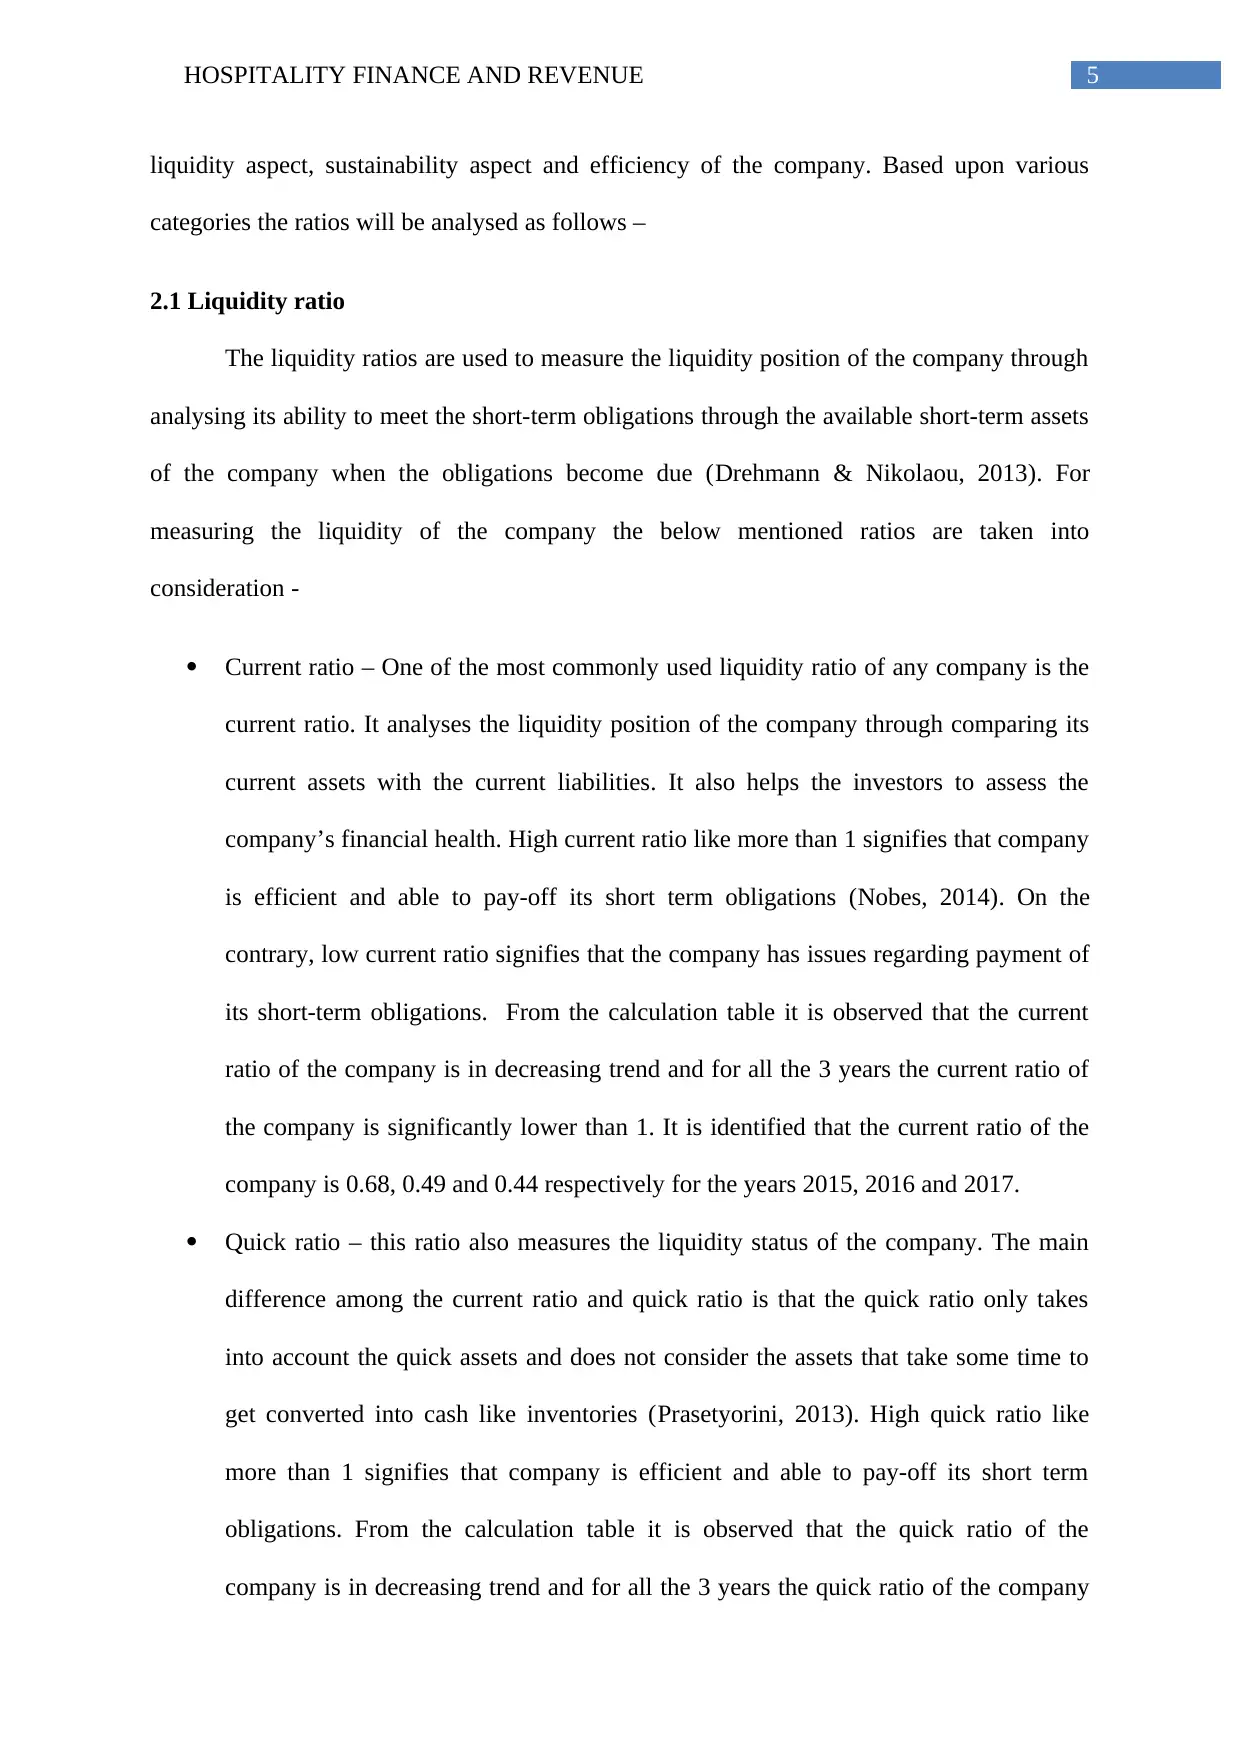
Curent ratio
Quick ratio
Accounts receivable turnover
No.of days sales in receivables
Inventory Turnover
No. of days sales in inventory
Debt to asset ratio
Debt to equity ratio
No.of times interest earned
Profit marrgin ratio
Return on assets
Return on Equity
Earning per share
0
10
20
30
40
50
60
Qantas Airline 2017
Qantas Airline 2016
Qantas Airline 2015
Ratio analysis is the form of analysing the financial statement of the company used
for obtaining quick indication of the company’s financial performance with respect to various
major areas (Acito, Hogan & Imdieke, 2015). Ratios are categorized into profitability,
efficiency, liquidity and solvency ratios that are used to measure the profitability aspect,
Quick ratio Current assets less
inventories/current liabilities 0.39 0.44 0.63
Accounts receivable
turnover
Net sales/Average account
receivables 20.34 18.47 14.68
No. of days sales in
receivables 365/account receivable turnover 17.95 19.76 24.87
Inventory Turnover COGS/average inventory 20.21 20.10 20.27
No. of days sales in
inventory 365/inventory turnover ratio 18.06 18.16 18.01
Debt to asset ratio Total liabilities/total assets 0.79 0.52 0.80
Debt to equity ratio
Total liabilities/shareholder's
equity 3.86 4.12 4.09
No. of times interest earned EBIT / interest expenses 5.83 5.79 3.00
Profit margin ratio Net profit/sales*100 5.31 6.35 1.45
Return on assets Net profit/Total assets 0.05 0.06 0.03
Return on Equity Net profit/Total equity 0.24 0.32 0.16
Earnings per share
Given in the annual report (in
cents) 46.00 49.40 25.40
Curent ratio
Quick ratio
Accounts receivable turnover
No.of days sales in receivables
Inventory Turnover
No. of days sales in inventory
Debt to asset ratio
Debt to equity ratio
No.of times interest earned
Profit marrgin ratio
Return on assets
Return on Equity
Earning per share
0
10
20
30
40
50
60
Qantas Airline 2017
Qantas Airline 2016
Qantas Airline 2015
Ratio analysis is the form of analysing the financial statement of the company used
for obtaining quick indication of the company’s financial performance with respect to various
major areas (Acito, Hogan & Imdieke, 2015). Ratios are categorized into profitability,
efficiency, liquidity and solvency ratios that are used to measure the profitability aspect,
5HOSPITALITY FINANCE AND REVENUE
liquidity aspect, sustainability aspect and efficiency of the company. Based upon various
categories the ratios will be analysed as follows –
2.1 Liquidity ratio
The liquidity ratios are used to measure the liquidity position of the company through
analysing its ability to meet the short-term obligations through the available short-term assets
of the company when the obligations become due (Drehmann & Nikolaou, 2013). For
measuring the liquidity of the company the below mentioned ratios are taken into
consideration -
Current ratio – One of the most commonly used liquidity ratio of any company is the
current ratio. It analyses the liquidity position of the company through comparing its
current assets with the current liabilities. It also helps the investors to assess the
company’s financial health. High current ratio like more than 1 signifies that company
is efficient and able to pay-off its short term obligations (Nobes, 2014). On the
contrary, low current ratio signifies that the company has issues regarding payment of
its short-term obligations. From the calculation table it is observed that the current
ratio of the company is in decreasing trend and for all the 3 years the current ratio of
the company is significantly lower than 1. It is identified that the current ratio of the
company is 0.68, 0.49 and 0.44 respectively for the years 2015, 2016 and 2017.
Quick ratio – this ratio also measures the liquidity status of the company. The main
difference among the current ratio and quick ratio is that the quick ratio only takes
into account the quick assets and does not consider the assets that take some time to
get converted into cash like inventories (Prasetyorini, 2013). High quick ratio like
more than 1 signifies that company is efficient and able to pay-off its short term
obligations. From the calculation table it is observed that the quick ratio of the
company is in decreasing trend and for all the 3 years the quick ratio of the company
⊘ This is a preview!⊘
Do you want full access?
Subscribe today to unlock all pages.
Trusted by 1+ million students worldwide
6HOSPITALITY FINANCE AND REVENUE
is significantly lower than 1. It is identified that the quick ratio of the company is
0.63, 0.44 and 0.39 respectively for the years 2015, 2016 and 2017.
2.2 Efficiency ratio
The efficiency ratios are computed to assess the company’s operational efficiency. It
is used to measure the efficiency of the company regarding the time taken by the company to
convert its account receivables into cash and converting the inventories into sales (Scott,
2015). To be more specific, it measures the company’s efficiency with respect to usage of its
assets as well as the working capital. Major activity ratios considered for measuring the
efficiency of Qantas Airlines are as follows –
Receivable turnover ratio and number of the days sales in receivables – receivable
turnover ratio is used to measure the efficiency of the company in collecting its credit
sales and converting it into cash. High ratio signifies that the company is highly
efficient in collecting its receivables and take short time in collecting it. On the
contrary, lower ratio signifies the inefficiency of the company (Sunder, 2016).
Number of days the sales in receivable signifies the average days in number the
company takes to collect its receivables after making the sales. Therefore, lower ratio
is considered better as it signifies that the company less time in collecting its
receivables. Looking into the computation table for ratios it is observed that both the
receivable turnover and days sales in inventories for Qantas airline for the years 2015,
2016 and 2017 are in improving trend. Account receivable turnover for the company
is 14.68, 18.47 and 20.34 respectively for 2015, 2016 and 2017. On the other hand,
number of day’s sales in receivables for the company is 24.87 days, 19.76 days and
17.95 days respectively for 2015, 2016 and 2017.
Inventory turnover ratio and number of day’s sales in inventory – inventory turnover
is the efficiency ratio that measures the no. of times the company is able to sell and
Paraphrase This Document
Need a fresh take? Get an instant paraphrase of this document with our AI Paraphraser
7HOSPITALITY FINANCE AND REVENUE
replace its inventories. It is measured through dividing the COGS of the company by
the average inventories. High ratio signifies that the company is highly efficient in
replacing or selling its inventories. On the contrary, lower ratio signifies the
inefficiency of the company. Looking into the calculation table it can be stated that
for the last 3 years the company is stable in selling its inventories and there is not
much changes in the ratio. The inventory turnover ratio for the company is 20.27,
20.10 and 20.21 respectively for 2015, 2016 and 2017. On the other hand, it can be
observed that the number of day’s sales in inventory for the company over the last 3
years is and there is not much changes in the ratio. Number of day’s sales in inventory
for the company is 18.01, 18.16 and 18.06 respectively for 2015, 2016 and 2017.
2.3 Solvency ratio
This ratio is analysed to measure the leverage level of the company. It measures the
solvency of the company through calculating the capital structure and financial risk of the
company. Further, the long-term sustainability of the company is measured through
measuring the long-term borrowings of the company and its ability to pay-off the interest
obligation related to the borrowing (Ch, Patel & White, 2015). Solvency of Qantas airline is
analysed through the following ratios –
Debt to assets ratio – it is the leverage ratio that is measured through comparing the
total liabilities of the company to its total assets. It shows how much proportion of the
assets is financed through borrowing as compared to that of financed by investors.
The ratio of 1 signifies that the assets of the company are equally financed by the
investors as well as borrowings. However the ratio of more than 1 signifies that the
company is highly leveraged (Luez & Wysocki, 2016). From the calculation table it
can be observed that the for all the 3 years the debt to assets ratio of the company is
less than 1 and the ratios are 0.80, 0.52 and 0.79 for 2015, 2016 and 2017
8HOSPITALITY FINANCE AND REVENUE
respectively. Therefore, the company is lower leveraged and less exposed to financial
risk. .
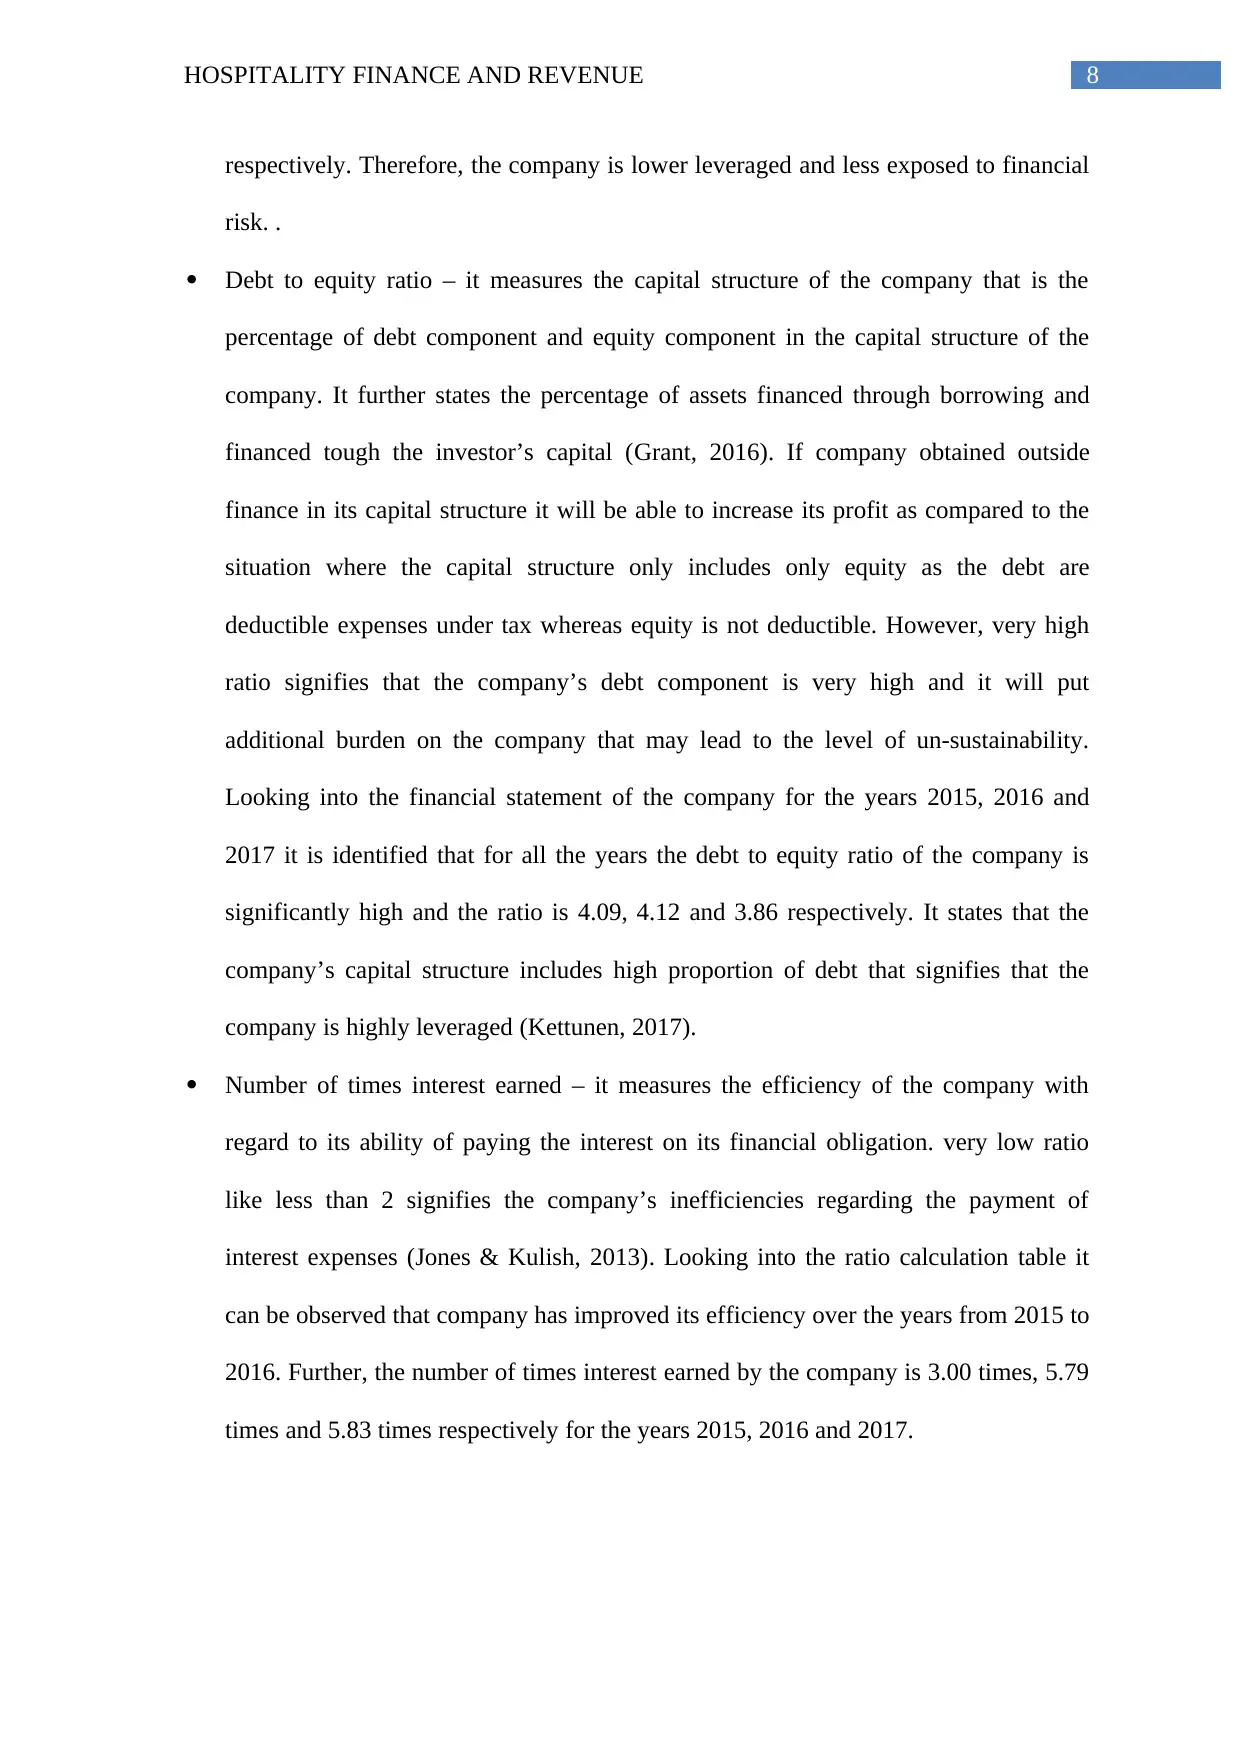
Debt to equity ratio – it measures the capital structure of the company that is the
percentage of debt component and equity component in the capital structure of the
company. It further states the percentage of assets financed through borrowing and
financed tough the investor’s capital (Grant, 2016). If company obtained outside
finance in its capital structure it will be able to increase its profit as compared to the
situation where the capital structure only includes only equity as the debt are
deductible expenses under tax whereas equity is not deductible. However, very high
ratio signifies that the company’s debt component is very high and it will put
additional burden on the company that may lead to the level of un-sustainability.
Looking into the financial statement of the company for the years 2015, 2016 and
2017 it is identified that for all the years the debt to equity ratio of the company is
significantly high and the ratio is 4.09, 4.12 and 3.86 respectively. It states that the
company’s capital structure includes high proportion of debt that signifies that the
company is highly leveraged (Kettunen, 2017).
Number of times interest earned – it measures the efficiency of the company with
regard to its ability of paying the interest on its financial obligation. very low ratio
like less than 2 signifies the company’s inefficiencies regarding the payment of
interest expenses (Jones & Kulish, 2013). Looking into the ratio calculation table it
can be observed that company has improved its efficiency over the years from 2015 to
2016. Further, the number of times interest earned by the company is 3.00 times, 5.79
times and 5.83 times respectively for the years 2015, 2016 and 2017.
respectively. Therefore, the company is lower leveraged and less exposed to financial
risk. .
Debt to equity ratio – it measures the capital structure of the company that is the
percentage of debt component and equity component in the capital structure of the
company. It further states the percentage of assets financed through borrowing and
financed tough the investor’s capital (Grant, 2016). If company obtained outside
finance in its capital structure it will be able to increase its profit as compared to the
situation where the capital structure only includes only equity as the debt are
deductible expenses under tax whereas equity is not deductible. However, very high
ratio signifies that the company’s debt component is very high and it will put
additional burden on the company that may lead to the level of un-sustainability.
Looking into the financial statement of the company for the years 2015, 2016 and
2017 it is identified that for all the years the debt to equity ratio of the company is
significantly high and the ratio is 4.09, 4.12 and 3.86 respectively. It states that the
company’s capital structure includes high proportion of debt that signifies that the
company is highly leveraged (Kettunen, 2017).
Number of times interest earned – it measures the efficiency of the company with
regard to its ability of paying the interest on its financial obligation. very low ratio
like less than 2 signifies the company’s inefficiencies regarding the payment of
interest expenses (Jones & Kulish, 2013). Looking into the ratio calculation table it
can be observed that company has improved its efficiency over the years from 2015 to
2016. Further, the number of times interest earned by the company is 3.00 times, 5.79
times and 5.83 times respectively for the years 2015, 2016 and 2017.
⊘ This is a preview!⊘
Do you want full access?
Subscribe today to unlock all pages.
Trusted by 1+ million students worldwide
9HOSPITALITY FINANCE AND REVENUE
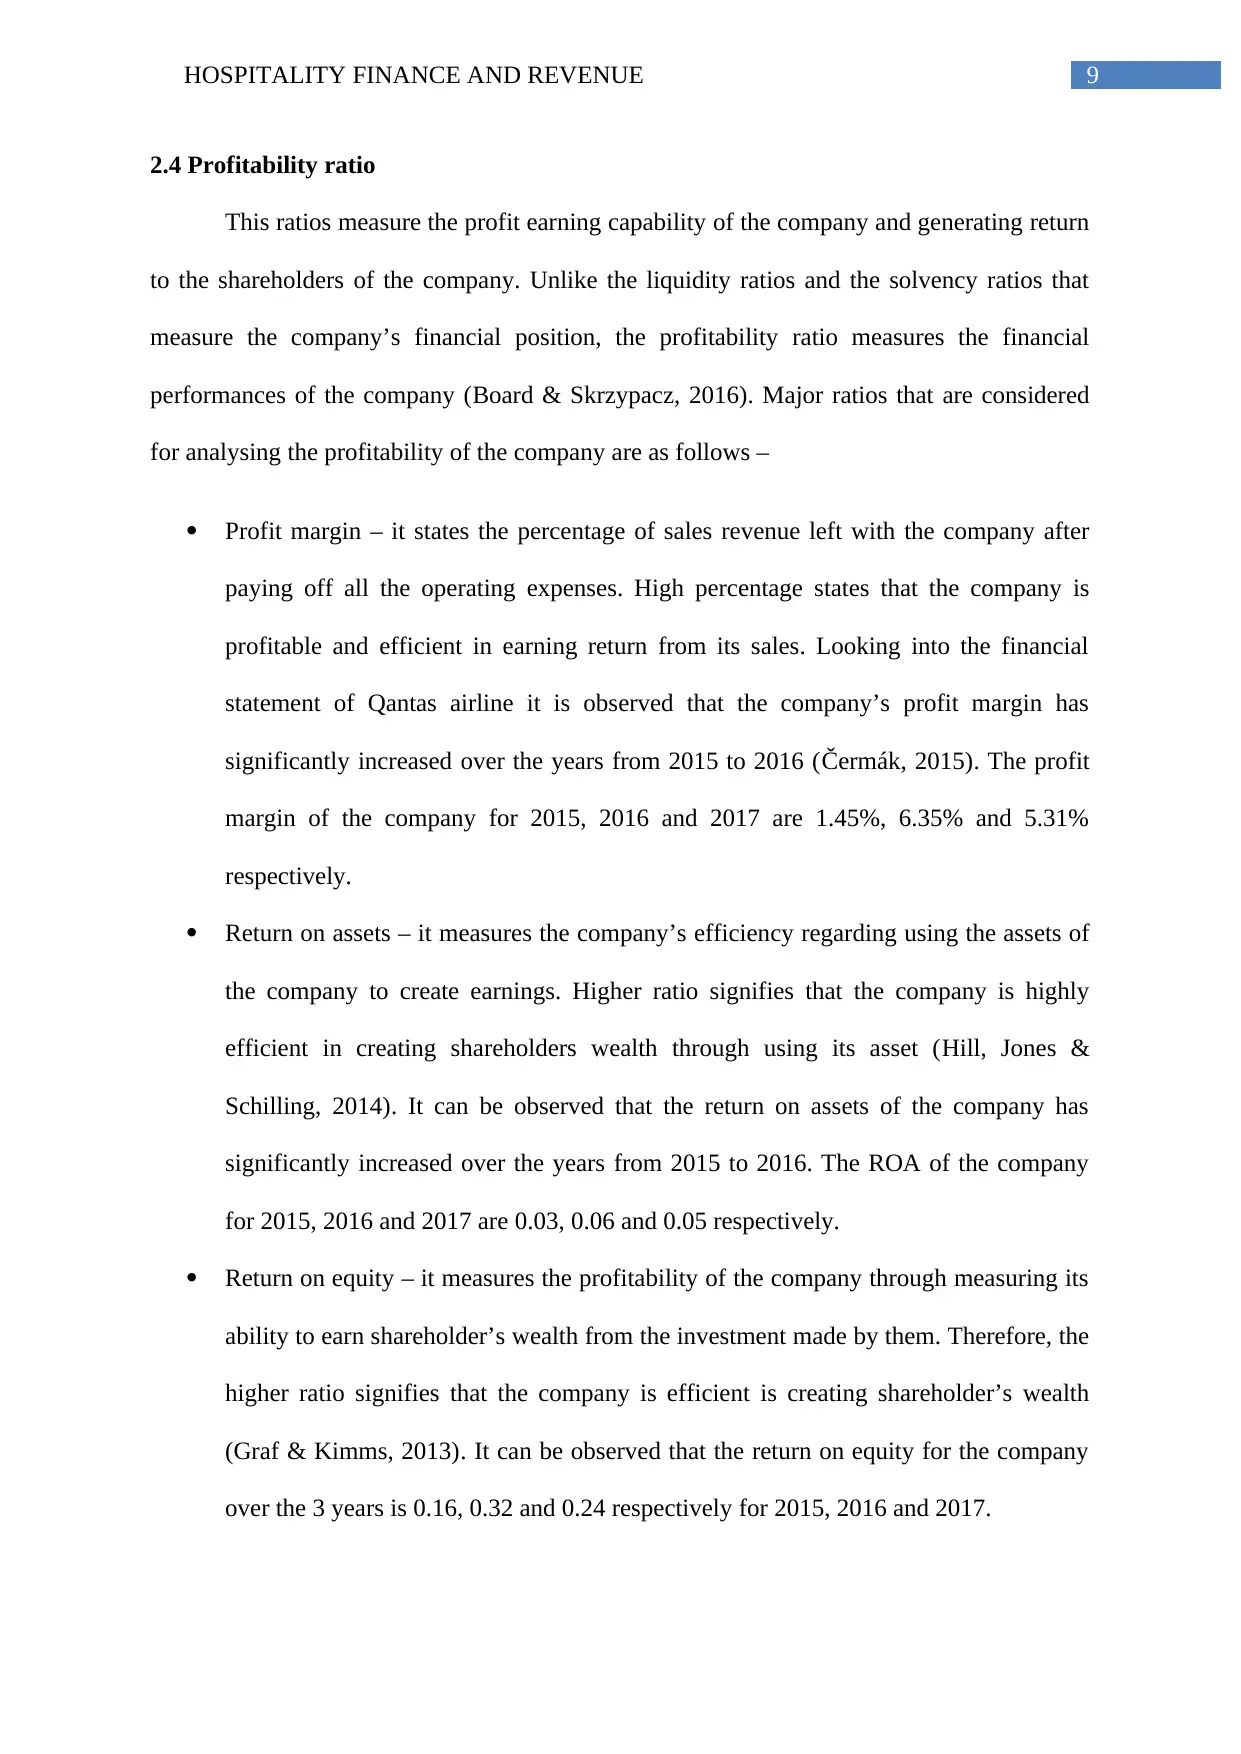
2.4 Profitability ratio
This ratios measure the profit earning capability of the company and generating return
to the shareholders of the company. Unlike the liquidity ratios and the solvency ratios that
measure the company’s financial position, the profitability ratio measures the financial
performances of the company (Board & Skrzypacz, 2016). Major ratios that are considered
for analysing the profitability of the company are as follows –
Profit margin – it states the percentage of sales revenue left with the company after
paying off all the operating expenses. High percentage states that the company is
profitable and efficient in earning return from its sales. Looking into the financial
statement of Qantas airline it is observed that the company’s profit margin has
significantly increased over the years from 2015 to 2016 (Čermák, 2015). The profit
margin of the company for 2015, 2016 and 2017 are 1.45%, 6.35% and 5.31%
respectively.
Return on assets – it measures the company’s efficiency regarding using the assets of
the company to create earnings. Higher ratio signifies that the company is highly
efficient in creating shareholders wealth through using its asset (Hill, Jones &
Schilling, 2014). It can be observed that the return on assets of the company has
significantly increased over the years from 2015 to 2016. The ROA of the company
for 2015, 2016 and 2017 are 0.03, 0.06 and 0.05 respectively.
Return on equity – it measures the profitability of the company through measuring its
ability to earn shareholder’s wealth from the investment made by them. Therefore, the
higher ratio signifies that the company is efficient is creating shareholder’s wealth
(Graf & Kimms, 2013). It can be observed that the return on equity for the company
over the 3 years is 0.16, 0.32 and 0.24 respectively for 2015, 2016 and 2017.
Paraphrase This Document
Need a fresh take? Get an instant paraphrase of this document with our AI Paraphraser
10HOSPITALITY FINANCE AND REVENUE
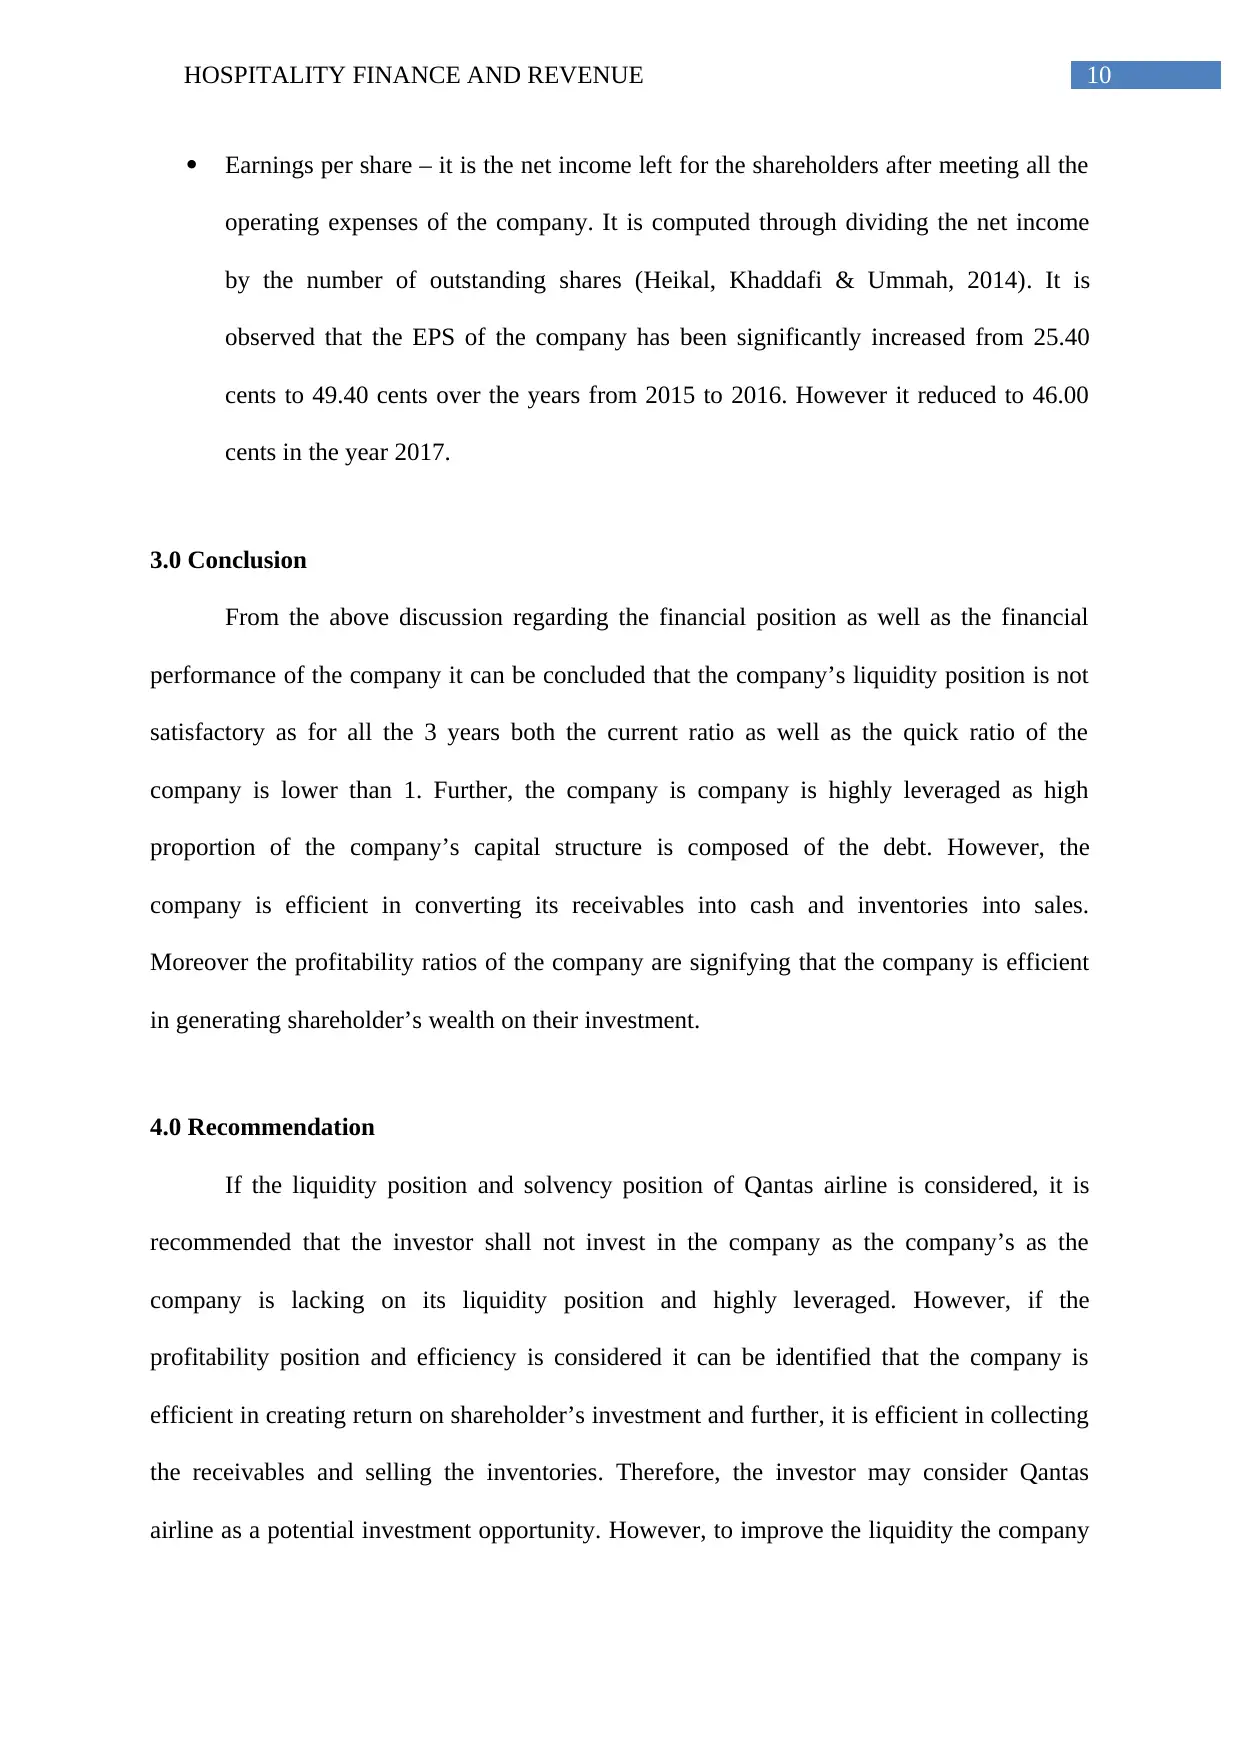
Earnings per share – it is the net income left for the shareholders after meeting all the
operating expenses of the company. It is computed through dividing the net income
by the number of outstanding shares (Heikal, Khaddafi & Ummah, 2014). It is
observed that the EPS of the company has been significantly increased from 25.40
cents to 49.40 cents over the years from 2015 to 2016. However it reduced to 46.00
cents in the year 2017.
3.0 Conclusion
From the above discussion regarding the financial position as well as the financial
performance of the company it can be concluded that the company’s liquidity position is not
satisfactory as for all the 3 years both the current ratio as well as the quick ratio of the
company is lower than 1. Further, the company is company is highly leveraged as high
proportion of the company’s capital structure is composed of the debt. However, the
company is efficient in converting its receivables into cash and inventories into sales.
Moreover the profitability ratios of the company are signifying that the company is efficient
in generating shareholder’s wealth on their investment.
4.0 Recommendation
If the liquidity position and solvency position of Qantas airline is considered, it is
recommended that the investor shall not invest in the company as the company’s as the
company is lacking on its liquidity position and highly leveraged. However, if the
profitability position and efficiency is considered it can be identified that the company is
efficient in creating return on shareholder’s investment and further, it is efficient in collecting
the receivables and selling the inventories. Therefore, the investor may consider Qantas
airline as a potential investment opportunity. However, to improve the liquidity the company
11HOSPITALITY FINANCE AND REVENUE
shall pay off its current obligation and to improve the solvency it shall raise further fund
through equity instead of debt.
shall pay off its current obligation and to improve the solvency it shall raise further fund
through equity instead of debt.
⊘ This is a preview!⊘
Do you want full access?
Subscribe today to unlock all pages.
Trusted by 1+ million students worldwide
1 out of 15
Related Documents


Your All-in-One AI-Powered Toolkit for Academic Success.
+13062052269
info@desklib.com
Available 24*7 on WhatsApp / Email
![[object Object]](/_next/static/media/star-bottom.7253800d.svg)
Unlock your academic potential
Copyright © 2020–2026 A2Z Services. All Rights Reserved. Developed and managed by ZUCOL.