Financial Analysis Report for Qantas Airlines: Performance Review
VerifiedAdded on 2022/10/12
|15
|3966
|431
Report
AI Summary
This report provides a detailed financial analysis of Qantas Airlines, examining its performance through various financial ratios. The analysis includes profitability ratios (return on assets, equity, net profit margin, gross profit margin, EPS, and dividends per share), liquidity ratios (current ratio, quick ratio, and receivables turnover), solvency ratios (debt to equity, debt ratio, and equity ratio), and gearing ratios (debt to equity ratio and interest cover ratio). The report compares the financial performance of Qantas for the years 2017 and 2018, including industry benchmarks. The analysis also covers company overview, and key financial metrics. The report concludes with an assessment of Qantas's financial health and investment potential, highlighting areas of strength and weakness.
Running Head: FINANCIAL ANALYSIS 1
FINANCIAL ANALYSIS
FINANCIAL ANALYSIS
Paraphrase This Document
Need a fresh take? Get an instant paraphrase of this document with our AI Paraphraser
Running Head: FINANCIAL ANALYSIS
Table of Contents
Introduction................................................................................................................................3
Company Analysis.....................................................................................................................3
Ratio Analysis............................................................................................................................3
Profitability Ratios..................................................................................................................3
Liquidity Ratios......................................................................................................................3
Solvency Ratios......................................................................................................................3
Gearing Ratios........................................................................................................................3
Merger and Acquisition..............................................................................................................4
Would you like to invest in the company...................................................................................4
Conclusion..................................................................................................................................4
References..................................................................................................................................5
Running Head: FINANCIAL ANALYSIS
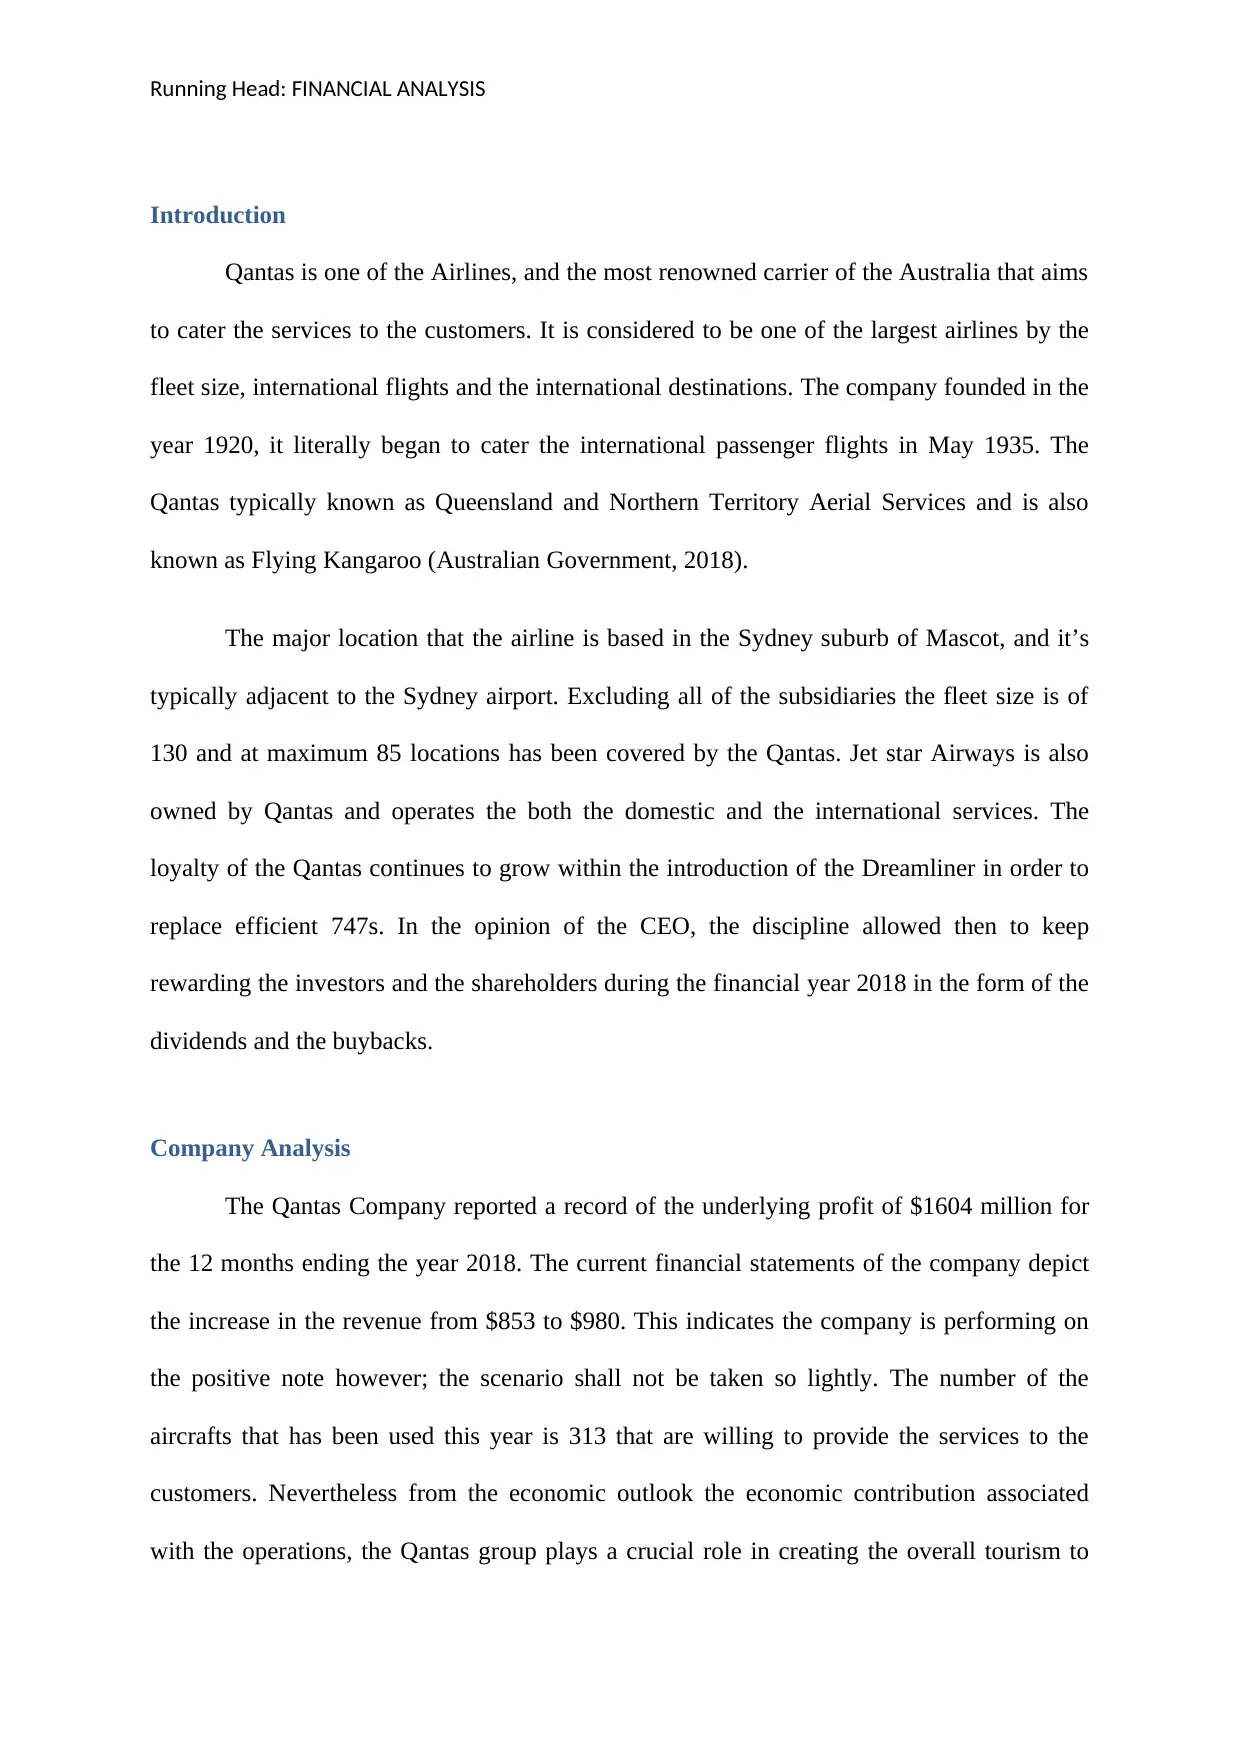
Introduction
Qantas is one of the Airlines, and the most renowned carrier of the Australia that aims
to cater the services to the customers. It is considered to be one of the largest airlines by the
fleet size, international flights and the international destinations. The company founded in the
year 1920, it literally began to cater the international passenger flights in May 1935. The
Qantas typically known as Queensland and Northern Territory Aerial Services and is also
known as Flying Kangaroo (Australian Government, 2018).
The major location that the airline is based in the Sydney suburb of Mascot, and it’s
typically adjacent to the Sydney airport. Excluding all of the subsidiaries the fleet size is of
130 and at maximum 85 locations has been covered by the Qantas. Jet star Airways is also
owned by Qantas and operates the both the domestic and the international services. The
loyalty of the Qantas continues to grow within the introduction of the Dreamliner in order to
replace efficient 747s. In the opinion of the CEO, the discipline allowed then to keep
rewarding the investors and the shareholders during the financial year 2018 in the form of the
dividends and the buybacks.
Company Analysis
The Qantas Company reported a record of the underlying profit of $1604 million for
the 12 months ending the year 2018. The current financial statements of the company depict
the increase in the revenue from $853 to $980. This indicates the company is performing on
the positive note however; the scenario shall not be taken so lightly. The number of the
aircrafts that has been used this year is 313 that are willing to provide the services to the
customers. Nevertheless from the economic outlook the economic contribution associated
with the operations, the Qantas group plays a crucial role in creating the overall tourism to
⊘ This is a preview!⊘
Do you want full access?
Subscribe today to unlock all pages.
Trusted by 1+ million students worldwide
Running Head: FINANCIAL ANALYSIS
and around Australia. The total amount of the tourism that has been recorded by the company
was $10.7 billion whereas the same has been increased by 6% in the current year 2018 (TCS
consultancy, 2017).
Ratio Analysis
Ratio analysis is a tool that is used by the company, to analyse the financial health of
the company. The financial health of the company is determined with the factors such as
parameters such as efficiency, liquidity, profitability and the solvency ratios. These ratios are
the real measures that are used to assess the overall performance of the business are
determined and discussed below along with the comparisons for the two years (Qantas,
2018).
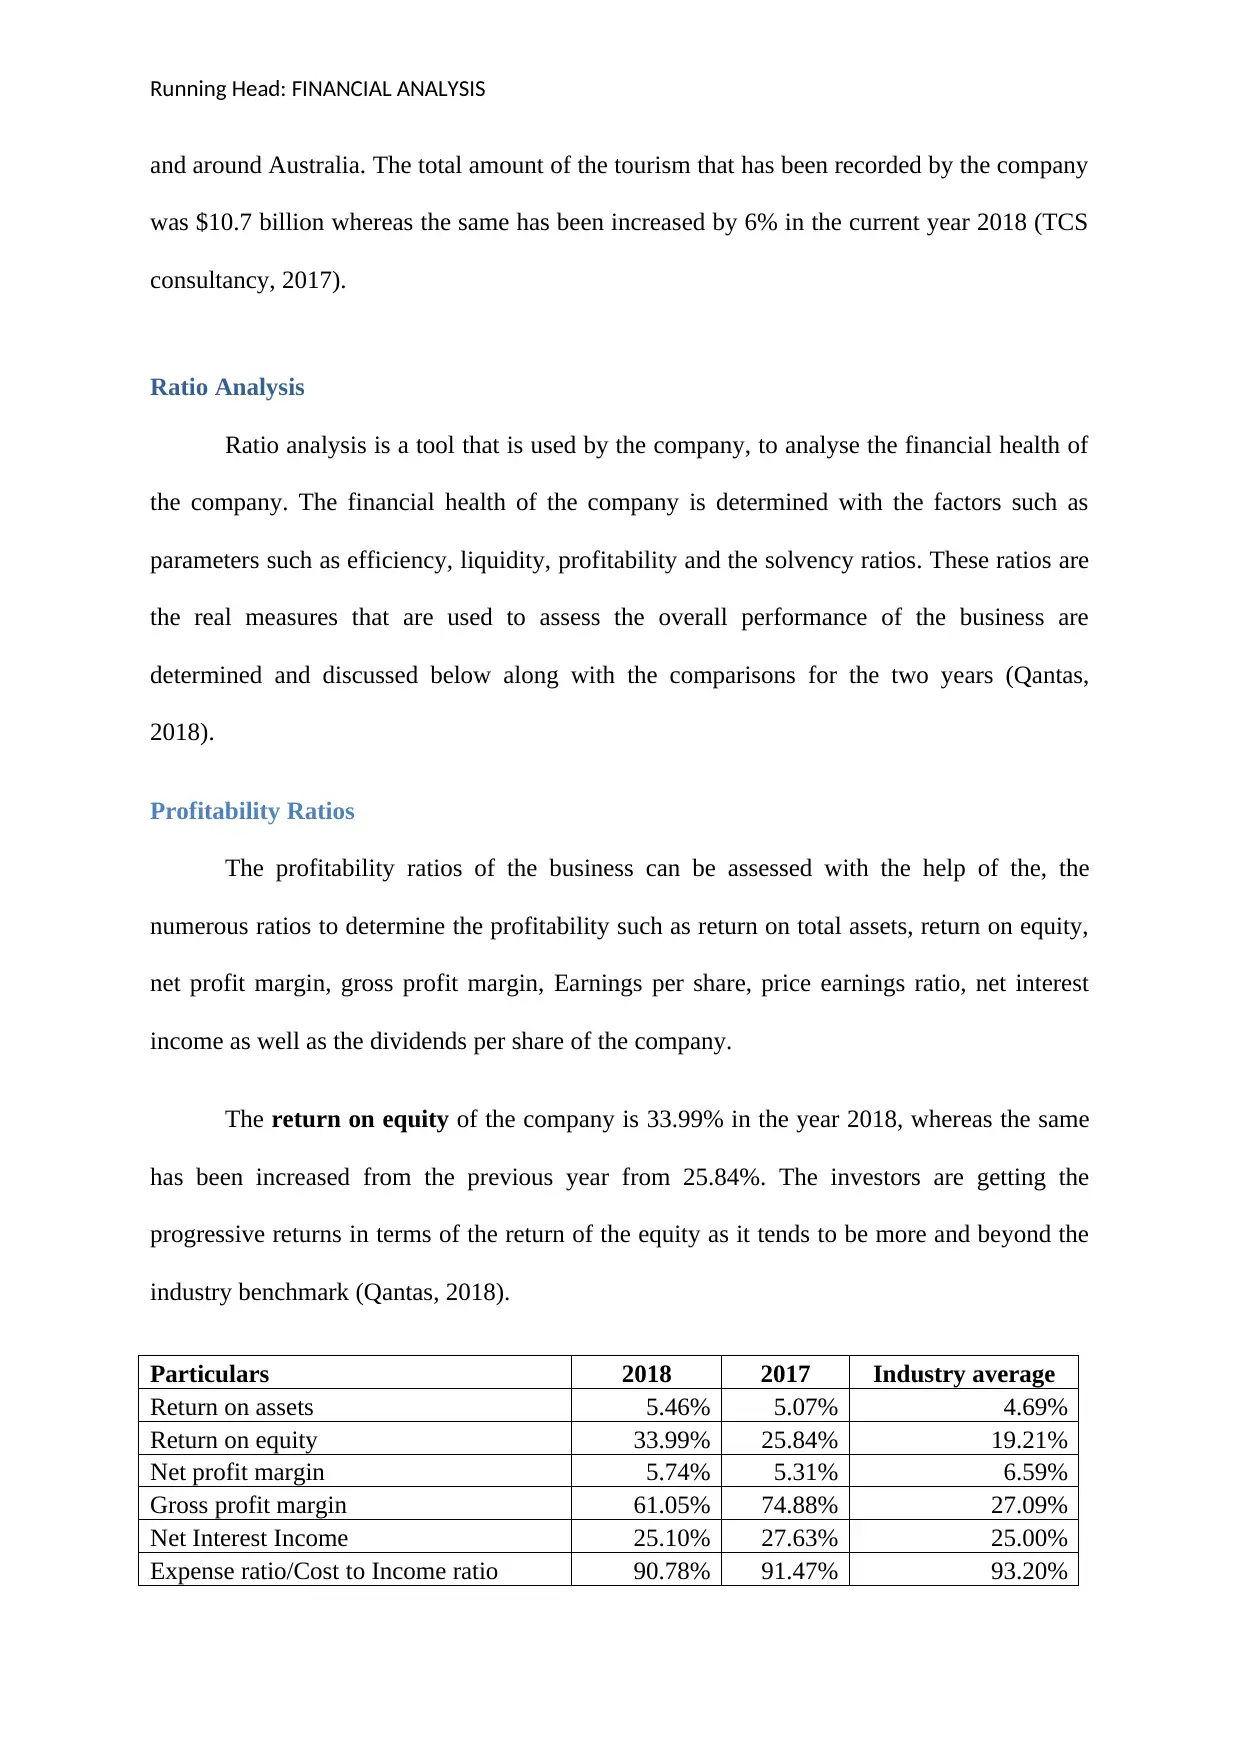
Profitability Ratios
The profitability ratios of the business can be assessed with the help of the, the
numerous ratios to determine the profitability such as return on total assets, return on equity,
net profit margin, gross profit margin, Earnings per share, price earnings ratio, net interest
income as well as the dividends per share of the company.
The return on equity of the company is 33.99% in the year 2018, whereas the same
has been increased from the previous year from 25.84%. The investors are getting the
progressive returns in terms of the return of the equity as it tends to be more and beyond the
industry benchmark (Qantas, 2018).
Particulars 2018 2017 Industry average
Return on assets 5.46% 5.07% 4.69%
Return on equity 33.99% 25.84% 19.21%
Net profit margin 5.74% 5.31% 6.59%
Gross profit margin 61.05% 74.88% 27.09%
Net Interest Income 25.10% 27.63% 25.00%
Expense ratio/Cost to Income ratio 90.78% 91.47% 93.20%
and around Australia. The total amount of the tourism that has been recorded by the company
was $10.7 billion whereas the same has been increased by 6% in the current year 2018 (TCS
consultancy, 2017).
Ratio Analysis
Ratio analysis is a tool that is used by the company, to analyse the financial health of
the company. The financial health of the company is determined with the factors such as
parameters such as efficiency, liquidity, profitability and the solvency ratios. These ratios are
the real measures that are used to assess the overall performance of the business are
determined and discussed below along with the comparisons for the two years (Qantas,
2018).
Profitability Ratios
The profitability ratios of the business can be assessed with the help of the, the
numerous ratios to determine the profitability such as return on total assets, return on equity,
net profit margin, gross profit margin, Earnings per share, price earnings ratio, net interest
income as well as the dividends per share of the company.
The return on equity of the company is 33.99% in the year 2018, whereas the same
has been increased from the previous year from 25.84%. The investors are getting the
progressive returns in terms of the return of the equity as it tends to be more and beyond the
industry benchmark (Qantas, 2018).
Particulars 2018 2017 Industry average
Return on assets 5.46% 5.07% 4.69%
Return on equity 33.99% 25.84% 19.21%
Net profit margin 5.74% 5.31% 6.59%
Gross profit margin 61.05% 74.88% 27.09%
Net Interest Income 25.10% 27.63% 25.00%
Expense ratio/Cost to Income ratio 90.78% 91.47% 93.20%
Paraphrase This Document
Need a fresh take? Get an instant paraphrase of this document with our AI Paraphraser
Running Head: FINANCIAL ANALYSIS
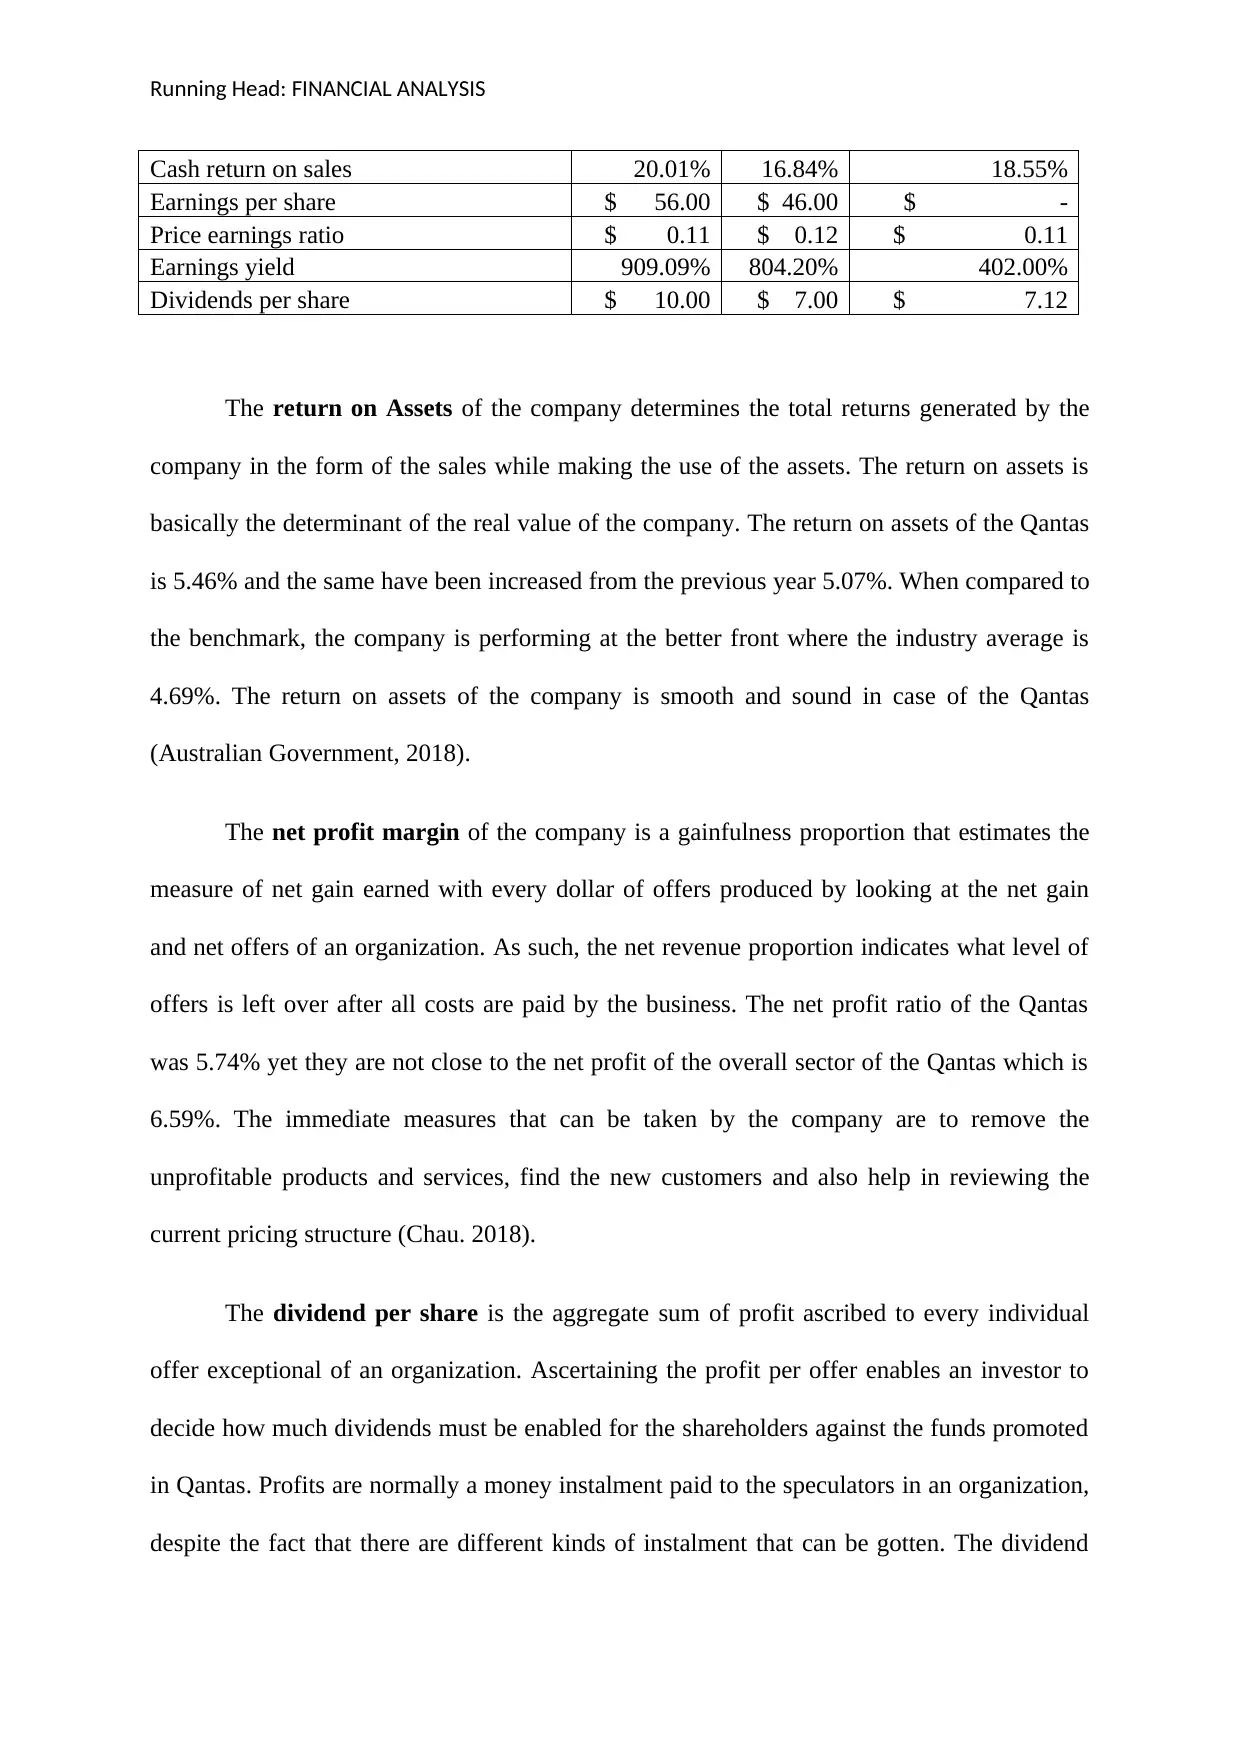
Cash return on sales 20.01% 16.84% 18.55%
Earnings per share $ 56.00 $ 46.00 $ -
Price earnings ratio $ 0.11 $ 0.12 $ 0.11
Earnings yield 909.09% 804.20% 402.00%
Dividends per share $ 10.00 $ 7.00 $ 7.12
The return on Assets of the company determines the total returns generated by the
company in the form of the sales while making the use of the assets. The return on assets is
basically the determinant of the real value of the company. The return on assets of the Qantas
is 5.46% and the same have been increased from the previous year 5.07%. When compared to
the benchmark, the company is performing at the better front where the industry average is
4.69%. The return on assets of the company is smooth and sound in case of the Qantas
(Australian Government, 2018).
The net profit margin of the company is a gainfulness proportion that estimates the
measure of net gain earned with every dollar of offers produced by looking at the net gain
and net offers of an organization. As such, the net revenue proportion indicates what level of
offers is left over after all costs are paid by the business. The net profit ratio of the Qantas
was 5.74% yet they are not close to the net profit of the overall sector of the Qantas which is
6.59%. The immediate measures that can be taken by the company are to remove the
unprofitable products and services, find the new customers and also help in reviewing the
current pricing structure (Chau. 2018).
The dividend per share is the aggregate sum of profit ascribed to every individual
offer exceptional of an organization. Ascertaining the profit per offer enables an investor to
decide how much dividends must be enabled for the shareholders against the funds promoted
in Qantas. Profits are normally a money instalment paid to the speculators in an organization,
despite the fact that there are different kinds of instalment that can be gotten. The dividend
Running Head: FINANCIAL ANALYSIS
per share of the Qantas is 10 cents per share and the same has been increased from 7 cents
and when the industry sector is observed the dividend per share tends to be 7.12. So, from the
overall analysis the company is progressing in the better manner keeping the needs and the
preferences of the shareholders and the investors (Eisenbach, et al 2017).
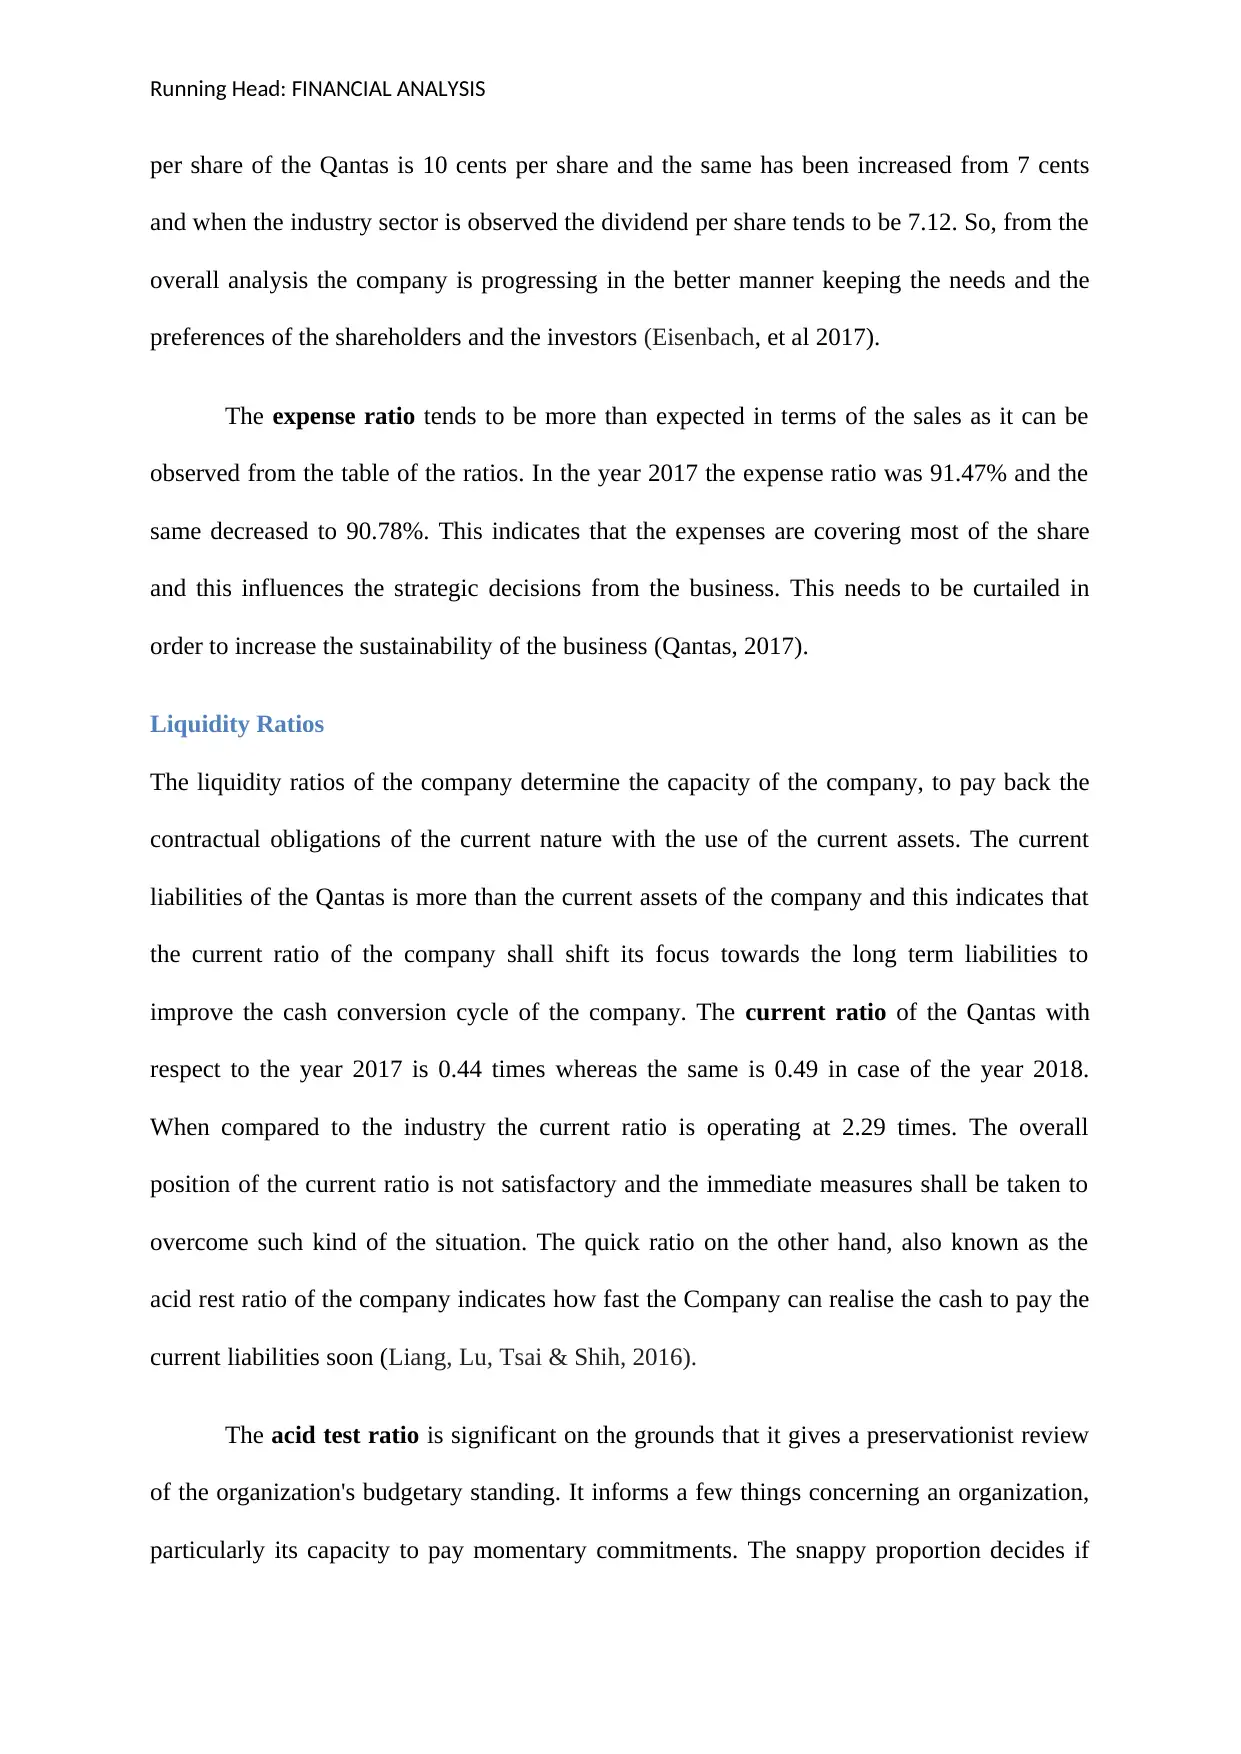
The expense ratio tends to be more than expected in terms of the sales as it can be
observed from the table of the ratios. In the year 2017 the expense ratio was 91.47% and the
same decreased to 90.78%. This indicates that the expenses are covering most of the share
and this influences the strategic decisions from the business. This needs to be curtailed in
order to increase the sustainability of the business (Qantas, 2017).
Liquidity Ratios
The liquidity ratios of the company determine the capacity of the company, to pay back the
contractual obligations of the current nature with the use of the current assets. The current
liabilities of the Qantas is more than the current assets of the company and this indicates that
the current ratio of the company shall shift its focus towards the long term liabilities to
improve the cash conversion cycle of the company. The current ratio of the Qantas with
respect to the year 2017 is 0.44 times whereas the same is 0.49 in case of the year 2018.
When compared to the industry the current ratio is operating at 2.29 times. The overall
position of the current ratio is not satisfactory and the immediate measures shall be taken to
overcome such kind of the situation. The quick ratio on the other hand, also known as the
acid rest ratio of the company indicates how fast the Company can realise the cash to pay the
current liabilities soon (Liang, Lu, Tsai & Shih, 2016).
The acid test ratio is significant on the grounds that it gives a preservationist review
of the organization's budgetary standing. It informs a few things concerning an organization,
particularly its capacity to pay momentary commitments. The snappy proportion decides if
per share of the Qantas is 10 cents per share and the same has been increased from 7 cents
and when the industry sector is observed the dividend per share tends to be 7.12. So, from the
overall analysis the company is progressing in the better manner keeping the needs and the
preferences of the shareholders and the investors (Eisenbach, et al 2017).
The expense ratio tends to be more than expected in terms of the sales as it can be
observed from the table of the ratios. In the year 2017 the expense ratio was 91.47% and the
same decreased to 90.78%. This indicates that the expenses are covering most of the share
and this influences the strategic decisions from the business. This needs to be curtailed in
order to increase the sustainability of the business (Qantas, 2017).
Liquidity Ratios
The liquidity ratios of the company determine the capacity of the company, to pay back the
contractual obligations of the current nature with the use of the current assets. The current
liabilities of the Qantas is more than the current assets of the company and this indicates that
the current ratio of the company shall shift its focus towards the long term liabilities to
improve the cash conversion cycle of the company. The current ratio of the Qantas with
respect to the year 2017 is 0.44 times whereas the same is 0.49 in case of the year 2018.
When compared to the industry the current ratio is operating at 2.29 times. The overall
position of the current ratio is not satisfactory and the immediate measures shall be taken to
overcome such kind of the situation. The quick ratio on the other hand, also known as the
acid rest ratio of the company indicates how fast the Company can realise the cash to pay the
current liabilities soon (Liang, Lu, Tsai & Shih, 2016).
The acid test ratio is significant on the grounds that it gives a preservationist review
of the organization's budgetary standing. It informs a few things concerning an organization,
particularly its capacity to pay momentary commitments. The snappy proportion decides if
⊘ This is a preview!⊘
Do you want full access?
Subscribe today to unlock all pages.
Trusted by 1+ million students worldwide
Running Head: FINANCIAL ANALYSIS
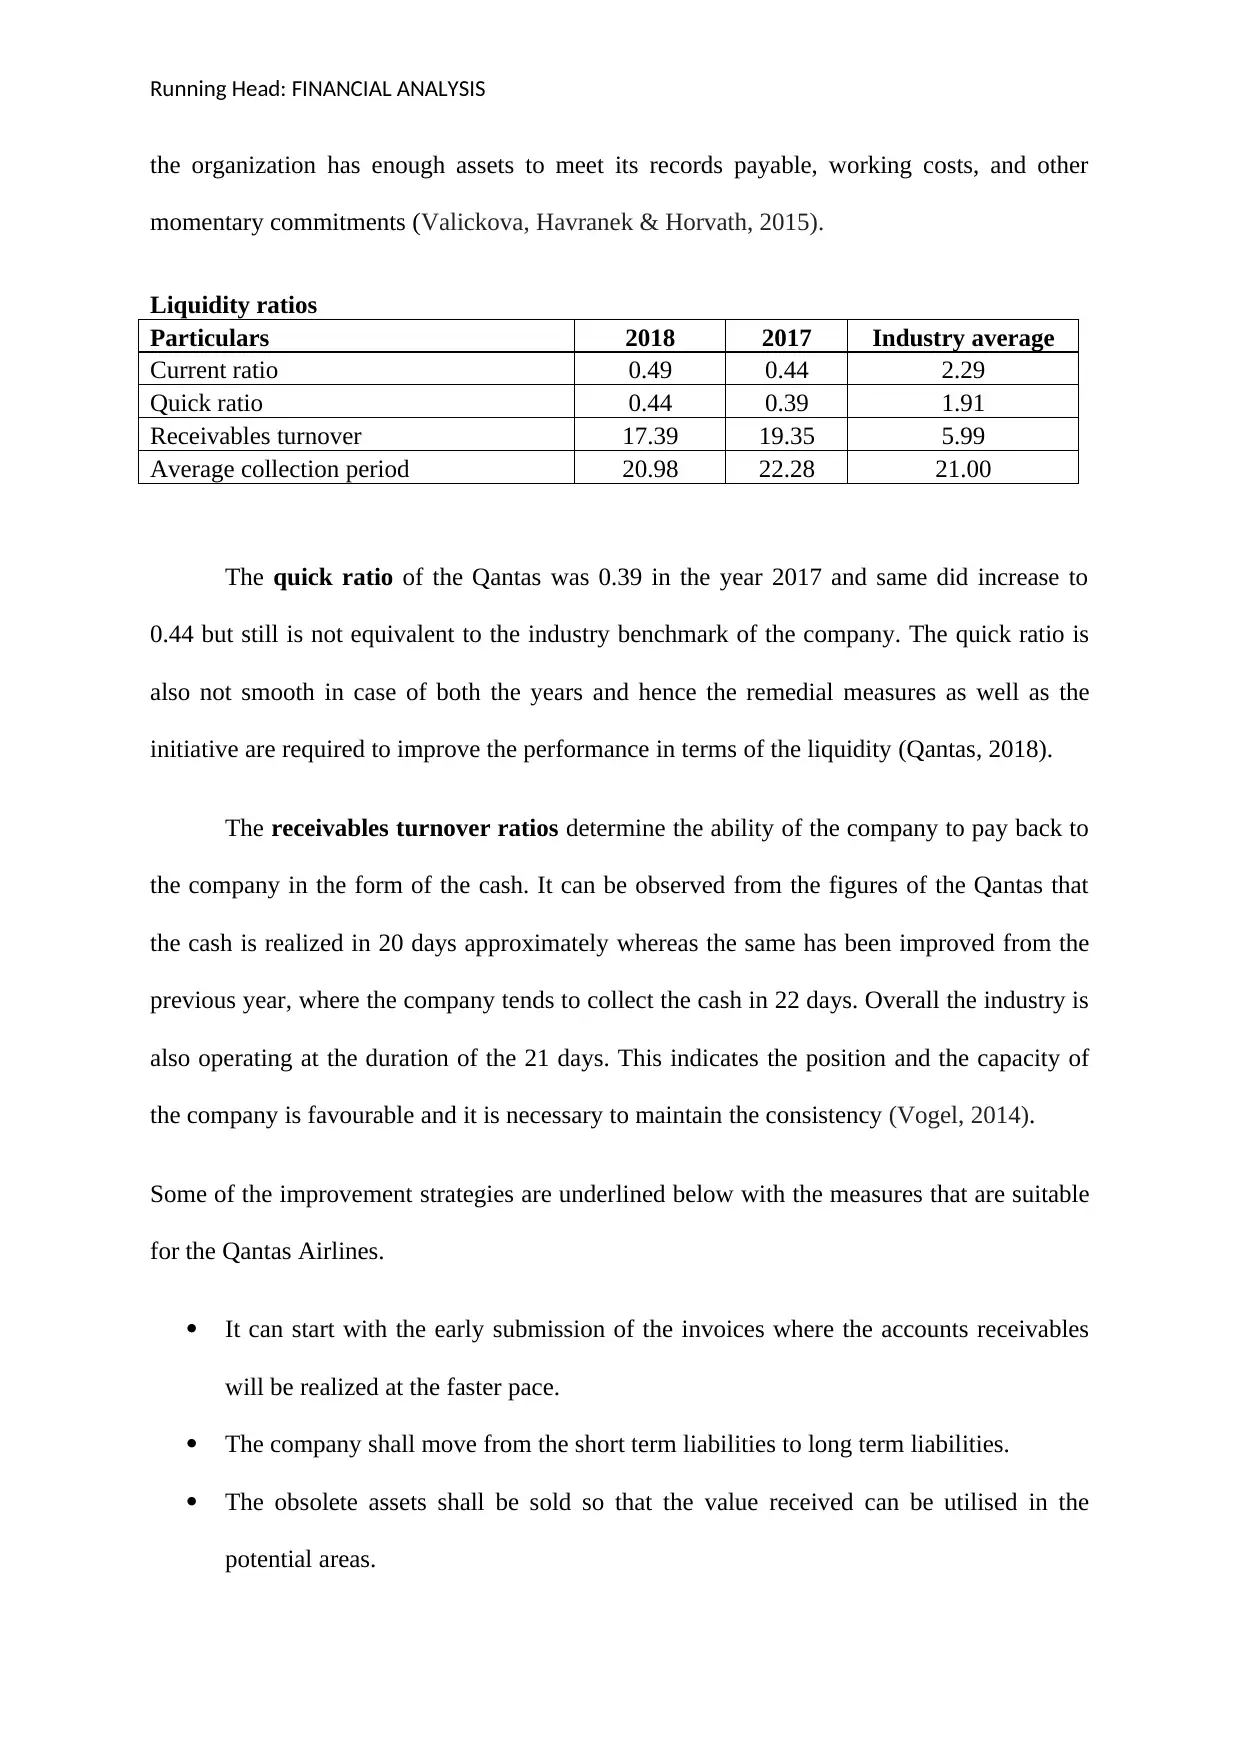
the organization has enough assets to meet its records payable, working costs, and other
momentary commitments (Valickova, Havranek & Horvath, 2015).
Liquidity ratios
Particulars 2018 2017 Industry average
Current ratio 0.49 0.44 2.29
Quick ratio 0.44 0.39 1.91
Receivables turnover 17.39 19.35 5.99
Average collection period 20.98 22.28 21.00
The quick ratio of the Qantas was 0.39 in the year 2017 and same did increase to
0.44 but still is not equivalent to the industry benchmark of the company. The quick ratio is
also not smooth in case of both the years and hence the remedial measures as well as the
initiative are required to improve the performance in terms of the liquidity (Qantas, 2018).
The receivables turnover ratios determine the ability of the company to pay back to
the company in the form of the cash. It can be observed from the figures of the Qantas that
the cash is realized in 20 days approximately whereas the same has been improved from the
previous year, where the company tends to collect the cash in 22 days. Overall the industry is
also operating at the duration of the 21 days. This indicates the position and the capacity of
the company is favourable and it is necessary to maintain the consistency (Vogel, 2014).
Some of the improvement strategies are underlined below with the measures that are suitable
for the Qantas Airlines.
It can start with the early submission of the invoices where the accounts receivables
will be realized at the faster pace.
The company shall move from the short term liabilities to long term liabilities.
The obsolete assets shall be sold so that the value received can be utilised in the
potential areas.
Paraphrase This Document
Need a fresh take? Get an instant paraphrase of this document with our AI Paraphraser
Running Head: FINANCIAL ANALYSIS
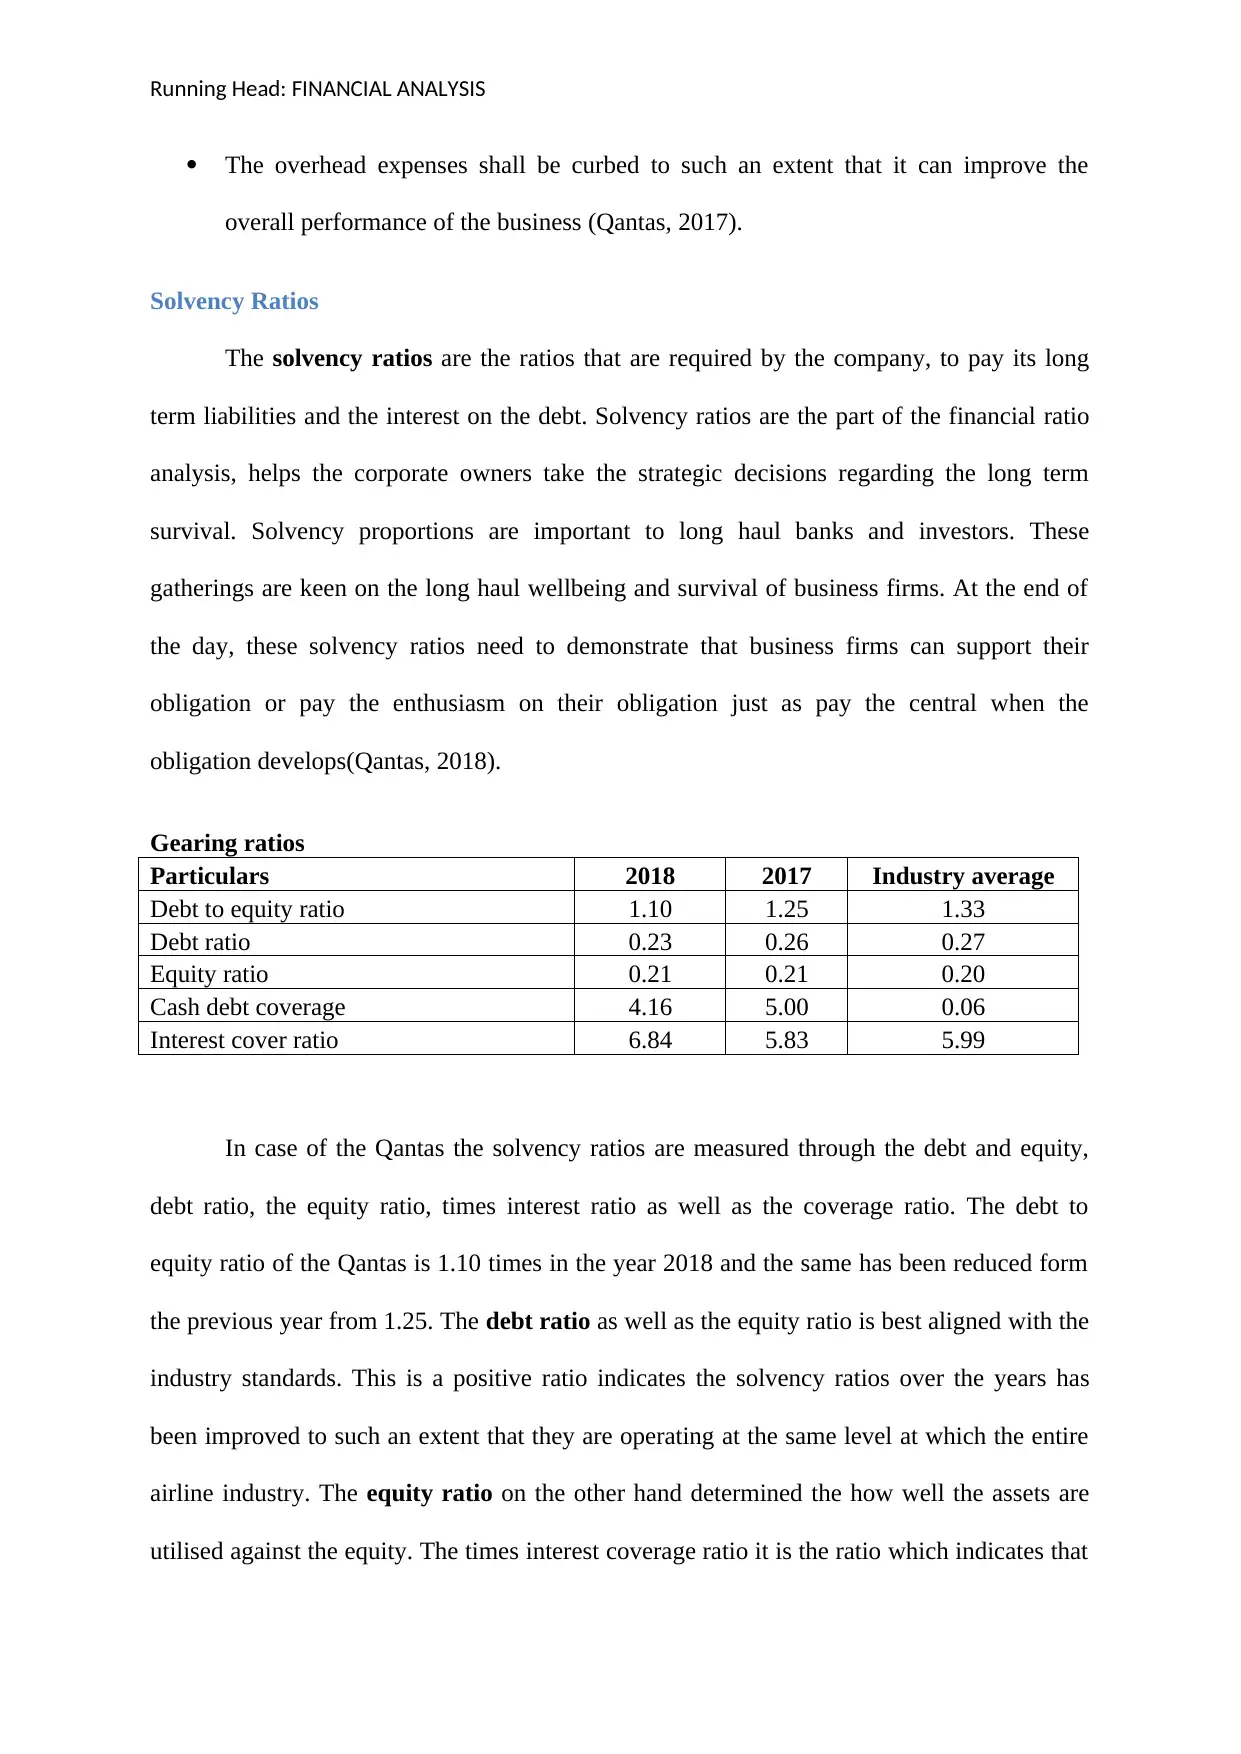
The overhead expenses shall be curbed to such an extent that it can improve the
overall performance of the business (Qantas, 2017).
Solvency Ratios
The solvency ratios are the ratios that are required by the company, to pay its long
term liabilities and the interest on the debt. Solvency ratios are the part of the financial ratio
analysis, helps the corporate owners take the strategic decisions regarding the long term
survival. Solvency proportions are important to long haul banks and investors. These
gatherings are keen on the long haul wellbeing and survival of business firms. At the end of
the day, these solvency ratios need to demonstrate that business firms can support their
obligation or pay the enthusiasm on their obligation just as pay the central when the
obligation develops(Qantas, 2018).
Gearing ratios
Particulars 2018 2017 Industry average
Debt to equity ratio 1.10 1.25 1.33
Debt ratio 0.23 0.26 0.27
Equity ratio 0.21 0.21 0.20
Cash debt coverage 4.16 5.00 0.06
Interest cover ratio 6.84 5.83 5.99
In case of the Qantas the solvency ratios are measured through the debt and equity,
debt ratio, the equity ratio, times interest ratio as well as the coverage ratio. The debt to
equity ratio of the Qantas is 1.10 times in the year 2018 and the same has been reduced form
the previous year from 1.25. The debt ratio as well as the equity ratio is best aligned with the
industry standards. This is a positive ratio indicates the solvency ratios over the years has
been improved to such an extent that they are operating at the same level at which the entire
airline industry. The equity ratio on the other hand determined the how well the assets are
utilised against the equity. The times interest coverage ratio it is the ratio which indicates that
Running Head: FINANCIAL ANALYSIS
the ability of the company to pay back the finance costs as fast as possible (Williams &
Dobelman, 2017).
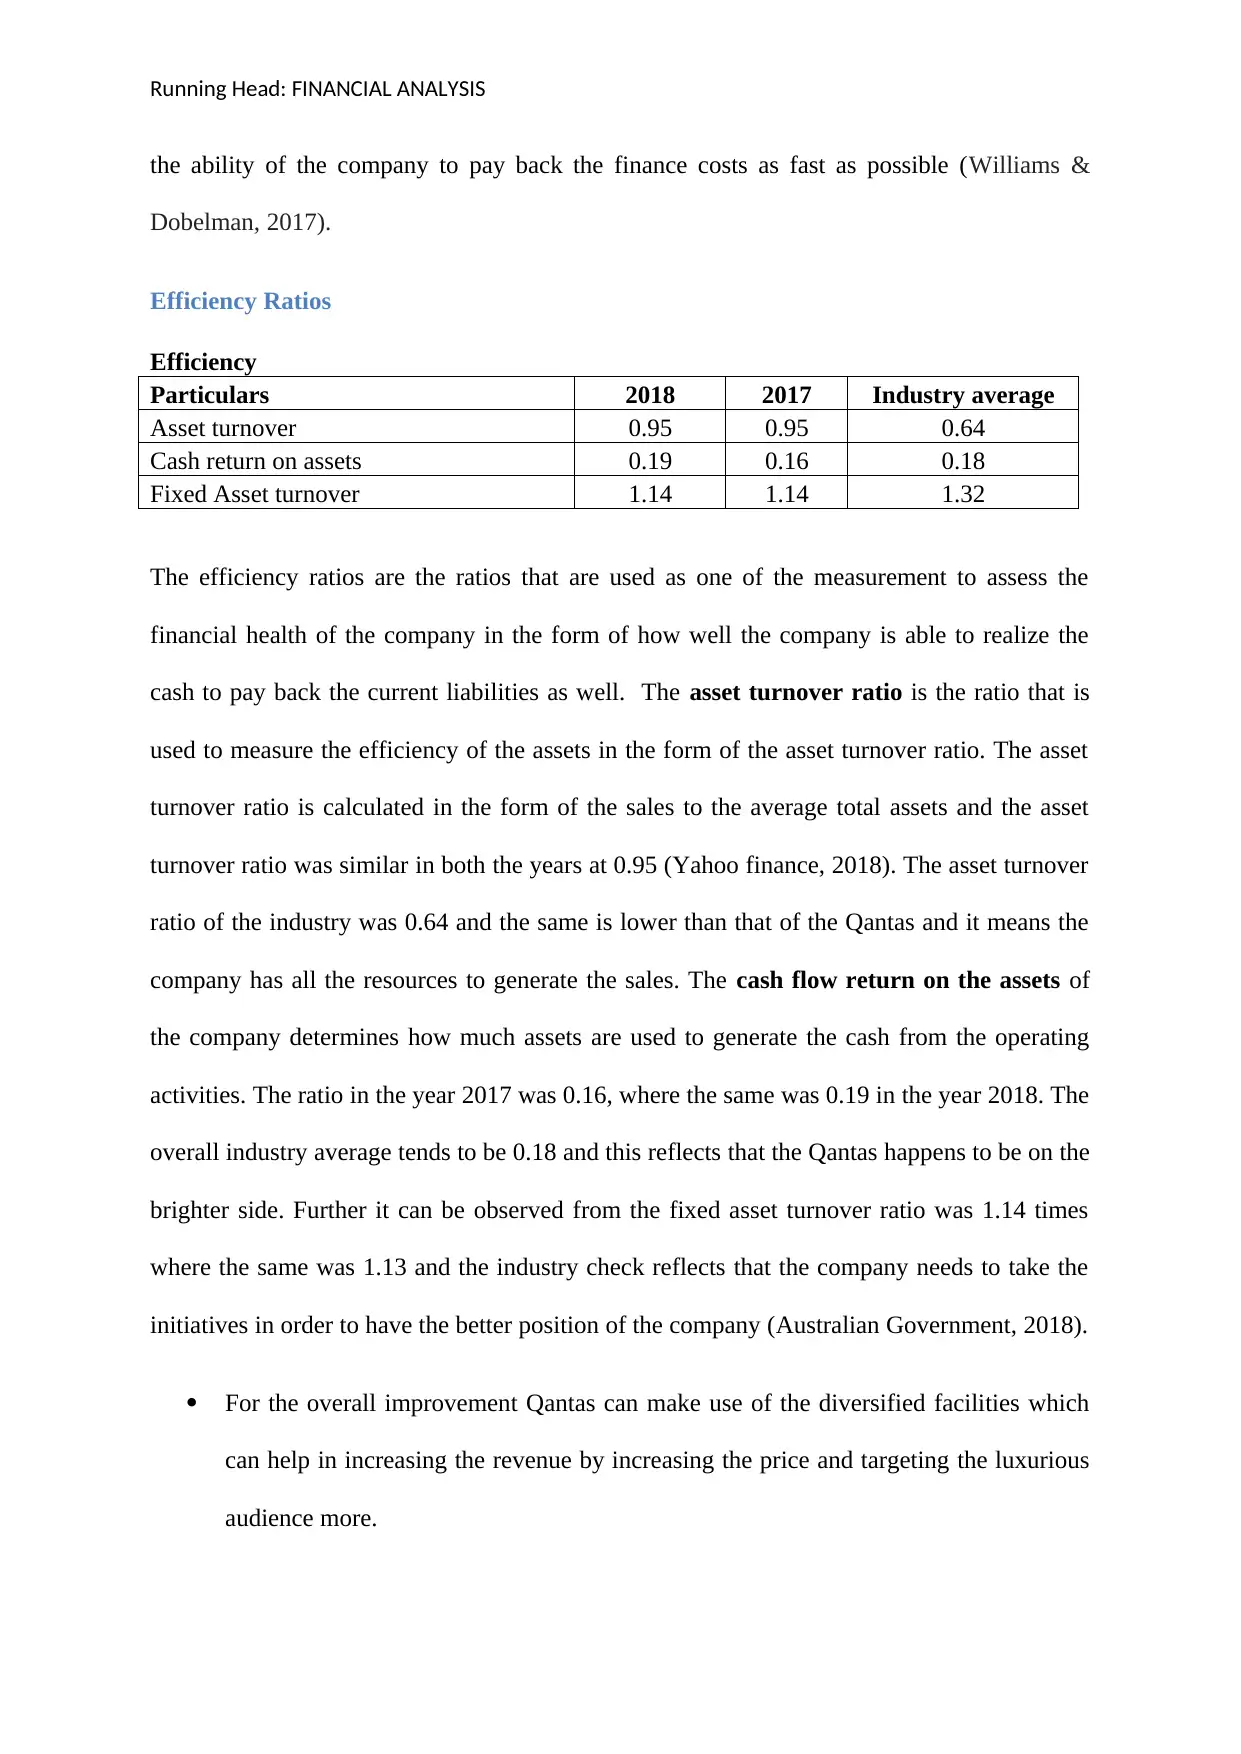
Efficiency Ratios
Efficiency
Particulars 2018 2017 Industry average
Asset turnover 0.95 0.95 0.64
Cash return on assets 0.19 0.16 0.18
Fixed Asset turnover 1.14 1.14 1.32
The efficiency ratios are the ratios that are used as one of the measurement to assess the
financial health of the company in the form of how well the company is able to realize the
cash to pay back the current liabilities as well. The asset turnover ratio is the ratio that is
used to measure the efficiency of the assets in the form of the asset turnover ratio. The asset
turnover ratio is calculated in the form of the sales to the average total assets and the asset
turnover ratio was similar in both the years at 0.95 (Yahoo finance, 2018). The asset turnover
ratio of the industry was 0.64 and the same is lower than that of the Qantas and it means the
company has all the resources to generate the sales. The cash flow return on the assets of
the company determines how much assets are used to generate the cash from the operating
activities. The ratio in the year 2017 was 0.16, where the same was 0.19 in the year 2018. The
overall industry average tends to be 0.18 and this reflects that the Qantas happens to be on the
brighter side. Further it can be observed from the fixed asset turnover ratio was 1.14 times
where the same was 1.13 and the industry check reflects that the company needs to take the
initiatives in order to have the better position of the company (Australian Government, 2018).
For the overall improvement Qantas can make use of the diversified facilities which
can help in increasing the revenue by increasing the price and targeting the luxurious
audience more.
the ability of the company to pay back the finance costs as fast as possible (Williams &
Dobelman, 2017).
Efficiency Ratios
Efficiency
Particulars 2018 2017 Industry average
Asset turnover 0.95 0.95 0.64
Cash return on assets 0.19 0.16 0.18
Fixed Asset turnover 1.14 1.14 1.32
The efficiency ratios are the ratios that are used as one of the measurement to assess the
financial health of the company in the form of how well the company is able to realize the
cash to pay back the current liabilities as well. The asset turnover ratio is the ratio that is
used to measure the efficiency of the assets in the form of the asset turnover ratio. The asset
turnover ratio is calculated in the form of the sales to the average total assets and the asset
turnover ratio was similar in both the years at 0.95 (Yahoo finance, 2018). The asset turnover
ratio of the industry was 0.64 and the same is lower than that of the Qantas and it means the
company has all the resources to generate the sales. The cash flow return on the assets of
the company determines how much assets are used to generate the cash from the operating
activities. The ratio in the year 2017 was 0.16, where the same was 0.19 in the year 2018. The
overall industry average tends to be 0.18 and this reflects that the Qantas happens to be on the
brighter side. Further it can be observed from the fixed asset turnover ratio was 1.14 times
where the same was 1.13 and the industry check reflects that the company needs to take the
initiatives in order to have the better position of the company (Australian Government, 2018).
For the overall improvement Qantas can make use of the diversified facilities which
can help in increasing the revenue by increasing the price and targeting the luxurious
audience more.
⊘ This is a preview!⊘
Do you want full access?
Subscribe today to unlock all pages.
Trusted by 1+ million students worldwide
Running Head: FINANCIAL ANALYSIS
The overhead expenses shall be deducted by manufacturing certain parts and products
to avoid the third party involvement (Xiong, Wang & Stanley, 2018).
This proportion gives knowledge to the banks and speculators into the interior
administration of the organization. A low resource turnover proportion will
unquestionably mean abundance creation, awful stock administration or poor
gathering of the resources. Hence, it is recommended to the company to make use of
the resources as and when required (O’Neill, Sohal & Teng, 2016).
Merger and Acquisition
Jet Set is ready to merge with Qantas Airways travels after the approval of the deal.
This merger is one of the greatest decisions to pave the way for the combines’ entity to create
the integrated level of the services. The creation of the integrated business will help in
covering all the segments of the travel market. These four major markets are classified as
retail, wholesale, corporate and online. Due to the merger of the Jet set the shareholders will
get 11 cents per share in the month of August. The merger will enhance the customer base for
both the organizations and this also increases the customer base (Mclennan, 2018).
Sustainability
The key ideas that have been tended to by International Accounting for Sustainability
is inferred on account of the Qantas in this specific segment and it has been discovered that
the organization is acting capably towards the purchasers and the projects attempted by the
organization to ensure the earth is exceptional. There are several measures with regards to the
sustainability of the company to derive itself ethically as well as responsibly. The measures
that have been received by the organization are National Greenhouse and Energy Reporting
(NGER) for yearly household discharges — Sustainability Reporting and Carbon Disclosure
Paraphrase This Document
Need a fresh take? Get an instant paraphrase of this document with our AI Paraphraser
Running Head: FINANCIAL ANALYSIS
Project Reporting for yearly complete outflows impression, including worldwide — Fly
Carbon Neutral program detailing for full life cycle emanations of our flight segments as per
the National Carbon Offset Standard. They have affected in the positive way as this drove the
Qantas manufacture legitimate deals every year and hold an enormous number of the client
base (Qantas Sustainability, 2018).
The subsequent idea is the idea of the less emission and utilization of the eco-
accommodating items. In this situation the Qantas was accepted to be the most experienced
carrier and not exclusively is this organization additionally engaged with the decrease of the
flying machine weight to maintain a strategic distance from the colossal fuel and outflow in
the earth.
Capable Ground Power Units in lieu of stream fuel driven Auxiliary Power Units
utilizing GPS-based course development (Smart Tracking) to improve operational capability.
Further the organization has additionally put resources into in an eco-accommodating task
force for instance; the Airbus A380 and Boeing 787 for encouraging a Sustainable Aviation
and making an alternate level for the Fuel (SAF) industry in Australia the sum total of what
could have been accomplished subsequent to making due under the supervision of the
Accountability and Sustainability specialists of Australia
Political Factors affecting the Business
The political competitive environment of the business is one of the greatest steps in
analysing the financial performance of the business. Since the political factors can create a
huge impact on the profitability of the business, the chances of the survival of the company is
quite crucial. There are different types of the political situation that may affect the
performance of the company such as existing political regimes, civil unrest and the major
Running Head: FINANCIAL ANALYSIS
changes incorporated by the government. The company is exposed to the systematic political
risk that is underlined below (CAPA, 2018).
The laws that the nation authorizes, particularly with respect to business, for example,
contract law, as they manage what Qantas Airways Limited is and isn't permitted to do. A
few nations, for instance, restrict liquor or have certain conditions that must be satisfied,
while some administration frameworks have wasteful measures of formality that dishearten
business.
Regardless of whether an organization's licensed innovation (IP) is ensured, for
instance, a nation that has no arrangements for IP assurance would imply that business people
may discover it too hazardous to even think about investing in Qantas Airways Limited
(Yahoo finance, 2018).
The exchange obstructions that the host nation has would secure Qantas Airways
Limited; in any case, exchange boundaries that nations with potential exchange accomplices
would damage organizations by counteracting potential fares. An abnormal state of tax
assessment would demotivate organizations like Qantas Airways Limited from boosting their
benefits (CAPA, 2018).
Would you like to invest in the company
From the above evaluation and the overall analysis it can be stated that the Qantas has
been operating at the lower level in terms of the liquidity. Qantas is performing outstanding
in some of the areas like efficiency and in the parameter of the gearing ratio however, in
some of the areas it needs to work hard to bring back the position to an acceptable level. The
initiatives as well as the measures have been taken by the company and some of them are
suggested which needs to be implemented to improve the overall position of the business. So,
⊘ This is a preview!⊘
Do you want full access?
Subscribe today to unlock all pages.
Trusted by 1+ million students worldwide
1 out of 15
Related Documents


Your All-in-One AI-Powered Toolkit for Academic Success.
+13062052269
info@desklib.com
Available 24*7 on WhatsApp / Email
![[object Object]](/_next/static/media/star-bottom.7253800d.svg)
Unlock your academic potential
Copyright © 2020–2026 A2Z Services. All Rights Reserved. Developed and managed by ZUCOL.