Business Valuation and Analysis of Qantas Airline: 2017 Report
VerifiedAdded on 2020/05/16
|13
|2643
|82
Report
AI Summary
This report provides a comprehensive business valuation and analysis of Qantas Airline, focusing on its financial performance and strategic decisions. It begins with a Porter's Five Forces analysis to assess the competitive landscape, followed by a SWOT analysis to evaluate the company's strengths, weaknesses, opportunities, and threats. The report then examines Qantas's core competitive strategy, highlighting its evolution and effectiveness. It also delves into critical accounting policies, particularly revenue recognition and property, plant, and equipment valuation, emphasizing their significance in the airline industry. A quantitative analysis compares Qantas's financial performance in 2013 and 2017, evaluating key ratios such as return on assets, return on equity, and debt-equity ratio. The analysis concludes with a comparative assessment of the airline's performance over the specified period, offering insights into its growth and investment potential.
2017
Business
Valutaion and
Analysis
Business
Valutaion and
Analysis
Paraphrase This Document
Need a fresh take? Get an instant paraphrase of this document with our AI Paraphraser
1
By student name
Professor
University
Date: Januray 23 , 2018.
1 | P a g e
By student name
Professor
University
Date: Januray 23 , 2018.
1 | P a g e
2
Contents
Question a…………………………………………………………………....3
Question b…………………………………………………………………....4
Question c…………………………………………………………………....4
Question d…………………………………………………………………....5
Question e…………………………………………………………………....9
Question f…………………………………………………………………....9
Question g…………………………………………………………………....9
Refrences.....……………………………………………………………....11
2 | P a g e
⊘ This is a preview!⊘
Do you want full access?
Subscribe today to unlock all pages.
Trusted by 1+ million students worldwide
3
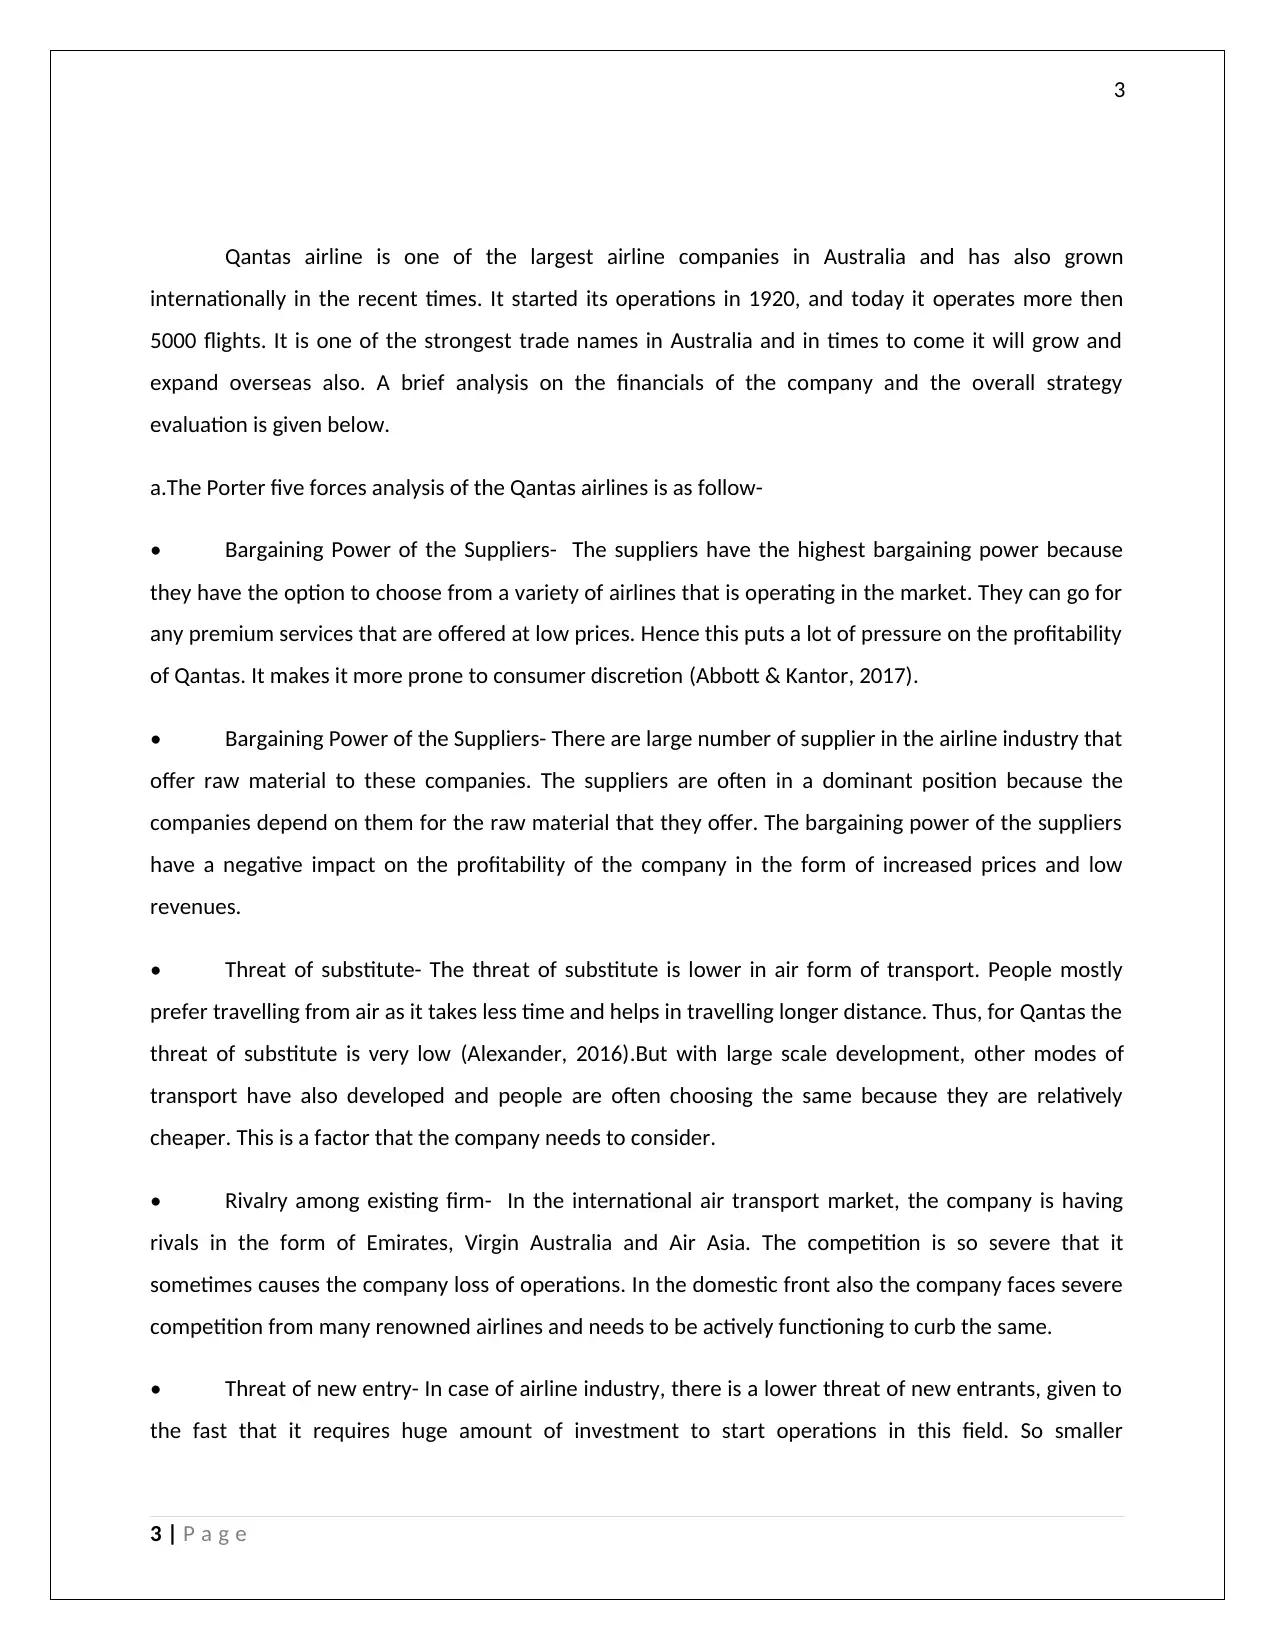
Qantas airline is one of the largest airline companies in Australia and has also grown
internationally in the recent times. It started its operations in 1920, and today it operates more then
5000 flights. It is one of the strongest trade names in Australia and in times to come it will grow and
expand overseas also. A brief analysis on the financials of the company and the overall strategy
evaluation is given below.
a.The Porter five forces analysis of the Qantas airlines is as follow-
• Bargaining Power of the Suppliers- The suppliers have the highest bargaining power because
they have the option to choose from a variety of airlines that is operating in the market. They can go for
any premium services that are offered at low prices. Hence this puts a lot of pressure on the profitability
of Qantas. It makes it more prone to consumer discretion (Abbott & Kantor, 2017).
• Bargaining Power of the Suppliers- There are large number of supplier in the airline industry that
offer raw material to these companies. The suppliers are often in a dominant position because the
companies depend on them for the raw material that they offer. The bargaining power of the suppliers
have a negative impact on the profitability of the company in the form of increased prices and low
revenues.
• Threat of substitute- The threat of substitute is lower in air form of transport. People mostly
prefer travelling from air as it takes less time and helps in travelling longer distance. Thus, for Qantas the
threat of substitute is very low (Alexander, 2016).But with large scale development, other modes of
transport have also developed and people are often choosing the same because they are relatively
cheaper. This is a factor that the company needs to consider.
• Rivalry among existing firm- In the international air transport market, the company is having
rivals in the form of Emirates, Virgin Australia and Air Asia. The competition is so severe that it
sometimes causes the company loss of operations. In the domestic front also the company faces severe
competition from many renowned airlines and needs to be actively functioning to curb the same.
• Threat of new entry- In case of airline industry, there is a lower threat of new entrants, given to
the fast that it requires huge amount of investment to start operations in this field. So smaller
3 | P a g e
Paraphrase This Document
Need a fresh take? Get an instant paraphrase of this document with our AI Paraphraser
4
companies are unable to afford the same (Birt, et al., 2017). There are high barriers exsisting to enter
this industry and thus the new entrants need to financially very strong to prevail in the market.
b. SWOT Analysis
Strengths- The Qantas airline is one of the largest operating airlines that has operations in many
countries. The major strengths of the company are-
• It is present in many international and domestic sector.
• It is one of the largest and the oldest operating airline sector.
• It has one of the largest brand building exercise through advertising and sponsoring.
• It offers variety of services like lounge, low cost flying programs etc.
Weakness – The major weakness includes incidences like price fixing and sabotage that have destroyed
the brand value of the company affecting its public image. The overall presence of the company
internationally is limited in comparison to other companies. The company has to develop its network to
make sure that it is delivering services in the international front also.
Opportunities – The company has great opportunity is widen its network by acquiring other small
companies that operate in this sector. The company can also have international tie-ups for wide
coverage and better growth. This will help in the overall growth and development of the company and
help it in getting an upper hand in comparison to other companies (Burke & Clark, 2016).
Threats – The major threats are from the suppliers in the form of increased fuel prices. The overall labor
charges have also increased. The presence of other international airlines is also affecting the growth of
the company. The customers are always looking for such companies that can provide them premium
services at cheaper prices. Thus the company needs to deal both with the suppliers and satisfy the
deamnds of the consumers.
c.The core competitive strategy for Qantas since 1992, across its domestic and international
market was to grow and expand its network. The company merged with the Australian Airlines in 1992,
that helped it bringing down its economies of scale and improving its overall revenue and business. The
company also aimed at eliminating competition by acquiring smaller units that operated in remote
4 | P a g e
5
places. This helped the company in improving its position and recovering its losses (Chariri, 2017).
Qantas aimed at the domestic end in improving its brand value by using the tools of advertising and
promotion. It aimed at providing premium services at lower cost and making use of the economies of
scale. It also tried to effectively improve its suppliers position by renovating its cost cutting model, and
getting the raw material at cheaper prices (Dichev, 2017). This is how the company aimed at improving
its business position both internationally and on the domestic front.
In response to the current market changes and the one that had occurred over the year, the
company is now aiming at delivering quality services even if they should charge higher prices. This is
because competition has become fierce and more and more companies are entering the market. The
suppliers are also making use of the dominant position as companies depend on them for supply of fuel
(Chiapello, 2017). Thus, this is a bad position for the company on a financial front, as it must deal with
excessive competition and make sure to deliver economically. Thus, the competitive strategy of the
company is marginally successful but it is not sustainable because on the international front the
company has no hold. It needs to revamp its model to grow internationally where the competition is
even more fierce (Crosby & Henneberry, 2016).
d.Two of the most critical accounting policies in case of airline companies that auditors must see
closely are –
Revenue recognition
The most important accounting policy is of revenue recognition. The airline revenue recognition
extends from calculating fare for the core passengers to the frequent flyers. The most common
accounting method for revenue recognition is that revenue that is received is deferred and is classified
as a liability on the balance sheet of the company, until the time the passenger or the freight is uplifted
and the revenue is then recognized on the balance sheet. The revenue recognition policy is used to
determine when to recognize unavailed revenue that occurs when the tickets are not used. It can have
huge impact on the results of the company. Hence the auditors must closely scrutinize the same.
Property, Plant and Equipment
Another important accounting policy that the auditor must check is the valuation of property,
plant and equipment. The airline companies take most of the aircrafts on leases, and hence valuation of
the same becomes difficult. It is important that companies must focus on the same, and make sure that
5 | P a g e
⊘ This is a preview!⊘
Do you want full access?
Subscribe today to unlock all pages.
Trusted by 1+ million students worldwide
6
impairment of the assets is recorded accordingly and accurate amount is reflected on the balance sheet.
Thus, it is important that correct amount estimation of the assets is done, considering the overall
impairment cost and cost of the leases and same should be shown on the financial reports of the
company.
The reason that these policies can be considered important is because they have significant effect on the
financial reports of the company and thus it is important that same must be considered for audit
process. The auditors must evaluate the accurate position of the financials of the company and consider
these accounting policies briefly. They play an important role in the overall profitability of the company
and the return that the shareholders earn.
Quantative Analysis
Ratios
For the Fiscal Period Ending 12 months
Jun-30-2013
12 months
Jun-30-2017
Profitability
Return on Assets % 0.8% 5.1%
Return on Capital % 1.4% 10.4%
Return on Equity % 0.0% 25.1%
Return on Common Equity % 0.0% 25.1%
Margin Analysis
Gross Margin % 26.5% 32.1%
EBIT Margin % 1.8% 8.6%
Net Income Margin % 0.0% 5.3%
Asset Turnover
Total Asset Turnover 0.8x 0.9x
Fixed Asset Turnover 1.2x 1.4x
Accounts Receivable Turnover 17.3x 22.2x
Inventory Turnover 31.4x 31.7x
Short Term Liquidity
Current Ratio 0.7x 0.4x
Quick Ratio 0.6x 0.4x
Long Term Solvency
Total Debt/Equity 104.1% 136.7%
Total Debt/Capital 51.0% 57.7%
LT Debt/Equity 89.8% 124.4%
LT Debt/Capital 44.0% 52.6%
Total Liabilities/Total Assets 70.8% 79.4%
Qantas Airways Limited > Ratios
6 | P a g e
Paraphrase This Document
Need a fresh take? Get an instant paraphrase of this document with our AI Paraphraser
7
I ncome Statement
For the Fiscal Period Ending
Restated
12 months
Jun-30-2013
12 months
Jun-30-2017
Currency AUD AUD
Revenue 14,608.0 14,665.0
Other Revenue 1,169.0 1,392.0
Total Revenue 15,777.0 16,057.0
Cost Of Goods Sold 11,603.0 10,897.0
Gross Profit 4,174.0 5,160.0
Selling General & Admin Exp. 540.0 509.0
R & D Exp. - -
Depreciation & Amort. 1,450.0 1,382.0
Other Operating Expense/(Income) 1,907.0 1,892.0
Other Operating Exp., Total 3,897.0 3,783.0
Operating Income 277.0 1,377.0
Interest Expense (265.0) (198.0)
Interest and Invest. Income 104.0 39.0
Net Interest Exp. (161.0) (159.0)
Income/(Loss) from Affiliates (39.0) (7.0)
Other Non-Operating Inc. (Exp.) (9.0) (11.0)
EBT Excl. Unusual Items 68.0 1,200.0
Restructuring Charges (97.0) (48.0)
Impairment of Goodwill - -
Gain (Loss) On Sale Of Invest. 30.0 22.0
Gain (Loss) On Sale Of Assets - 11.0
Asset Writedown (115.0) (4.0)
Other Unusual Items 125.0 -
EBT Incl. Unusual Items 11.0 1,181.0
Income Tax Expense 9.0 328.0
Earnings from Cont. Ops. 2.0 853.0
Earnings of Discontinued Ops. - -
Extraord. Item & Account. Change - -
Net Income to Company 2.0 853.0
Minority Int. in Earnings (1.0) (1.0)
Net Income 1.0 852.0
7 | P a g e
8
Balance Sheet
Balance Sheet as of: Restated
Jun-30-2013 Jun-30-2017
Currency AUD AUD
ASSETS
Cash And Equivalents 2,829.0 1,775.0
Total Cash & ST Investments 2,829.0 1,775.0
Accounts Receivable 898.0 664.0
Other Receivables 538.0 120.0
Total Receivables 1,436.0 784.0
Inventory 364.0 351.0
Prepaid Exp. - -
Other Current Assets 332.0 209.0
Total Current Assets 4,961.0 3,119.0
Gross Property, Plant & Equipment 22,929.0 25,188.0
Accumulated Depreciation (10,117.0) (13,687.0)
Net Property, Plant & Equipment 12,812.0 11,501.0
Long-term Investments 190.0 214.0
Goodwill 197.0 207.0
Other Intangibles 517.0 818.0
Deferred Tax Assets, LT - -
Other Long-Term Assets 1,355.0 1,362.0
Total Assets 20,032.0 17,221.0
LIABILITIES
Accounts Payable 640.0 -
Accrued Exp. 796.0 834.0
Curr. Port. of LT Debt 592.0 330.0
Curr. Port. of Cap. Leases 243.0 103.0
Unearned Revenue, Current 3,047.0 3,685.0
Other Current Liabilities 1,329.0 2,143.0
Total Current Liabilities 6,647.0 7,095.0
Long-Term Debt 4,612.0 3,144.0
Capital Leases 633.0 1,261.0
Unearned Revenue, Non-Current 1,186.0 1,424.0
Pension & Other Post-Retire. Benefits 59.0 -
Def. Tax Liability, Non-Curr. 625.0 353.0
Other Non-Current Liabilities 430.0 404.0
Total Liabilities 14,192.0 13,681.0
Common Stock 4,693.0 3,259.0
Additional Paid In Capital - -
Retained Earnings 1,057.0 472.0
Treasury Stock (43.0) (206.0)
Comprehensive Inc. and Other 128.0 12.0
Total Common Equity 5,835.0 3,537.0
Minority Interest 5.0 3.0
Total Equity 5,840.0 3,540.0
Total Liabilities And Equity 20,032.0 17,221.0
8 | P a g e
⊘ This is a preview!⊘
Do you want full access?
Subscribe today to unlock all pages.
Trusted by 1+ million students worldwide
9
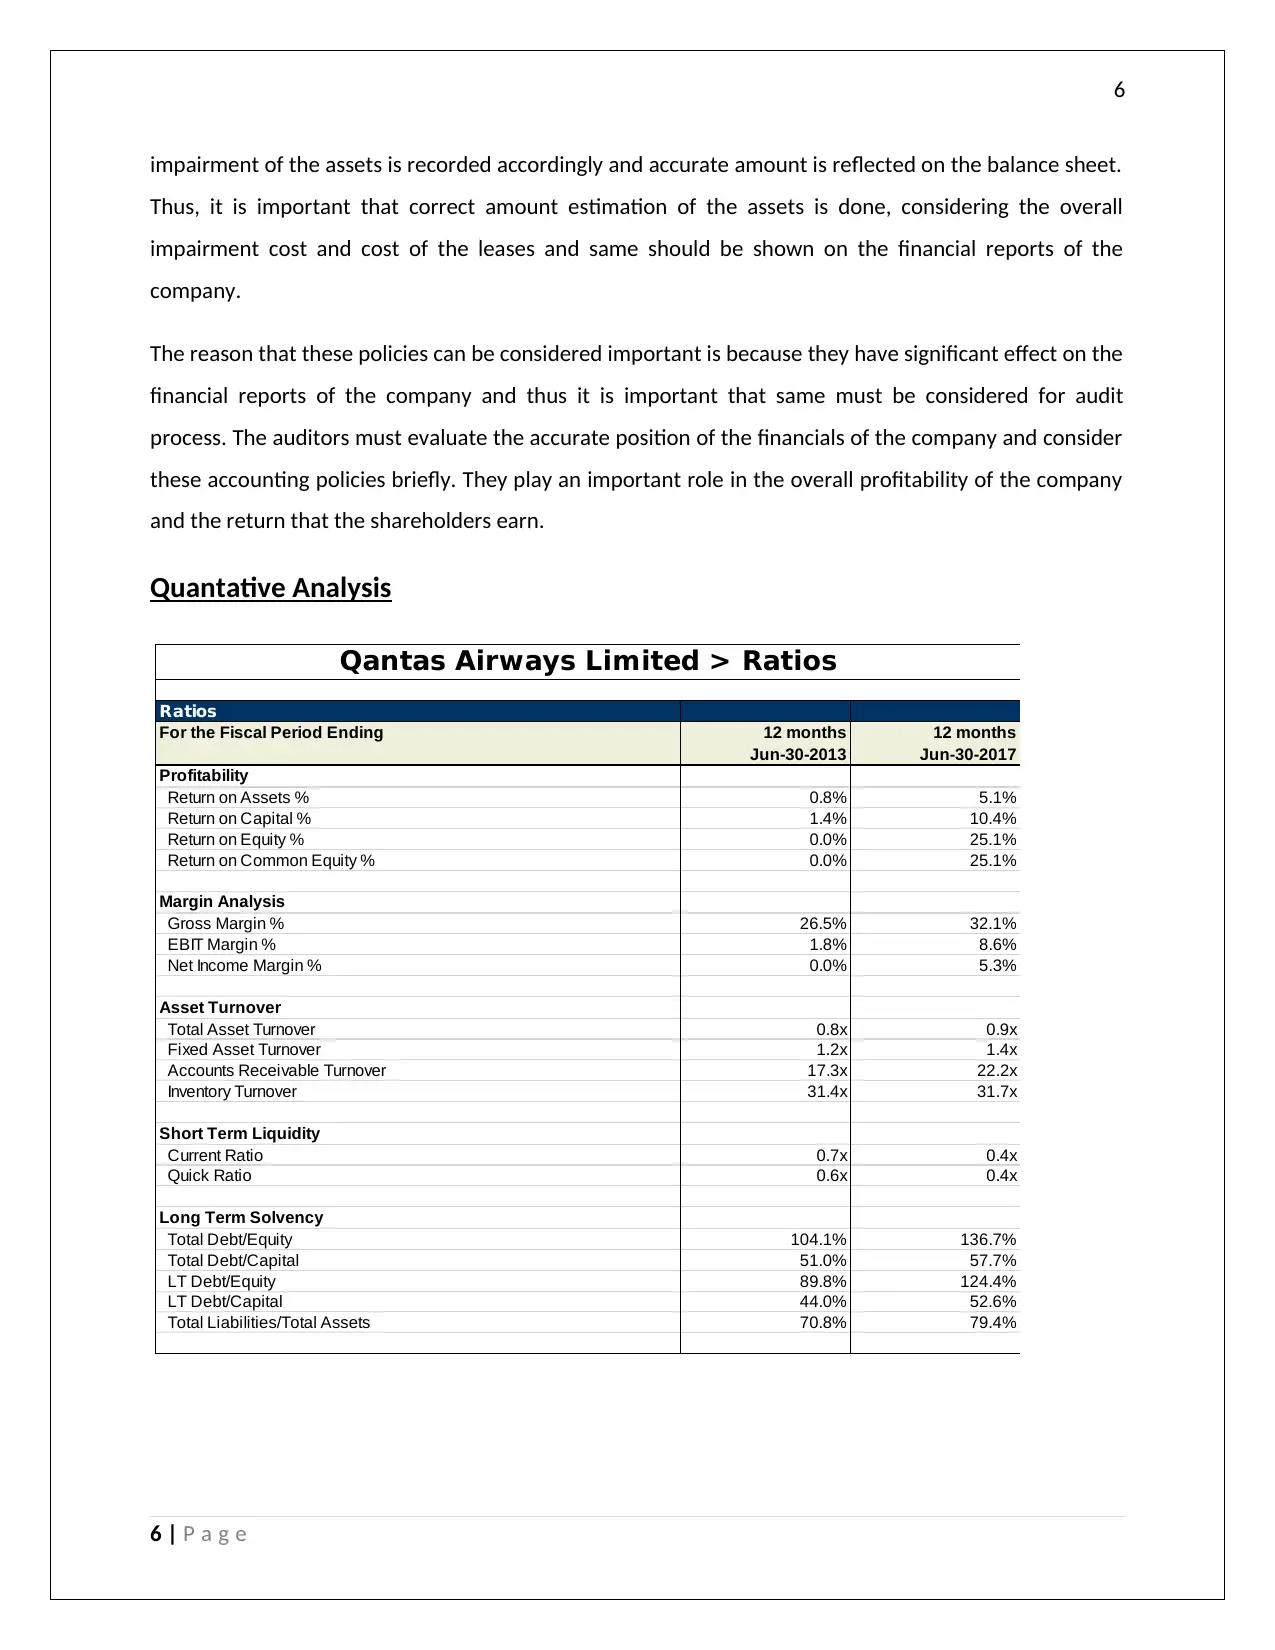
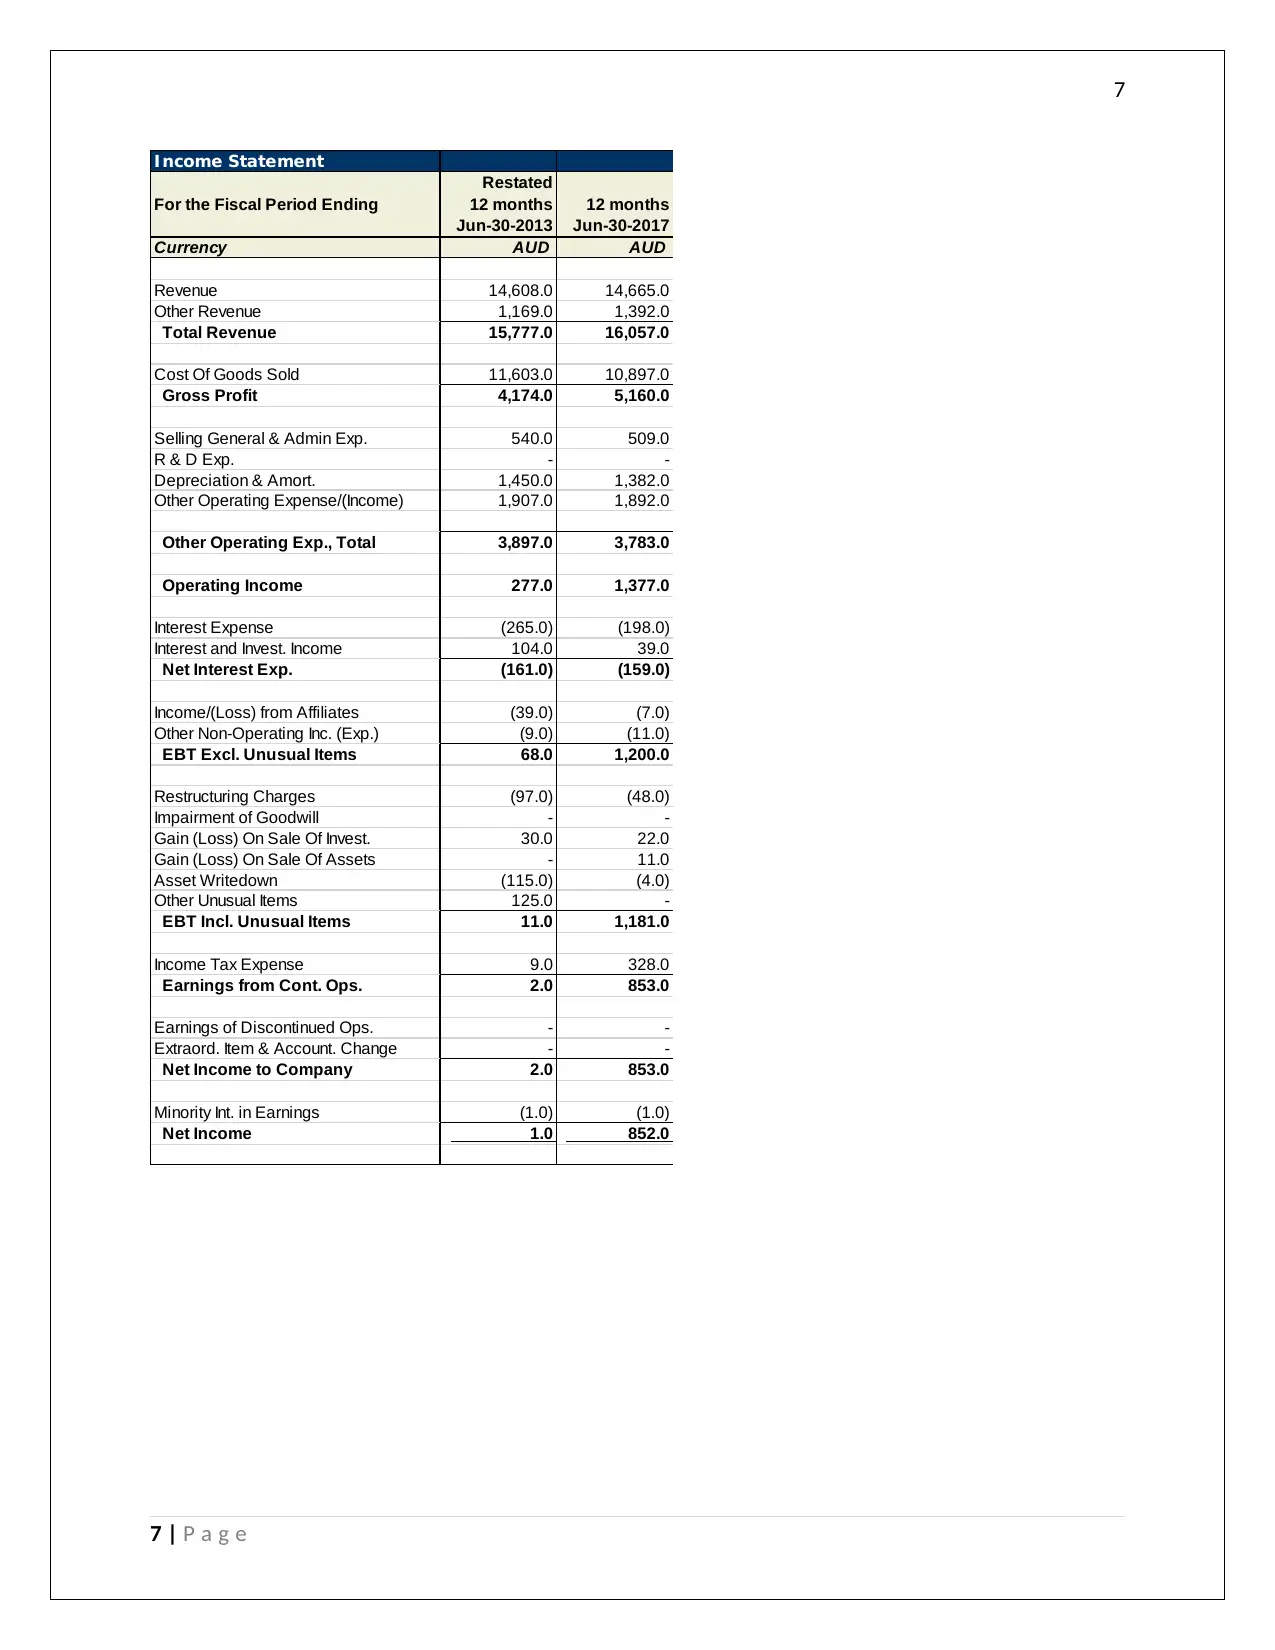
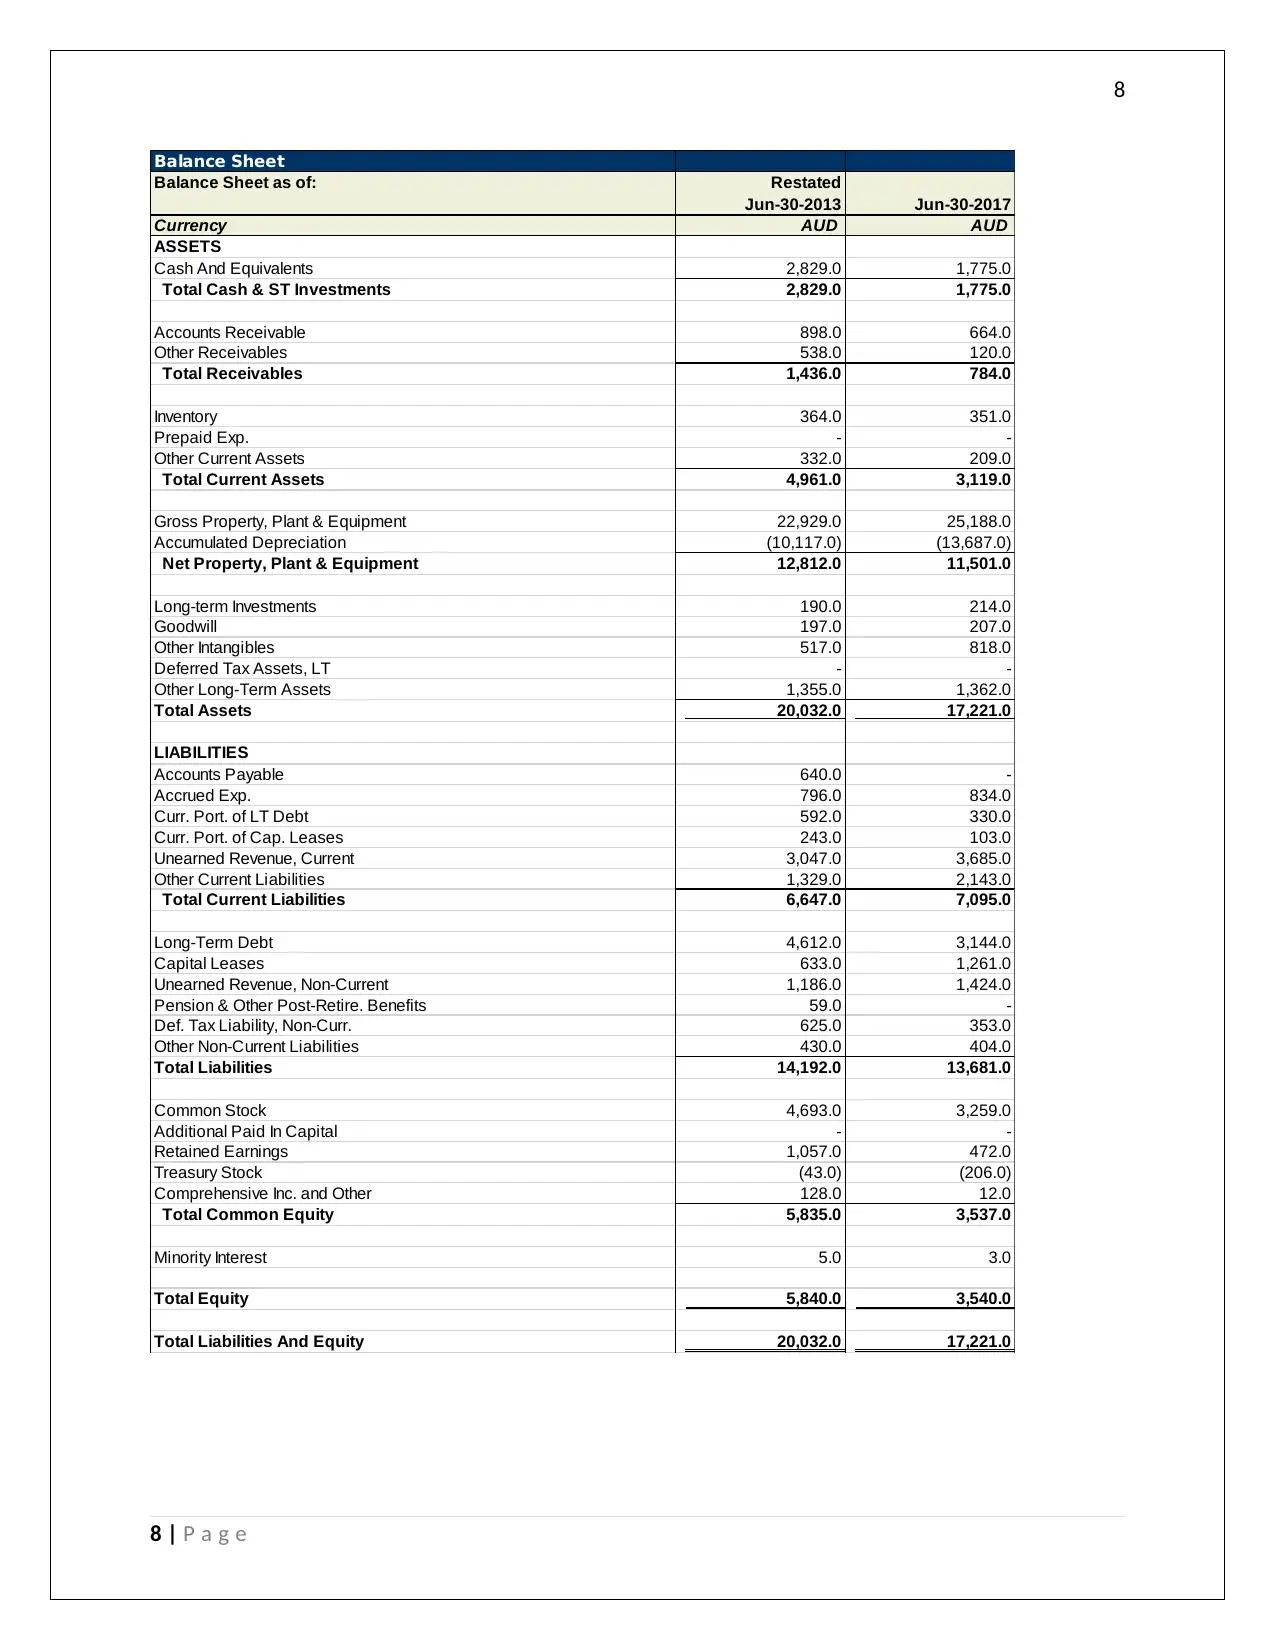
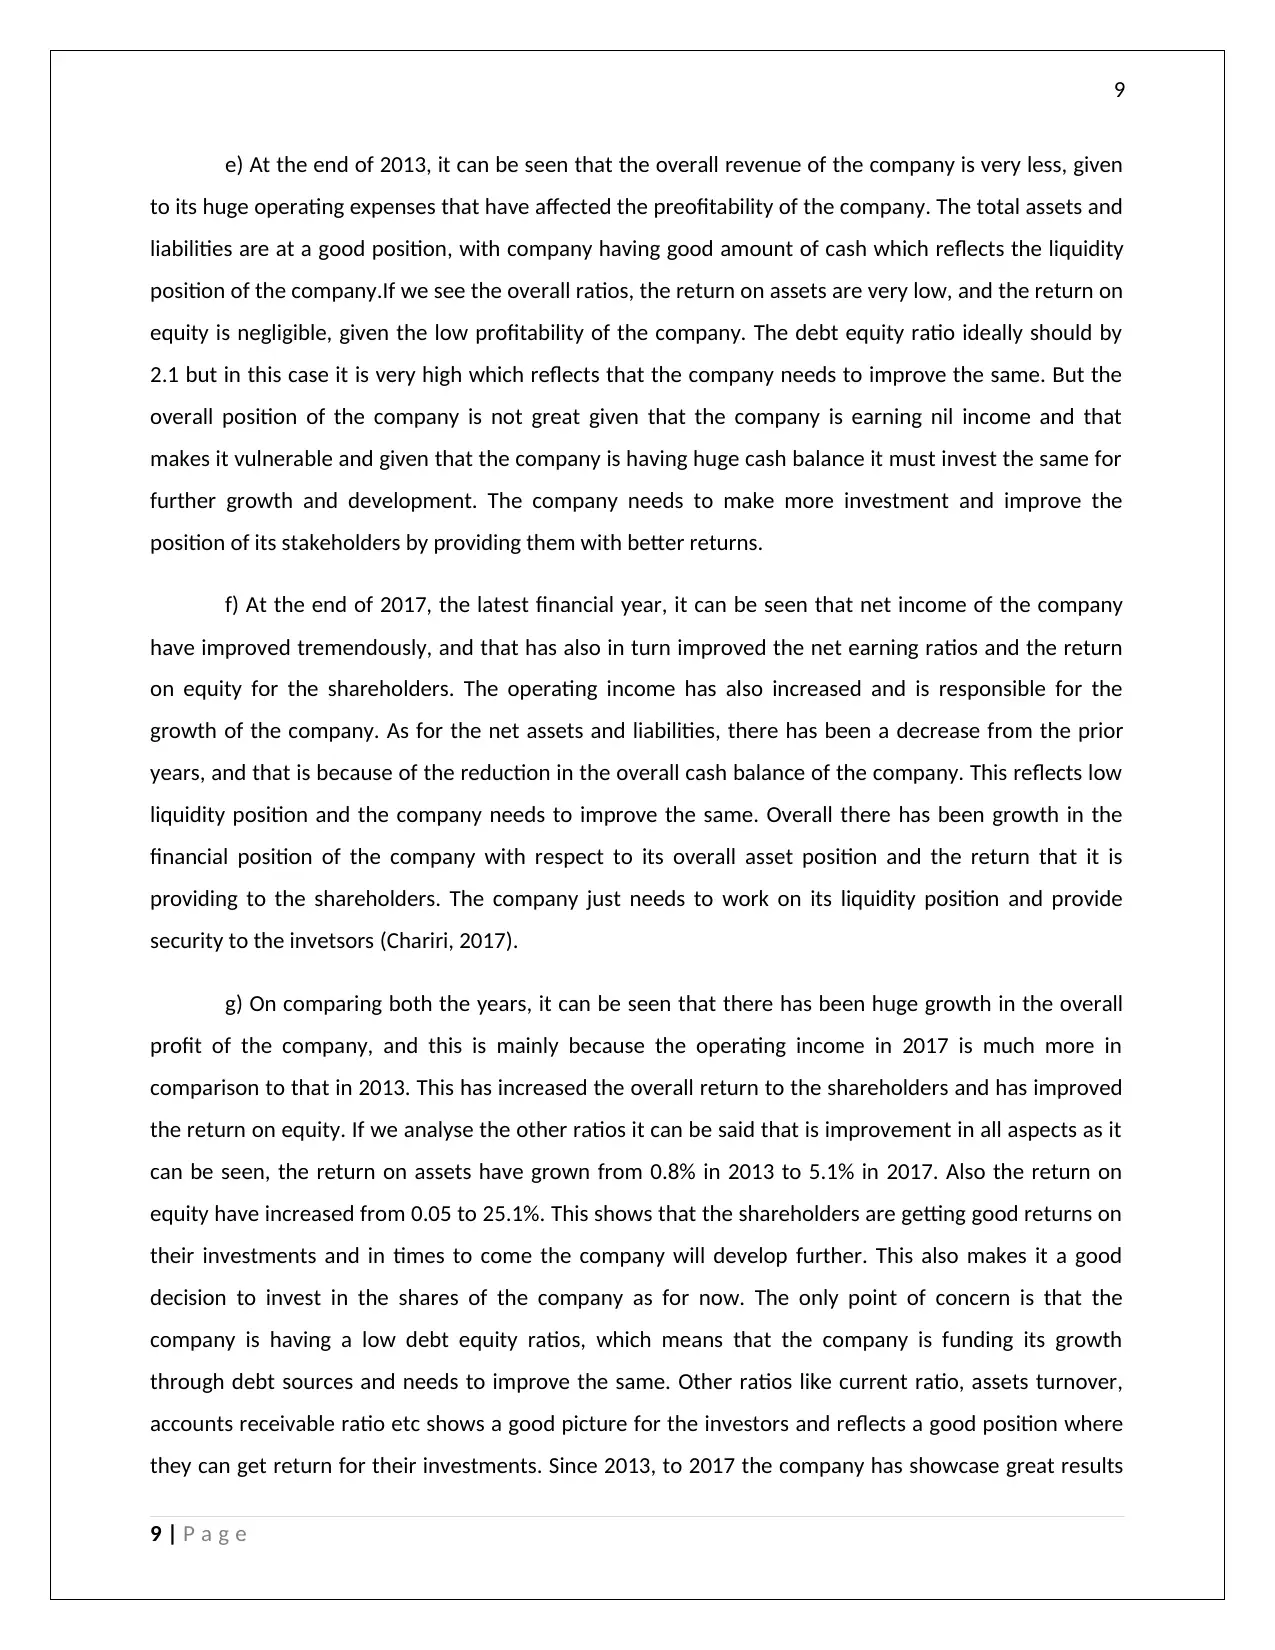
e) At the end of 2013, it can be seen that the overall revenue of the company is very less, given
to its huge operating expenses that have affected the preofitability of the company. The total assets and
liabilities are at a good position, with company having good amount of cash which reflects the liquidity
position of the company.If we see the overall ratios, the return on assets are very low, and the return on
equity is negligible, given the low profitability of the company. The debt equity ratio ideally should by
2.1 but in this case it is very high which reflects that the company needs to improve the same. But the
overall position of the company is not great given that the company is earning nil income and that
makes it vulnerable and given that the company is having huge cash balance it must invest the same for
further growth and development. The company needs to make more investment and improve the
position of its stakeholders by providing them with better returns.
f) At the end of 2017, the latest financial year, it can be seen that net income of the company
have improved tremendously, and that has also in turn improved the net earning ratios and the return
on equity for the shareholders. The operating income has also increased and is responsible for the
growth of the company. As for the net assets and liabilities, there has been a decrease from the prior
years, and that is because of the reduction in the overall cash balance of the company. This reflects low
liquidity position and the company needs to improve the same. Overall there has been growth in the
financial position of the company with respect to its overall asset position and the return that it is
providing to the shareholders. The company just needs to work on its liquidity position and provide
security to the invetsors (Chariri, 2017).
g) On comparing both the years, it can be seen that there has been huge growth in the overall
profit of the company, and this is mainly because the operating income in 2017 is much more in
comparison to that in 2013. This has increased the overall return to the shareholders and has improved
the return on equity. If we analyse the other ratios it can be said that is improvement in all aspects as it
can be seen, the return on assets have grown from 0.8% in 2013 to 5.1% in 2017. Also the return on
equity have increased from 0.05 to 25.1%. This shows that the shareholders are getting good returns on
their investments and in times to come the company will develop further. This also makes it a good
decision to invest in the shares of the company as for now. The only point of concern is that the
company is having a low debt equity ratios, which means that the company is funding its growth
through debt sources and needs to improve the same. Other ratios like current ratio, assets turnover,
accounts receivable ratio etc shows a good picture for the investors and reflects a good position where
they can get return for their investments. Since 2013, to 2017 the company has showcase great results
9 | P a g e
Paraphrase This Document
Need a fresh take? Get an instant paraphrase of this document with our AI Paraphraser
10
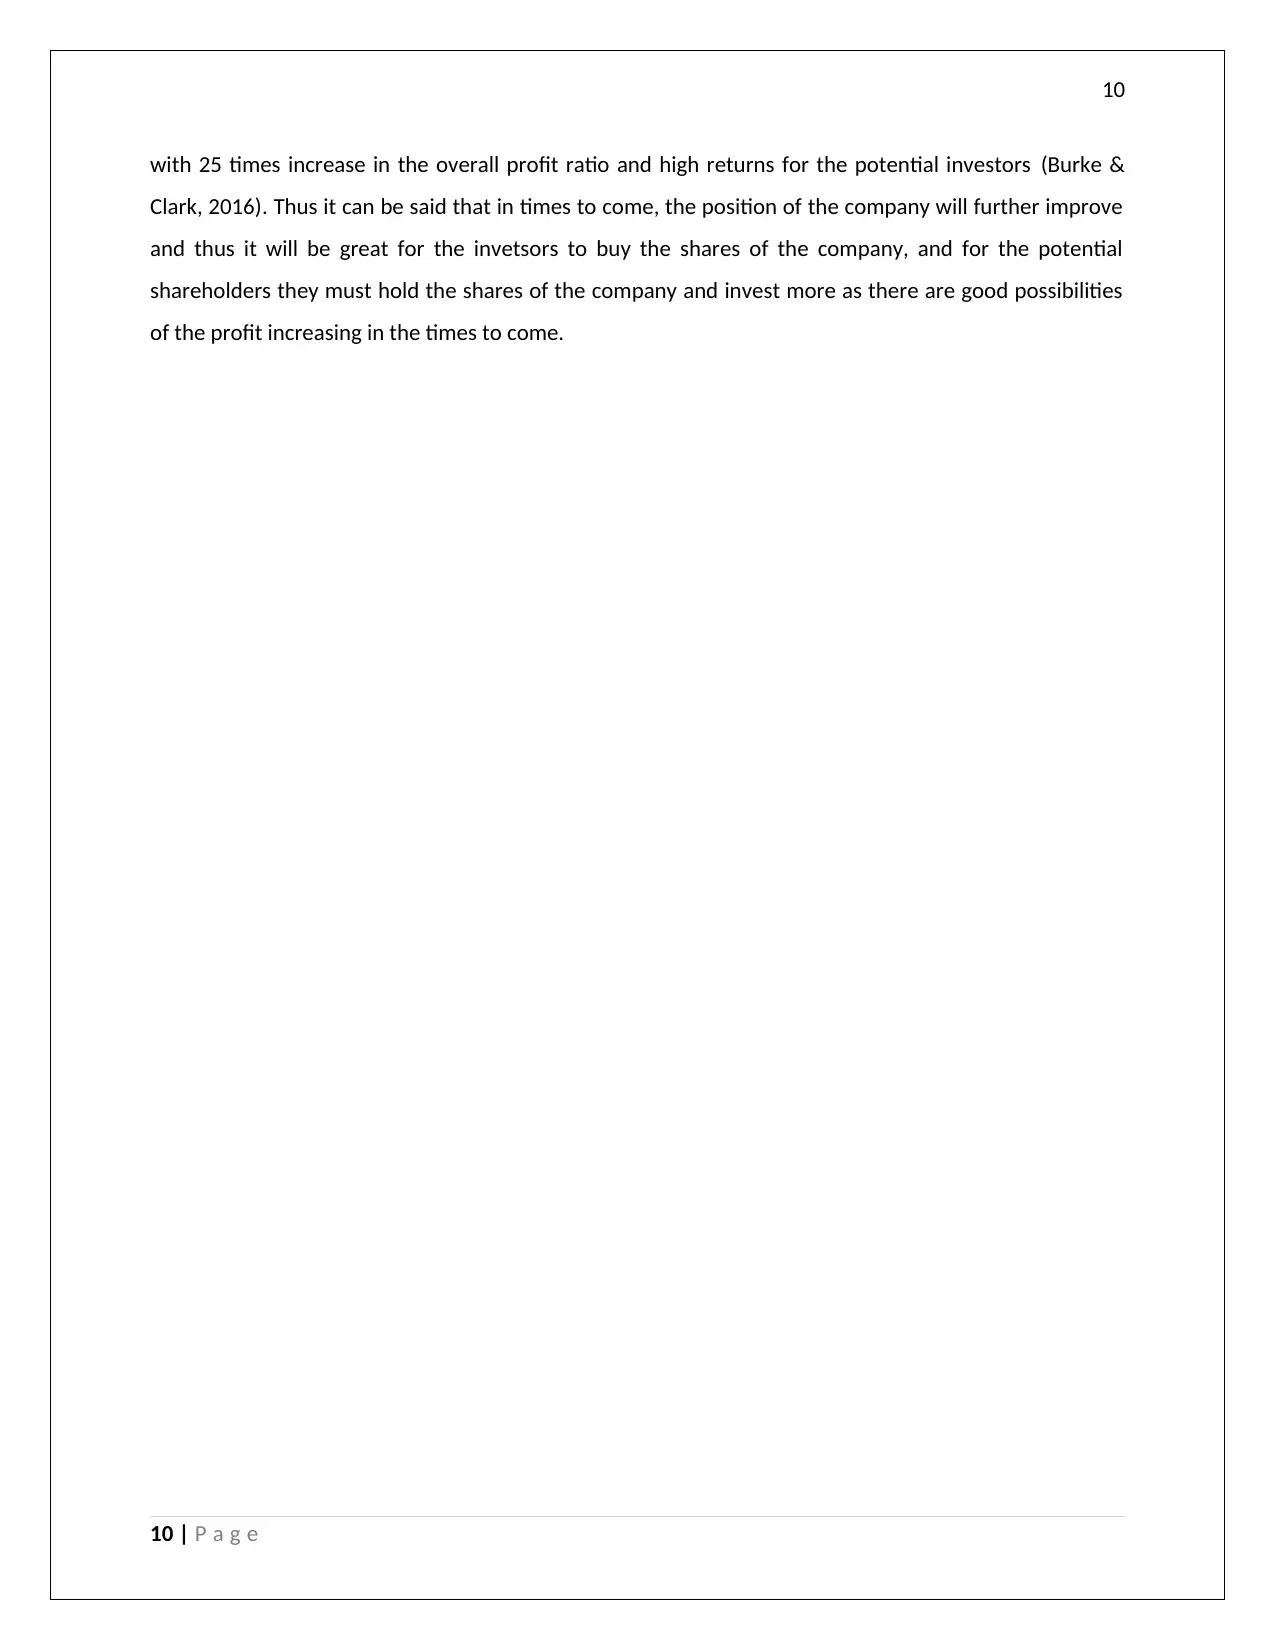
with 25 times increase in the overall profit ratio and high returns for the potential investors (Burke &
Clark, 2016). Thus it can be said that in times to come, the position of the company will further improve
and thus it will be great for the invetsors to buy the shares of the company, and for the potential
shareholders they must hold the shares of the company and invest more as there are good possibilities
of the profit increasing in the times to come.
10 | P a g e
11
References
Abbott, M. & Kantor, A., 2017. Fair Value Measurement and Mandated Accounting Changes: The Case of
the Victorian Rail Track Corporation. Australian accounting Review.
Alexander, F., 2016. The Changing Face of Accountability. The Journal of Higher Education, 71(4), pp.
411-431.
Birt, J., Muthusamy, K. & Bir, P., 2017. "XBRL and the qualitative characteristics of useful financial
information". Accounting Research Journal, 30(1), pp. 107-126.
Burke, J. & Clark, C., 2016. The business case for integrated reporting: Insights from leading
practitioners, regulators, and academics. Business Horizons, 59(3), pp. 273-283.
Chariri, A., 2017. FINANCIAL REPORTING PRACTICE AS A RITUAL: UNDERSTANDING ACCOUNTING
WITHIN INSTITUTIONAL FRAMEWORK. Journal of Economics, Business and Accountancy, 14(1).
Chiapello, E., 2017. Critical accounting research and neoliberalism. Critical Perspectives on Accounting,
Volume 43, pp. 47-64.
Crosby, N. & Henneberry, J., 2016. Financialisation, the valuation of investment property and the urban
built environment in the UK. Urban Studies, 53(7).
Dichev, I., 2017. On the conceptual foundations of financial reporting. Accounting and Business
Research, 47(6), pp. 617-632.
Fay, R. & Negangard, E., 2017. Manual journal entry testing : Data analytics and the risk of fraud. Journal
of Accounting Education, Volume 38, pp. 37-49.
Given, L., 2016. 100 questions (and answers) about qualitative research. s.l.:Sage.
Guragai, B., Hunt, N., Neri, M. & Taylor, E., 2017. Accounting Information Systems and Ethics Research:
Review, Synthesis, and the Future. Journal of Information Systems: Summer 2017, 31(2), pp. 65-81.
Han, B., Subrahmanyam, A. & Zhou, Y., 2017. The term structure of credit spreads, firm fundamentals,
and expected stock returns. Journal of Financial Economics, 24(1), pp. 147-171.
Maynard, J., 2017. Financial accounting reporting and analysis. second ed. United Kingdom: Oxford
University Press.
Prasad, P. & Chand, P., 2017. The Changing Face of the Auditor's Report: Implications for Suppliers and
Users of Financial Statements. Australian Accounting Review.
11 | P a g e
⊘ This is a preview!⊘
Do you want full access?
Subscribe today to unlock all pages.
Trusted by 1+ million students worldwide
1 out of 13
Related Documents


Your All-in-One AI-Powered Toolkit for Academic Success.
+13062052269
info@desklib.com
Available 24*7 on WhatsApp / Email
![[object Object]](/_next/static/media/star-bottom.7253800d.svg)
Unlock your academic potential
Copyright © 2020–2026 A2Z Services. All Rights Reserved. Developed and managed by ZUCOL.