Corporate Finance Report: Qantas and Westpac Share Price Evolution
VerifiedAdded on 2022/09/15
|10
|2378
|11
Report
AI Summary
This report provides a comprehensive analysis of the share prices of Qantas and Westpac over a five-year period, examining the influence of various external factors such as economic conditions, political events, and global events like the COVID-19 pandemic. The analysis includes a detailed examination of the companies' yearly average prices, percentage changes, and graphical representations of their stock price movements. Furthermore, the report delves into the concepts of systematic and unsystematic risk, assessing their impact on the two companies. The second part of the report focuses on capital budgeting, employing techniques such as Net Present Value (NPV), Internal Rate of Return (IRR), Profitability Index (PI), and Payback Period to evaluate potential investment projects. The report compares and contrasts the results obtained from these different methods, highlighting the circumstances under which each is most appropriate. The report concludes with a comparative analysis of two hypothetical projects, recommending Project B based on the capital budgeting techniques used.

Corporate Finance
Paraphrase This Document
Need a fresh take? Get an instant paraphrase of this document with our AI Paraphraser
Part A: Qantas and Westpac Share Price Analysis
Current stock price evolution
The prices of stock of an organisation are reflective of the changes in the external business
environment which includes the political, technological, economic, social and environmental
factors. Thus, the stock prices fluctuate because of the changes in the demand of a share due
to the above mentioned changes. The following segment would shed light on the changes of
the stock prices of the organisations Qantas and the Westpac Banking Corporation, and the
risk therein. The time period in consideration for the evaluation is the five years starting from
the year 2015.
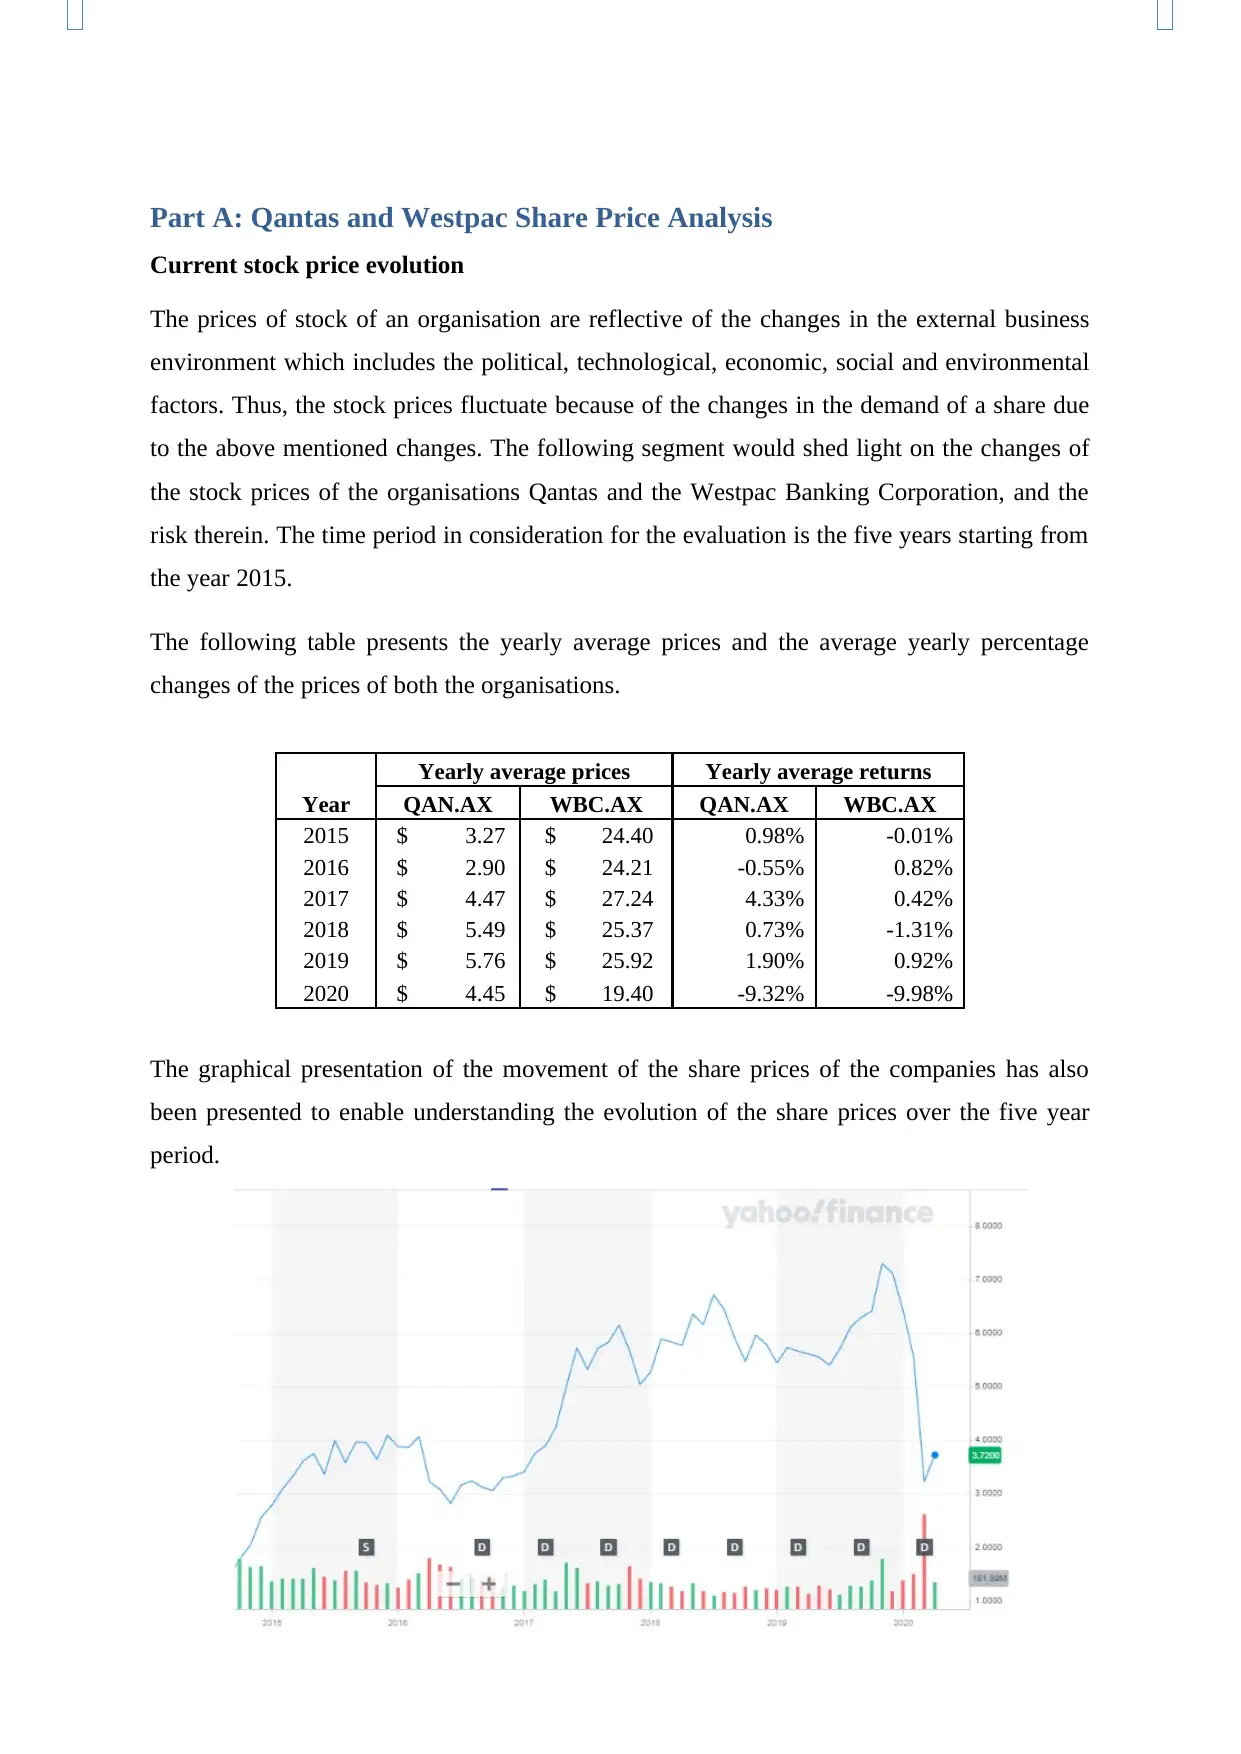
The following table presents the yearly average prices and the average yearly percentage
changes of the prices of both the organisations.
The graphical presentation of the movement of the share prices of the companies has also
been presented to enable understanding the evolution of the share prices over the five year
period.
Yearly average prices Yearly average returns
Year QAN.AX WBC.AX QAN.AX WBC.AX
2015 $ 3.27 $ 24.40 0.98% -0.01%
2016 $ 2.90 $ 24.21 -0.55% 0.82%
2017 $ 4.47 $ 27.24 4.33% 0.42%
2018 $ 5.49 $ 25.37 0.73% -1.31%
2019 $ 5.76 $ 25.92 1.90% 0.92%
2020 $ 4.45 $ 19.40 -9.32% -9.98%
Current stock price evolution
The prices of stock of an organisation are reflective of the changes in the external business
environment which includes the political, technological, economic, social and environmental
factors. Thus, the stock prices fluctuate because of the changes in the demand of a share due
to the above mentioned changes. The following segment would shed light on the changes of
the stock prices of the organisations Qantas and the Westpac Banking Corporation, and the
risk therein. The time period in consideration for the evaluation is the five years starting from
the year 2015.
The following table presents the yearly average prices and the average yearly percentage
changes of the prices of both the organisations.
The graphical presentation of the movement of the share prices of the companies has also
been presented to enable understanding the evolution of the share prices over the five year
period.
Yearly average prices Yearly average returns
Year QAN.AX WBC.AX QAN.AX WBC.AX
2015 $ 3.27 $ 24.40 0.98% -0.01%
2016 $ 2.90 $ 24.21 -0.55% 0.82%
2017 $ 4.47 $ 27.24 4.33% 0.42%
2018 $ 5.49 $ 25.37 0.73% -1.31%
2019 $ 5.76 $ 25.92 1.90% 0.92%
2020 $ 4.45 $ 19.40 -9.32% -9.98%
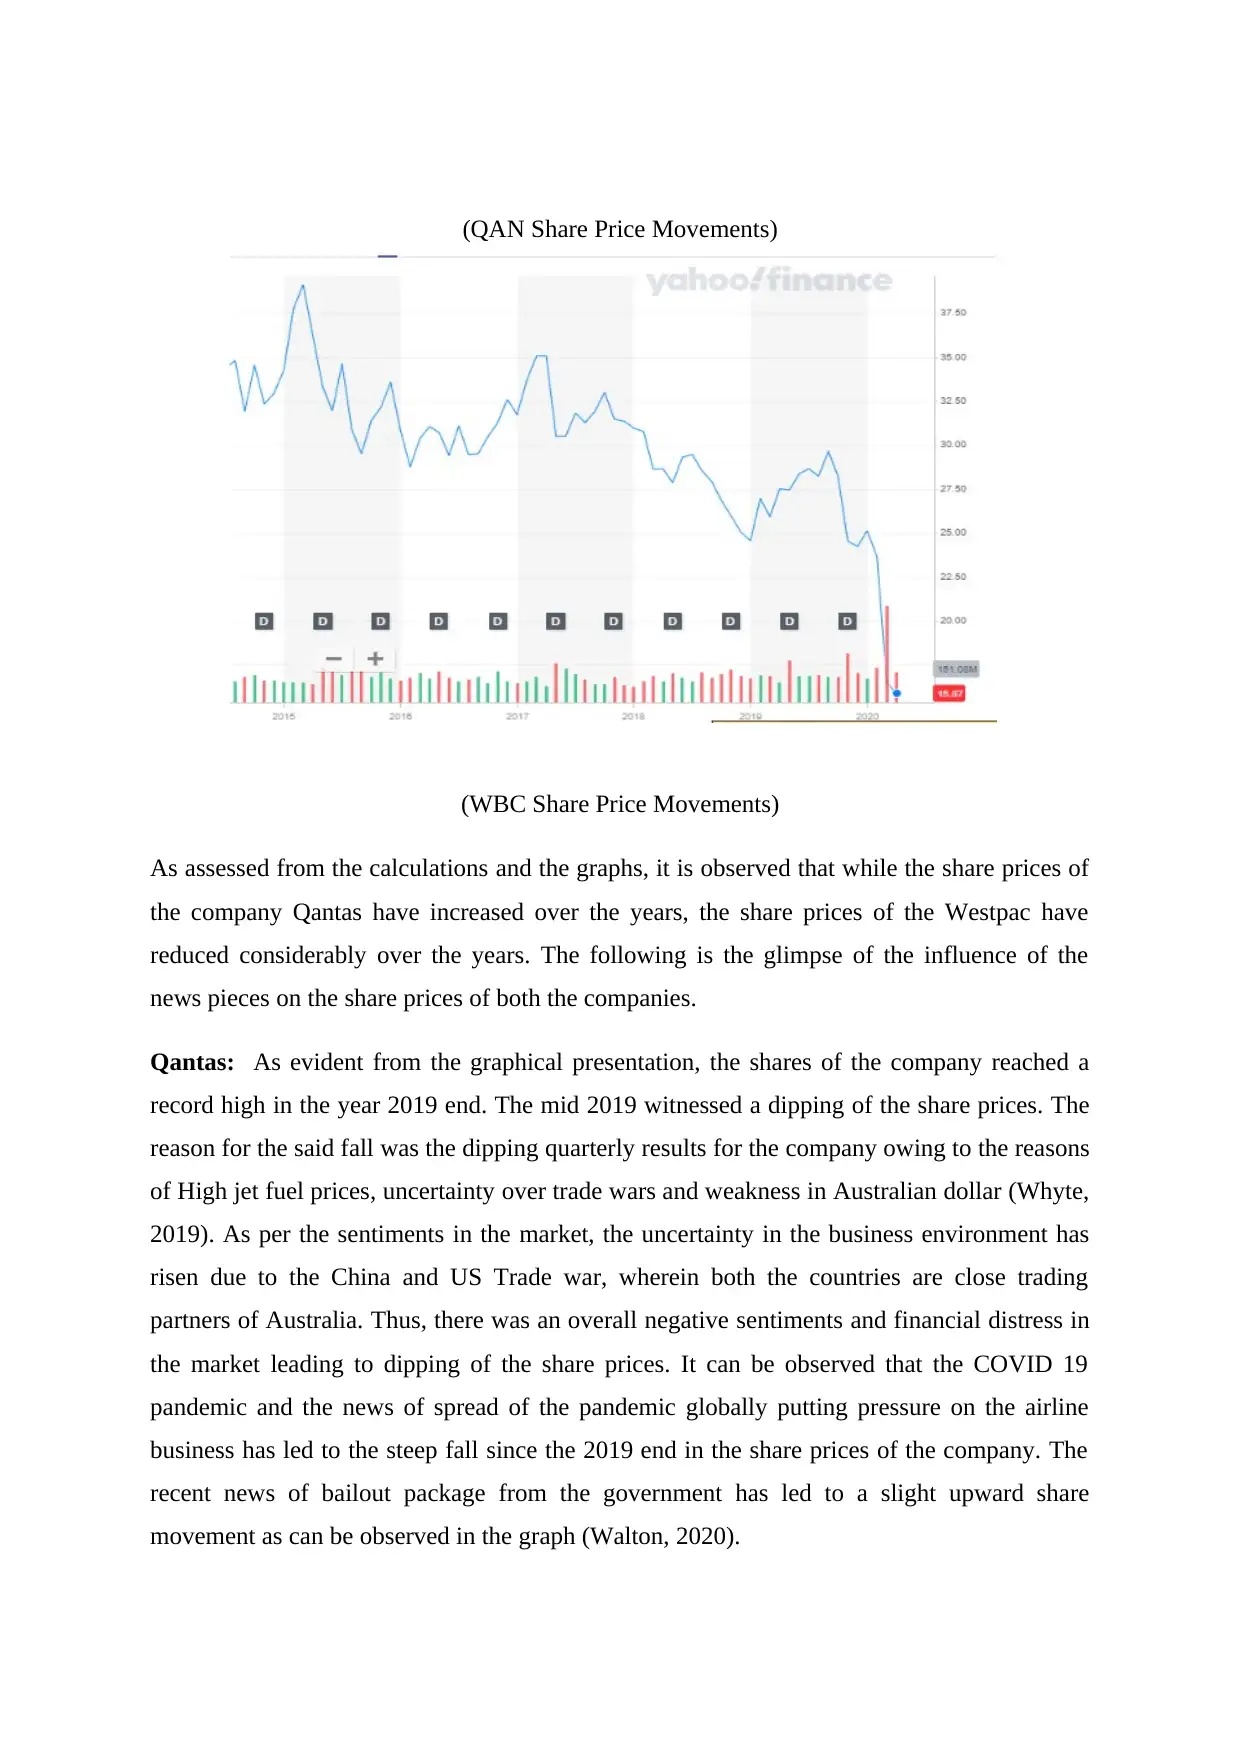
(QAN Share Price Movements)
(WBC Share Price Movements)
As assessed from the calculations and the graphs, it is observed that while the share prices of
the company Qantas have increased over the years, the share prices of the Westpac have
reduced considerably over the years. The following is the glimpse of the influence of the
news pieces on the share prices of both the companies.
Qantas: As evident from the graphical presentation, the shares of the company reached a
record high in the year 2019 end. The mid 2019 witnessed a dipping of the share prices. The
reason for the said fall was the dipping quarterly results for the company owing to the reasons
of High jet fuel prices, uncertainty over trade wars and weakness in Australian dollar (Whyte,
2019). As per the sentiments in the market, the uncertainty in the business environment has
risen due to the China and US Trade war, wherein both the countries are close trading
partners of Australia. Thus, there was an overall negative sentiments and financial distress in
the market leading to dipping of the share prices. It can be observed that the COVID 19
pandemic and the news of spread of the pandemic globally putting pressure on the airline
business has led to the steep fall since the 2019 end in the share prices of the company. The
recent news of bailout package from the government has led to a slight upward share
movement as can be observed in the graph (Walton, 2020).
⊘ This is a preview!⊘
Do you want full access?
Subscribe today to unlock all pages.
Trusted by 1+ million students worldwide
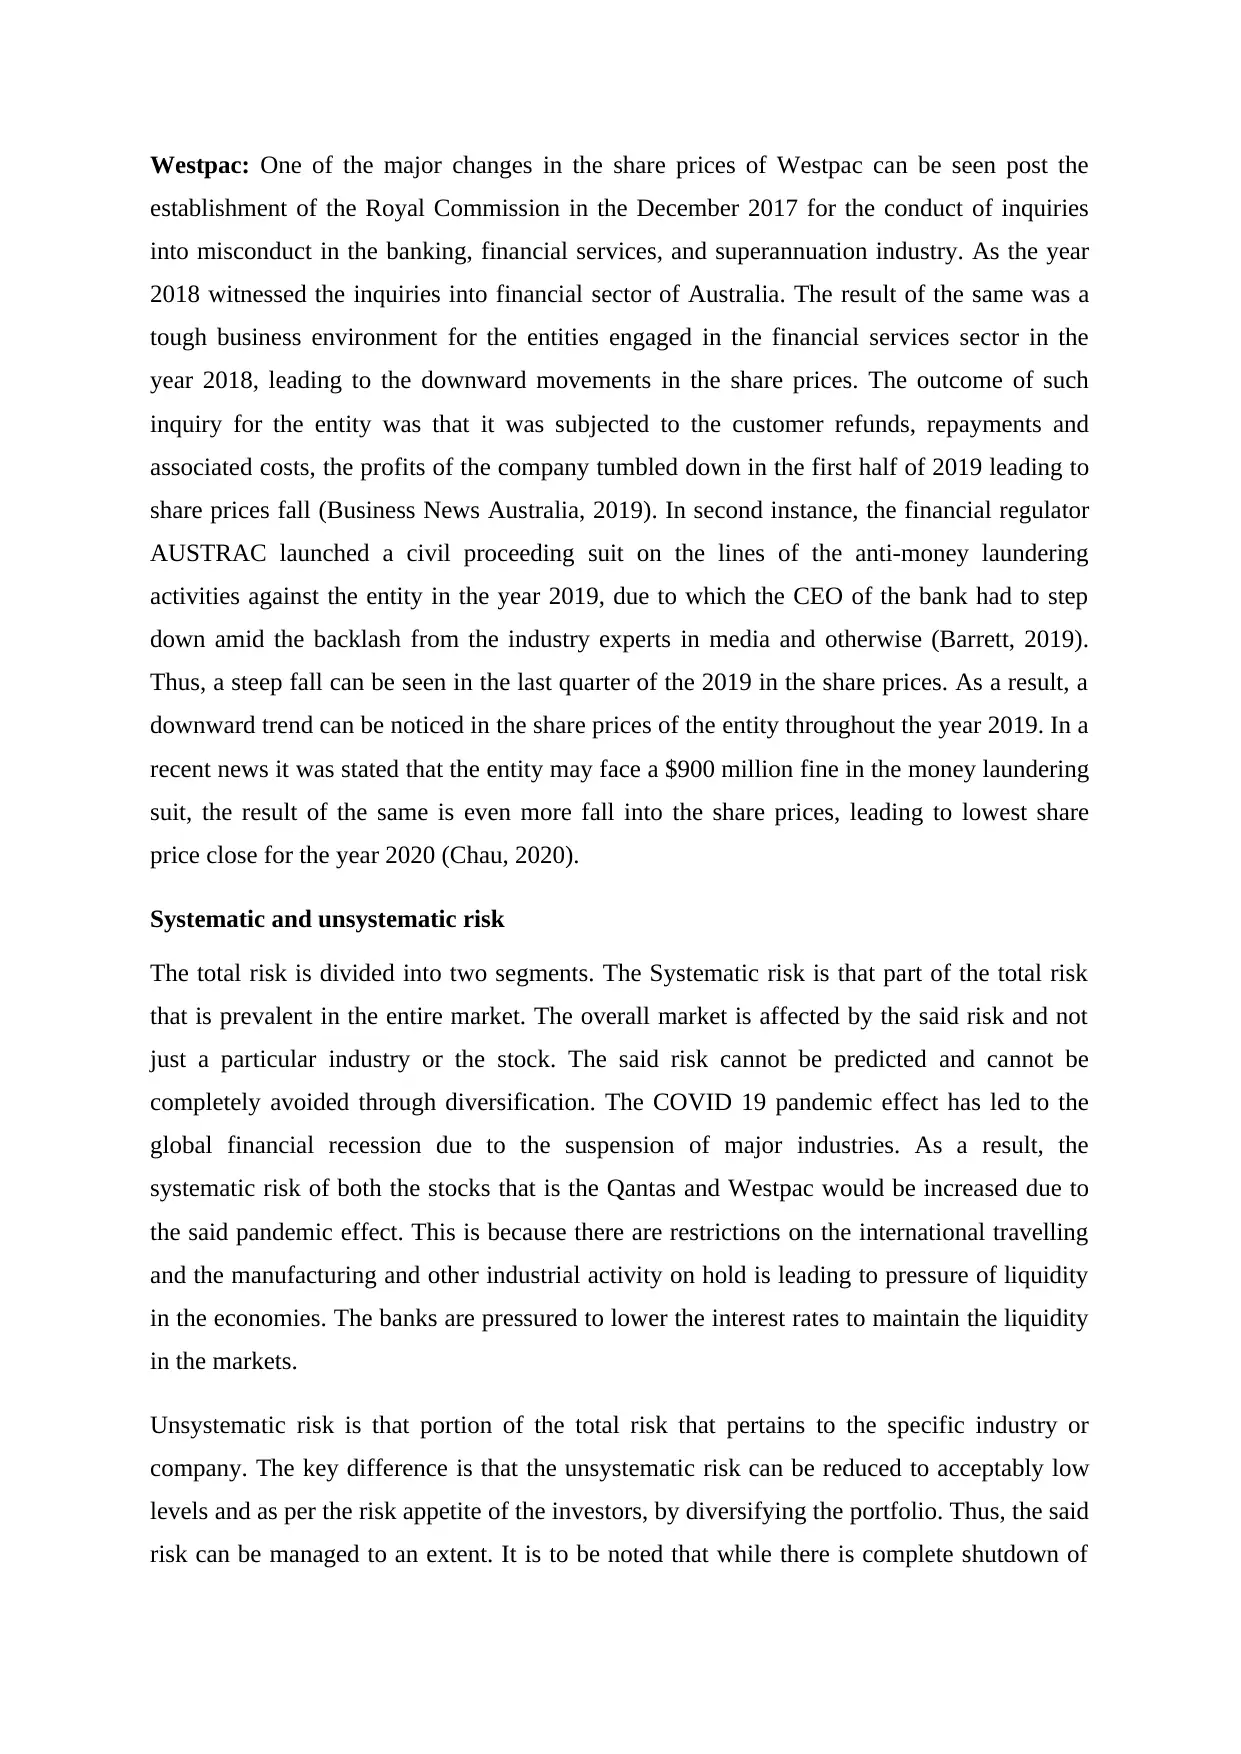
Westpac: One of the major changes in the share prices of Westpac can be seen post the
establishment of the Royal Commission in the December 2017 for the conduct of inquiries
into misconduct in the banking, financial services, and superannuation industry. As the year
2018 witnessed the inquiries into financial sector of Australia. The result of the same was a
tough business environment for the entities engaged in the financial services sector in the
year 2018, leading to the downward movements in the share prices. The outcome of such
inquiry for the entity was that it was subjected to the customer refunds, repayments and
associated costs, the profits of the company tumbled down in the first half of 2019 leading to
share prices fall (Business News Australia, 2019). In second instance, the financial regulator
AUSTRAC launched a civil proceeding suit on the lines of the anti-money laundering
activities against the entity in the year 2019, due to which the CEO of the bank had to step
down amid the backlash from the industry experts in media and otherwise (Barrett, 2019).
Thus, a steep fall can be seen in the last quarter of the 2019 in the share prices. As a result, a
downward trend can be noticed in the share prices of the entity throughout the year 2019. In a
recent news it was stated that the entity may face a $900 million fine in the money laundering
suit, the result of the same is even more fall into the share prices, leading to lowest share
price close for the year 2020 (Chau, 2020).
Systematic and unsystematic risk
The total risk is divided into two segments. The Systematic risk is that part of the total risk
that is prevalent in the entire market. The overall market is affected by the said risk and not
just a particular industry or the stock. The said risk cannot be predicted and cannot be
completely avoided through diversification. The COVID 19 pandemic effect has led to the
global financial recession due to the suspension of major industries. As a result, the
systematic risk of both the stocks that is the Qantas and Westpac would be increased due to
the said pandemic effect. This is because there are restrictions on the international travelling
and the manufacturing and other industrial activity on hold is leading to pressure of liquidity
in the economies. The banks are pressured to lower the interest rates to maintain the liquidity
in the markets.
Unsystematic risk is that portion of the total risk that pertains to the specific industry or
company. The key difference is that the unsystematic risk can be reduced to acceptably low
levels and as per the risk appetite of the investors, by diversifying the portfolio. Thus, the said
risk can be managed to an extent. It is to be noted that while there is complete shutdown of
Paraphrase This Document
Need a fresh take? Get an instant paraphrase of this document with our AI Paraphraser
international travel in various countries around the world, the financial institutions are still
functioning more or less through the online medium. Thus, the unsystematic risk of Qantas is
higher than that of the Westpac in the wake of the COVID 19 pandemic.
Part B: Capital Budgeting
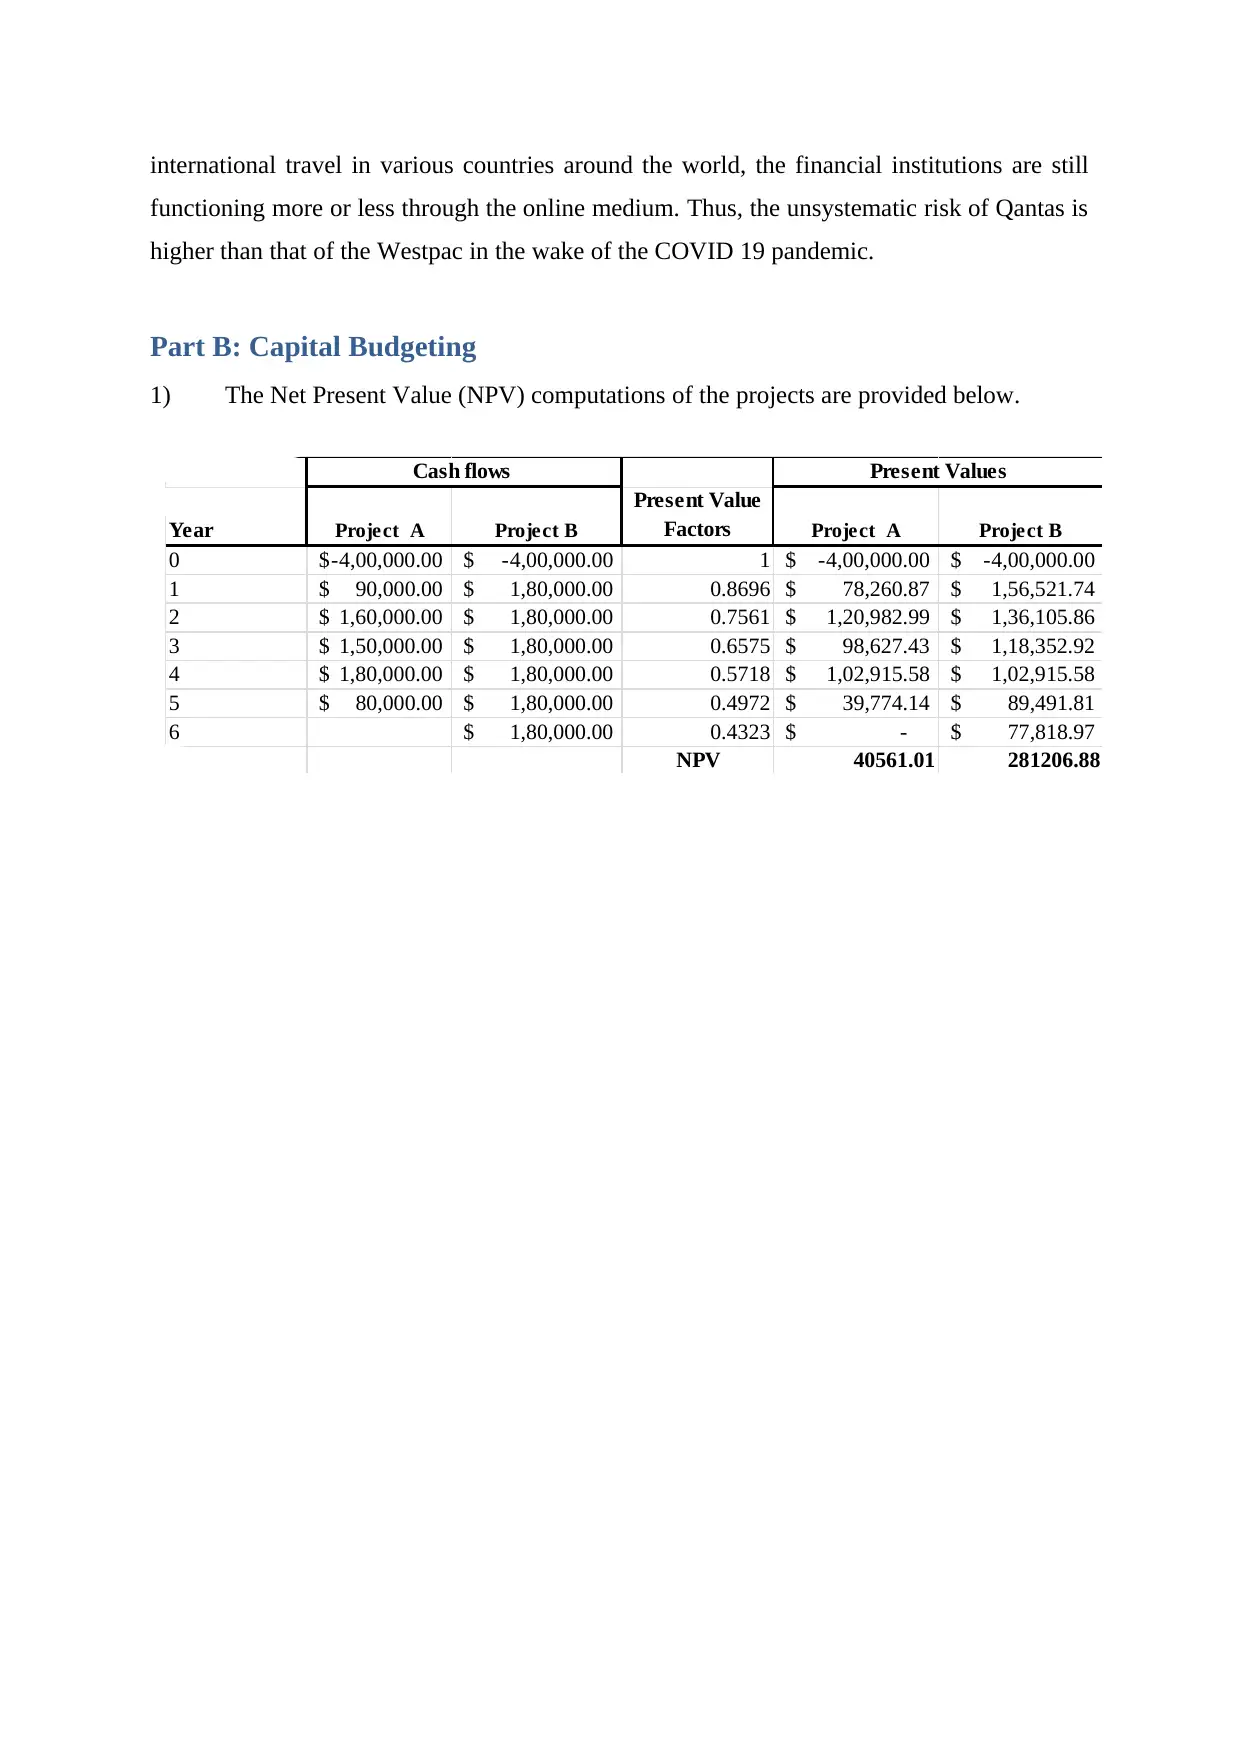
1) The Net Present Value (NPV) computations of the projects are provided below.
Year Project A Project B
Present Value
Factors Project A Project B
0 -4,00,000.00$ -4,00,000.00$ 1 -4,00,000.00$ -4,00,000.00$
1 90,000.00$ 1,80,000.00$ 0.8696 78,260.87$ 1,56,521.74$
2 1,60,000.00$ 1,80,000.00$ 0.7561 1,20,982.99$ 1,36,105.86$
3 1,50,000.00$ 1,80,000.00$ 0.6575 98,627.43$ 1,18,352.92$
4 1,80,000.00$ 1,80,000.00$ 0.5718 1,02,915.58$ 1,02,915.58$
5 80,000.00$ 1,80,000.00$ 0.4972 39,774.14$ 89,491.81$
6 1,80,000.00$ 0.4323 -$ 77,818.97$
NPV 40561.01 281206.88
Cash flows Present Values
functioning more or less through the online medium. Thus, the unsystematic risk of Qantas is
higher than that of the Westpac in the wake of the COVID 19 pandemic.
Part B: Capital Budgeting
1) The Net Present Value (NPV) computations of the projects are provided below.
Year Project A Project B
Present Value
Factors Project A Project B
0 -4,00,000.00$ -4,00,000.00$ 1 -4,00,000.00$ -4,00,000.00$
1 90,000.00$ 1,80,000.00$ 0.8696 78,260.87$ 1,56,521.74$
2 1,60,000.00$ 1,80,000.00$ 0.7561 1,20,982.99$ 1,36,105.86$
3 1,50,000.00$ 1,80,000.00$ 0.6575 98,627.43$ 1,18,352.92$
4 1,80,000.00$ 1,80,000.00$ 0.5718 1,02,915.58$ 1,02,915.58$
5 80,000.00$ 1,80,000.00$ 0.4972 39,774.14$ 89,491.81$
6 1,80,000.00$ 0.4323 -$ 77,818.97$
NPV 40561.01 281206.88
Cash flows Present Values
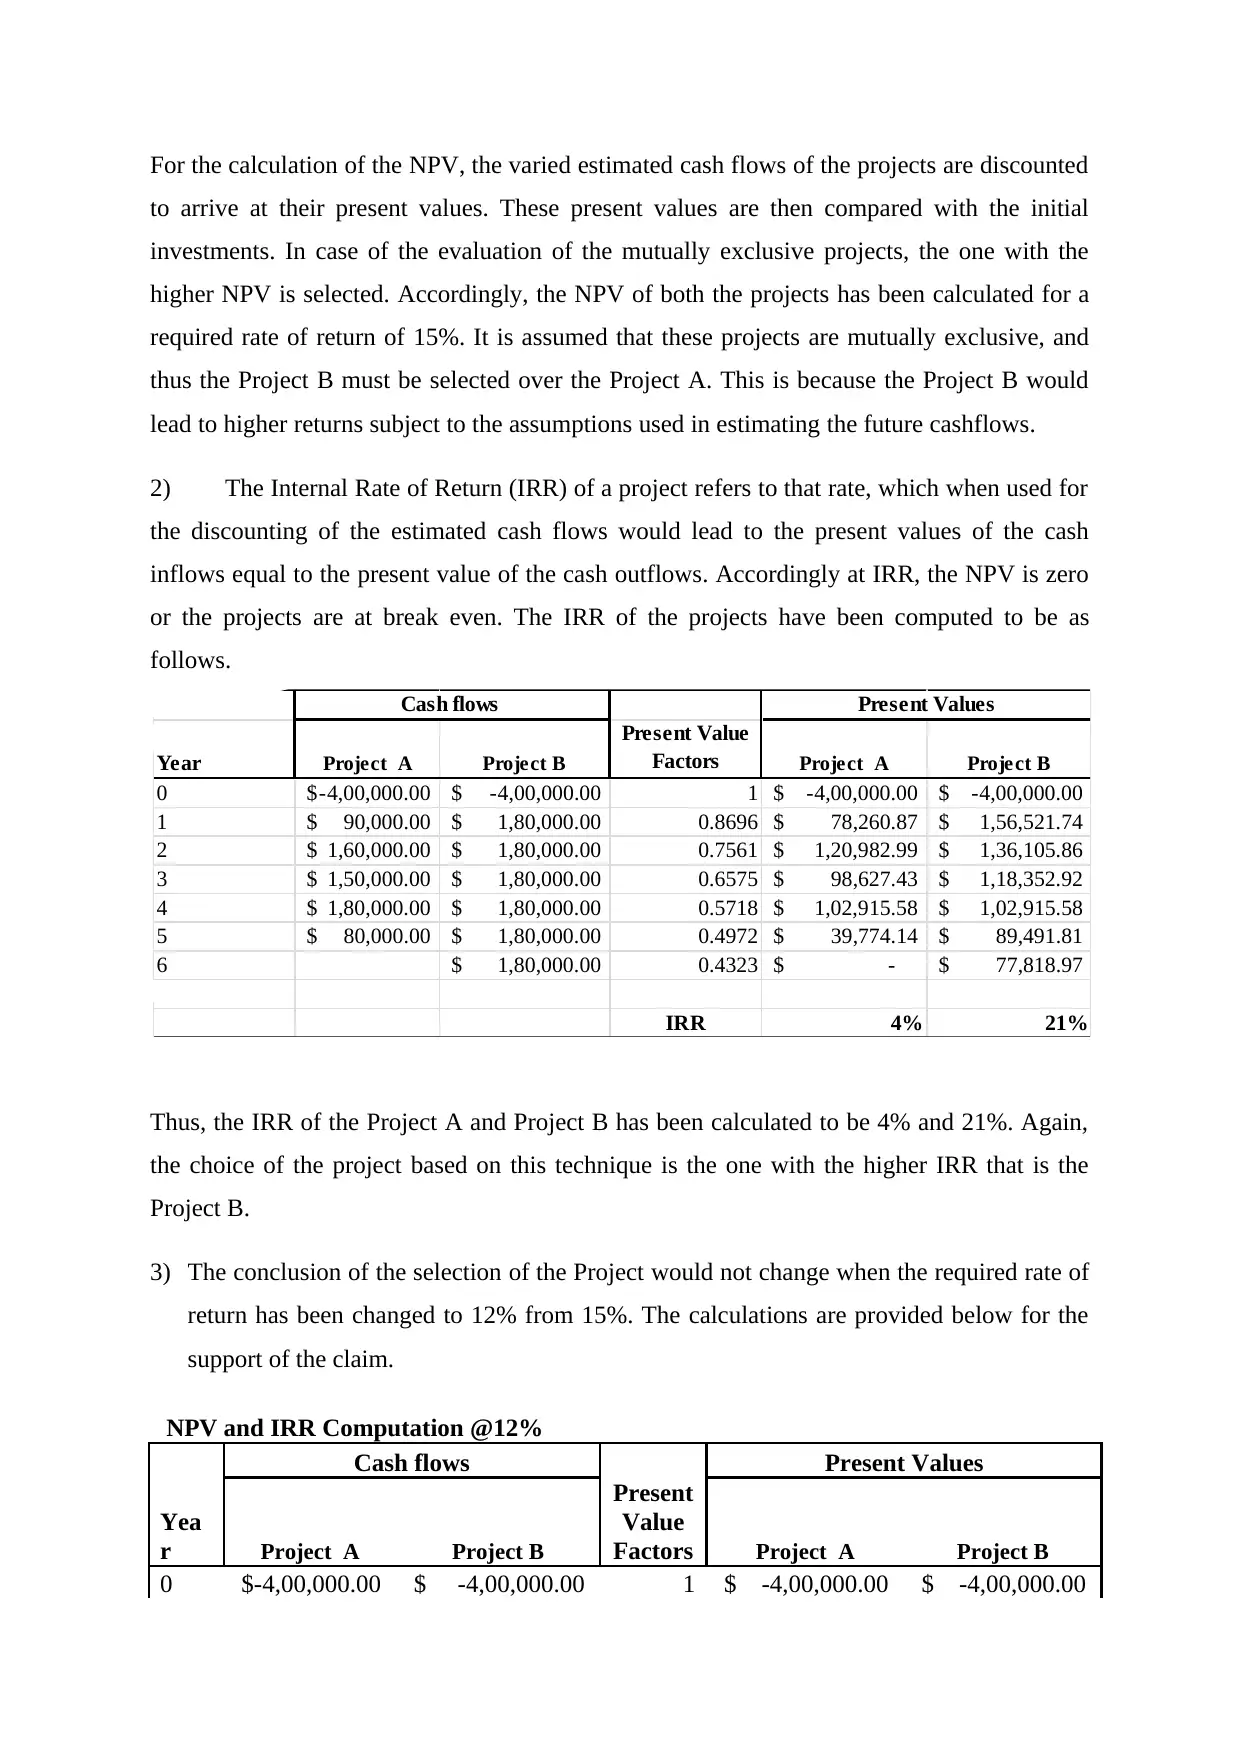
For the calculation of the NPV, the varied estimated cash flows of the projects are discounted
to arrive at their present values. These present values are then compared with the initial
investments. In case of the evaluation of the mutually exclusive projects, the one with the
higher NPV is selected. Accordingly, the NPV of both the projects has been calculated for a
required rate of return of 15%. It is assumed that these projects are mutually exclusive, and
thus the Project B must be selected over the Project A. This is because the Project B would
lead to higher returns subject to the assumptions used in estimating the future cashflows.
2) The Internal Rate of Return (IRR) of a project refers to that rate, which when used for
the discounting of the estimated cash flows would lead to the present values of the cash
inflows equal to the present value of the cash outflows. Accordingly at IRR, the NPV is zero
or the projects are at break even. The IRR of the projects have been computed to be as
follows.
Thus, the IRR of the Project A and Project B has been calculated to be 4% and 21%. Again,
the choice of the project based on this technique is the one with the higher IRR that is the
Project B.
3) The conclusion of the selection of the Project would not change when the required rate of
return has been changed to 12% from 15%. The calculations are provided below for the
support of the claim.
NPV and IRR Computation @12%
Cash flows Present Values
Yea
r Project A Project B
Present
Value
Factors Project A Project B
0 $-4,00,000.00 $ -4,00,000.00 1 $ -4,00,000.00 $ -4,00,000.00
Year Project A Project B
Present Value
Factors Project A Project B
0 -4,00,000.00$ -4,00,000.00$ 1 -4,00,000.00$ -4,00,000.00$
1 90,000.00$ 1,80,000.00$ 0.8696 78,260.87$ 1,56,521.74$
2 1,60,000.00$ 1,80,000.00$ 0.7561 1,20,982.99$ 1,36,105.86$
3 1,50,000.00$ 1,80,000.00$ 0.6575 98,627.43$ 1,18,352.92$
4 1,80,000.00$ 1,80,000.00$ 0.5718 1,02,915.58$ 1,02,915.58$
5 80,000.00$ 1,80,000.00$ 0.4972 39,774.14$ 89,491.81$
6 1,80,000.00$ 0.4323 -$ 77,818.97$
IRR 4% 21%
Cash flows Present Values
⊘ This is a preview!⊘
Do you want full access?
Subscribe today to unlock all pages.
Trusted by 1+ million students worldwide
1 $ 90,000.00 $ 1,80,000.00 0.8929 $ 80,357.14 $ 1,60,714.29
2 $ 1,60,000.00 $ 1,80,000.00 0.7972 $ 1,27,551.02 $ 1,43,494.90
3 $ 1,50,000.00 $ 1,80,000.00 0.7118 $ 1,06,767.04 $ 1,28,120.44
4 $ 1,80,000.00 $ 1,80,000.00 0.6355 $ 1,14,393.25 $ 1,14,393.25
5 $ 80,000.00 $ 1,80,000.00 0.5674 $ 45,394.15 $ 1,02,136.83
6 $ 1,80,000.00 0.5066 $ - $ 91,193.60
NPV 74462.60 340053.32
IRR 6% 24%
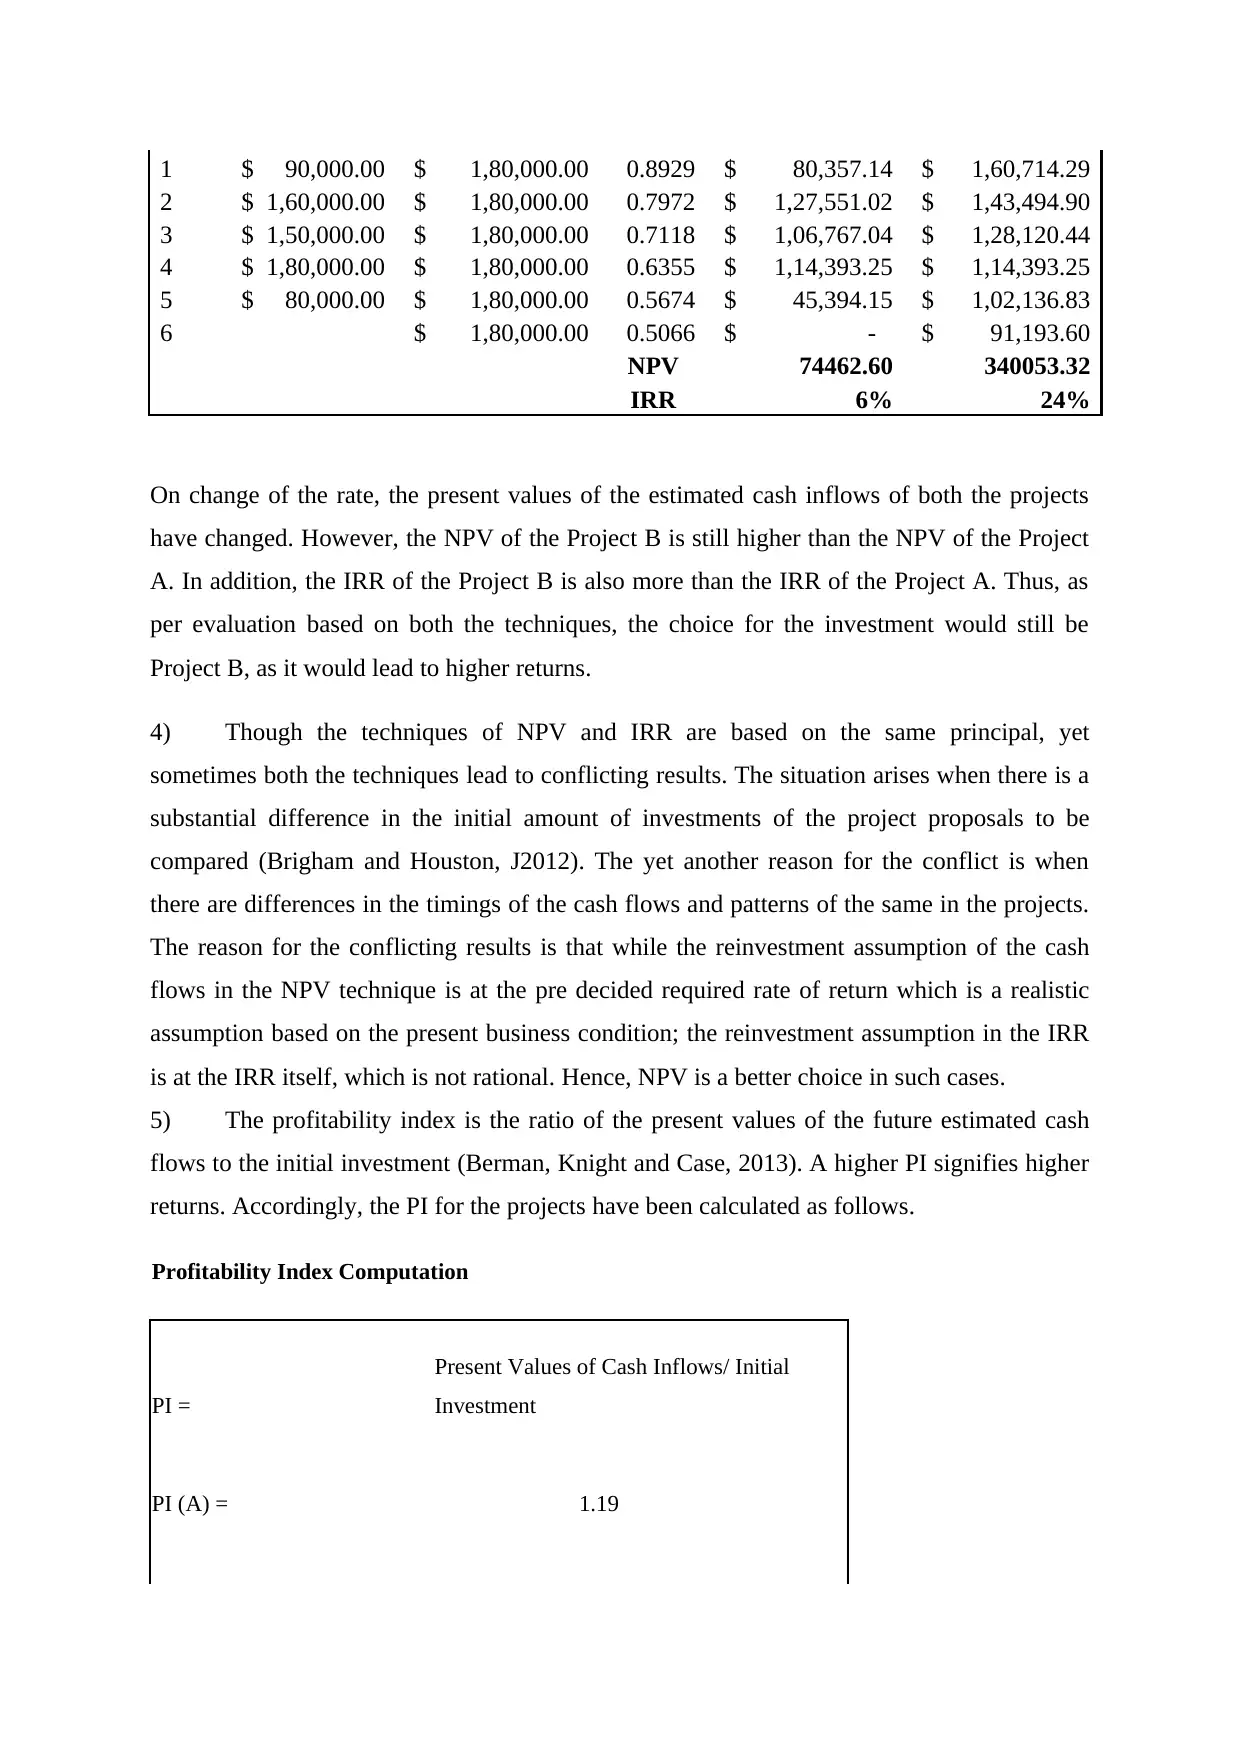
On change of the rate, the present values of the estimated cash inflows of both the projects
have changed. However, the NPV of the Project B is still higher than the NPV of the Project
A. In addition, the IRR of the Project B is also more than the IRR of the Project A. Thus, as
per evaluation based on both the techniques, the choice for the investment would still be
Project B, as it would lead to higher returns.
4) Though the techniques of NPV and IRR are based on the same principal, yet
sometimes both the techniques lead to conflicting results. The situation arises when there is a
substantial difference in the initial amount of investments of the project proposals to be
compared (Brigham and Houston, J2012). The yet another reason for the conflict is when
there are differences in the timings of the cash flows and patterns of the same in the projects.
The reason for the conflicting results is that while the reinvestment assumption of the cash
flows in the NPV technique is at the pre decided required rate of return which is a realistic
assumption based on the present business condition; the reinvestment assumption in the IRR
is at the IRR itself, which is not rational. Hence, NPV is a better choice in such cases.
5) The profitability index is the ratio of the present values of the future estimated cash
flows to the initial investment (Berman, Knight and Case, 2013). A higher PI signifies higher
returns. Accordingly, the PI for the projects have been calculated as follows.
Profitability Index Computation
PI =
Present Values of Cash Inflows/ Initial
Investment
PI (A) = 1.19
2 $ 1,60,000.00 $ 1,80,000.00 0.7972 $ 1,27,551.02 $ 1,43,494.90
3 $ 1,50,000.00 $ 1,80,000.00 0.7118 $ 1,06,767.04 $ 1,28,120.44
4 $ 1,80,000.00 $ 1,80,000.00 0.6355 $ 1,14,393.25 $ 1,14,393.25
5 $ 80,000.00 $ 1,80,000.00 0.5674 $ 45,394.15 $ 1,02,136.83
6 $ 1,80,000.00 0.5066 $ - $ 91,193.60
NPV 74462.60 340053.32
IRR 6% 24%
On change of the rate, the present values of the estimated cash inflows of both the projects
have changed. However, the NPV of the Project B is still higher than the NPV of the Project
A. In addition, the IRR of the Project B is also more than the IRR of the Project A. Thus, as
per evaluation based on both the techniques, the choice for the investment would still be
Project B, as it would lead to higher returns.
4) Though the techniques of NPV and IRR are based on the same principal, yet
sometimes both the techniques lead to conflicting results. The situation arises when there is a
substantial difference in the initial amount of investments of the project proposals to be
compared (Brigham and Houston, J2012). The yet another reason for the conflict is when
there are differences in the timings of the cash flows and patterns of the same in the projects.
The reason for the conflicting results is that while the reinvestment assumption of the cash
flows in the NPV technique is at the pre decided required rate of return which is a realistic
assumption based on the present business condition; the reinvestment assumption in the IRR
is at the IRR itself, which is not rational. Hence, NPV is a better choice in such cases.
5) The profitability index is the ratio of the present values of the future estimated cash
flows to the initial investment (Berman, Knight and Case, 2013). A higher PI signifies higher
returns. Accordingly, the PI for the projects have been calculated as follows.
Profitability Index Computation
PI =
Present Values of Cash Inflows/ Initial
Investment
PI (A) = 1.19
Paraphrase This Document
Need a fresh take? Get an instant paraphrase of this document with our AI Paraphraser
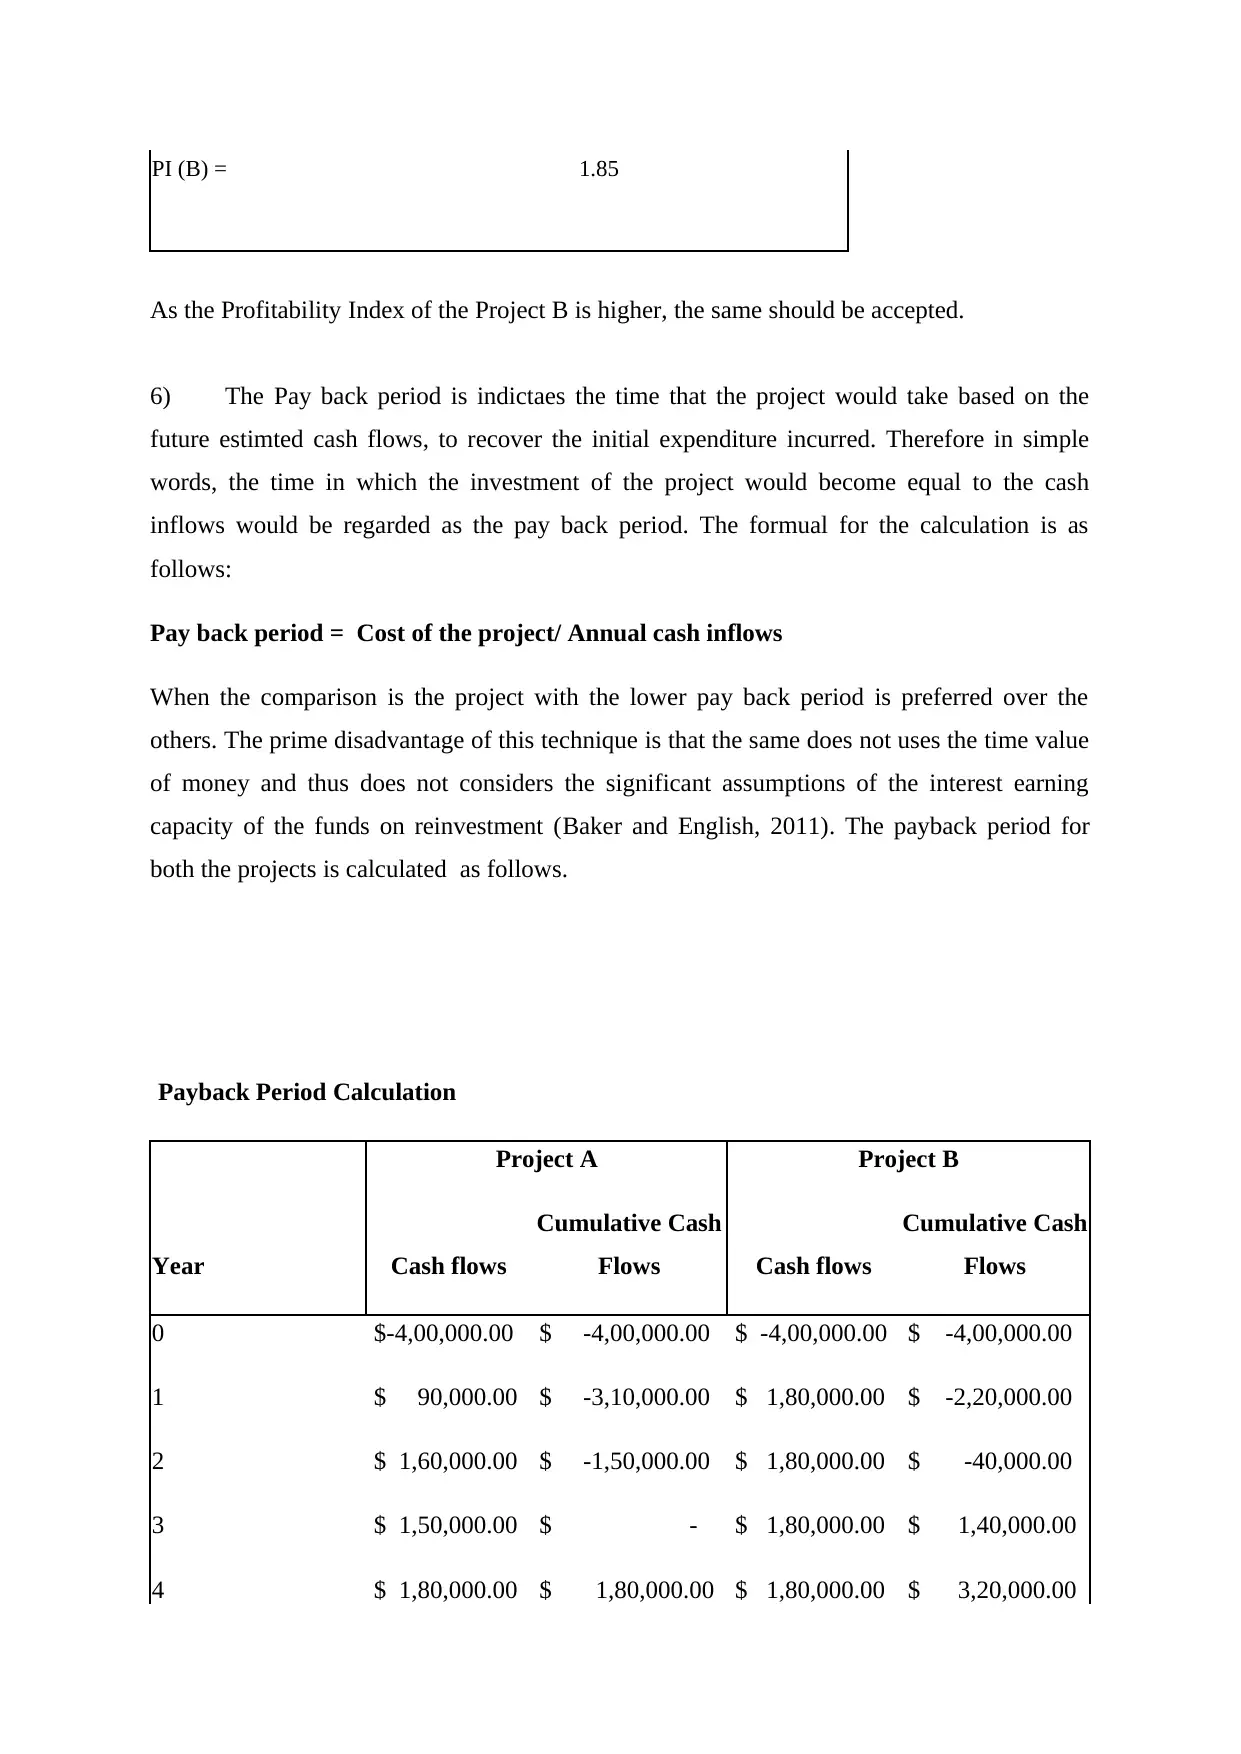
PI (B) = 1.85
As the Profitability Index of the Project B is higher, the same should be accepted.
6) The Pay back period is indictaes the time that the project would take based on the
future estimted cash flows, to recover the initial expenditure incurred. Therefore in simple
words, the time in which the investment of the project would become equal to the cash
inflows would be regarded as the pay back period. The formual for the calculation is as
follows:
Pay back period = Cost of the project/ Annual cash inflows
When the comparison is the project with the lower pay back period is preferred over the
others. The prime disadvantage of this technique is that the same does not uses the time value
of money and thus does not considers the significant assumptions of the interest earning
capacity of the funds on reinvestment (Baker and English, 2011). The payback period for
both the projects is calculated as follows.
Payback Period Calculation
Project A Project B
Year Cash flows
Cumulative Cash
Flows Cash flows
Cumulative Cash
Flows
0 $-4,00,000.00 $ -4,00,000.00 $ -4,00,000.00 $ -4,00,000.00
1 $ 90,000.00 $ -3,10,000.00 $ 1,80,000.00 $ -2,20,000.00
2 $ 1,60,000.00 $ -1,50,000.00 $ 1,80,000.00 $ -40,000.00
3 $ 1,50,000.00 $ - $ 1,80,000.00 $ 1,40,000.00
4 $ 1,80,000.00 $ 1,80,000.00 $ 1,80,000.00 $ 3,20,000.00
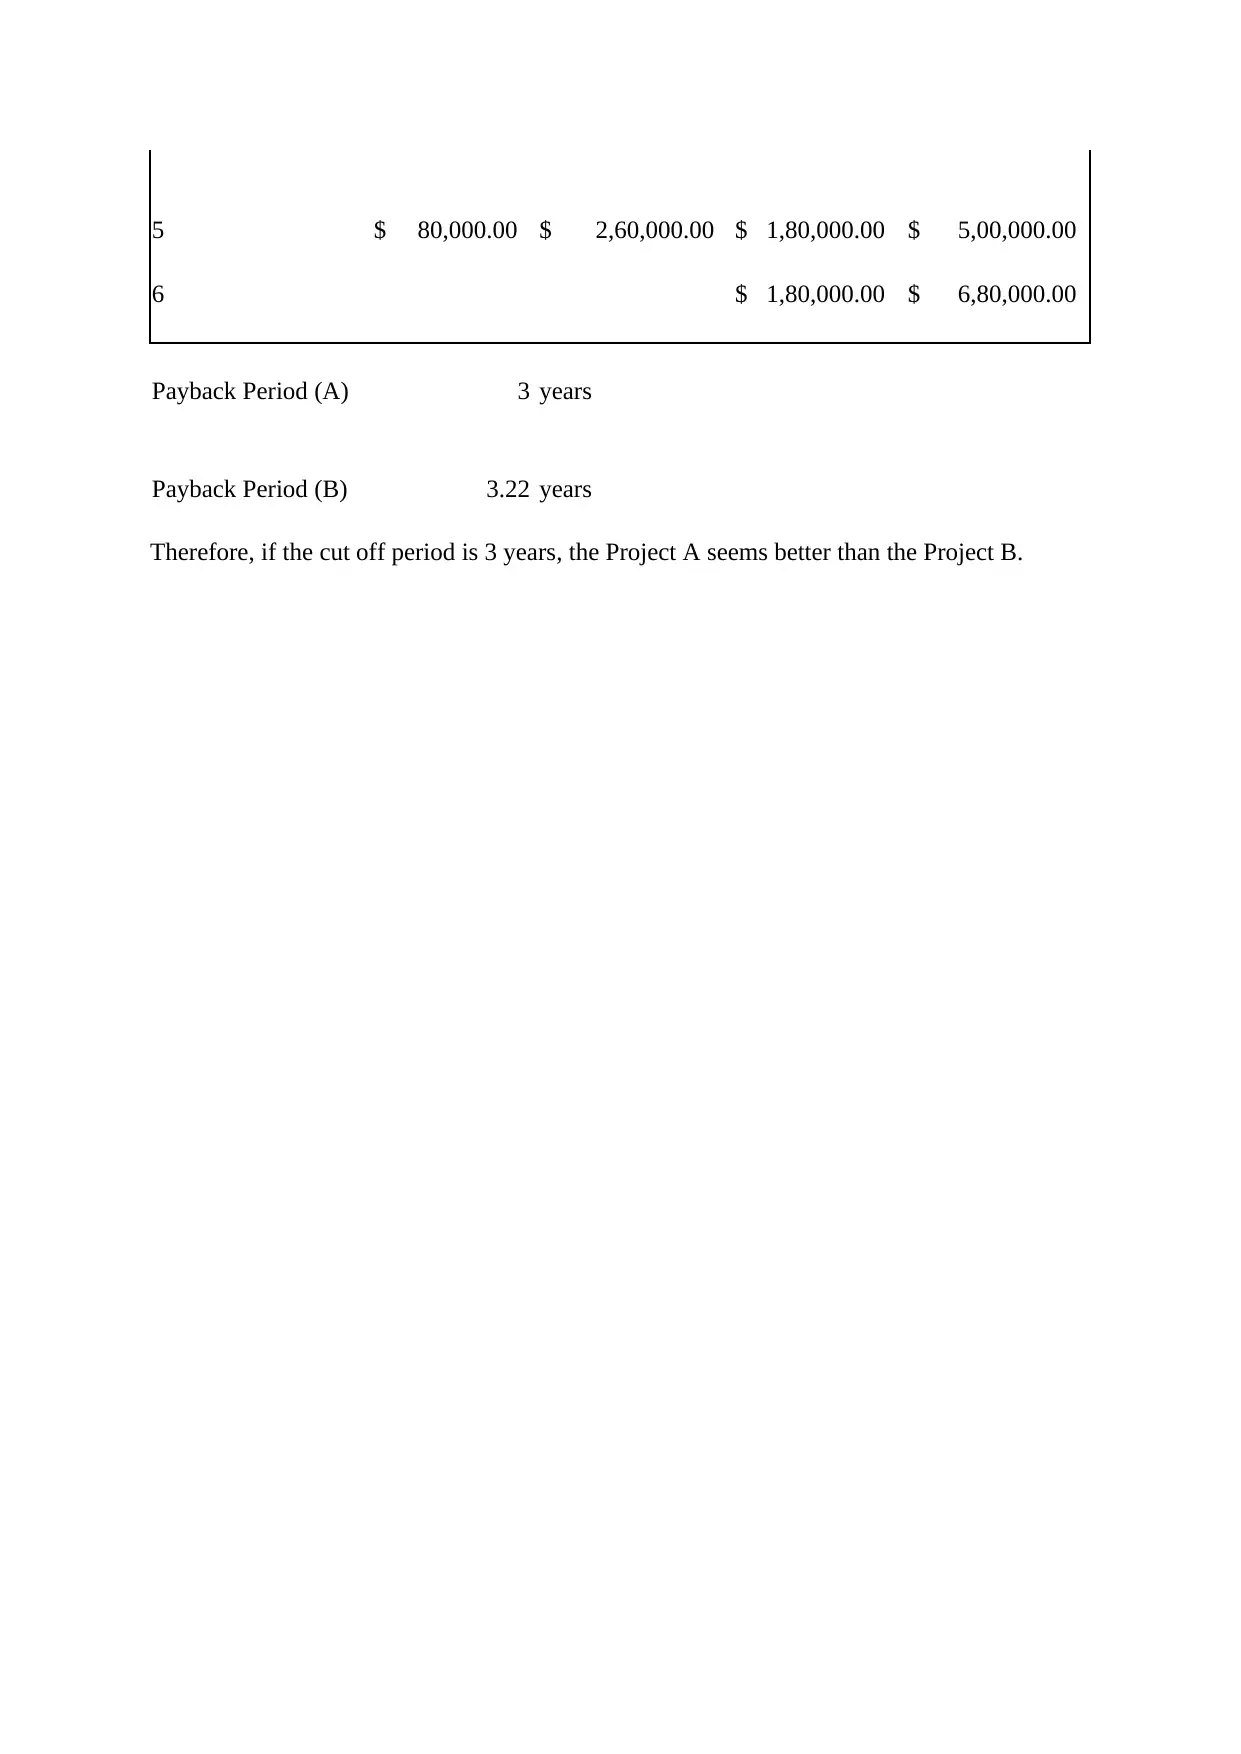
5 $ 80,000.00 $ 2,60,000.00 $ 1,80,000.00 $ 5,00,000.00
6 $ 1,80,000.00 $ 6,80,000.00
Payback Period (A) 3 years
Payback Period (B) 3.22 years
Therefore, if the cut off period is 3 years, the Project A seems better than the Project B.
6 $ 1,80,000.00 $ 6,80,000.00
Payback Period (A) 3 years
Payback Period (B) 3.22 years
Therefore, if the cut off period is 3 years, the Project A seems better than the Project B.
⊘ This is a preview!⊘
Do you want full access?
Subscribe today to unlock all pages.
Trusted by 1+ million students worldwide
References
Baker, H. K., and English, P. (2011) Capital Budgeting Valuation: Financial Analysis for
Today's Investment Projects. New Jersey: John Wiley & Sons Inc.
Barrett, R. (2019) ASX 200 Weekly | Westpac shares punished while Qantas rises again
billion [online] Available from: https://www.canstar.com.au/online-trading/asx-200-weekly-
25-nov-2019/ [Accessed on: 19 April 2020].
Berman, K., Knight. J., and Case, J. (2013) Financial Intelligence, Revised Edition: A
Manager's Guide to Knowing What the Numbers Really Mean. Boston: Harvard Business
Review Press, p. 212.
Bierman Jr, H., and Smidt, S. (2012) The capital budgeting decision: economic analysis of
investment projects. 9th ed. Oxon: Routledge.
Brigham, E. F., and Houston, J. F. (2012) Fundamentals of Financial Management. Boston
MA: Cengage Learning.
Business News Australia (2019) Westpac first half profit down $1 billion [online] Available
from: https://www.businessnewsaus.com.au/articles/westpac-first-half-profit-down--1-
billion.html [Accessed on: 19 April 2020].
Chau, D. (2020) Westpac expects $900 million penalty for breaching money laundering laws
[online] Available from: https://www.abc.net.au/news/2020-04-14/westpac-1.4-billion-hit-to-
first-half-earnings/12146360 [Accessed on: 19 April 2020].
Walton, S. (2020) $715m bailout triggers volatility among airline and travel stocks [online]
Available from: https://www.ig.com/au/news-and-trade-ideas/-715m-bailout-triggers-
volatility-among-airline-and-travel-stock-200318 [Accessed on: 19 April 2020].
Whyte, J. (2020) Momentum is turning for Qantas [online] Available from:
https://www.afr.com/wealth/personal-finance/momentum-is-turning-for-qantas-20190823-
p52k02 [Accessed on: 19 April 2020].
1 out of 10


Your All-in-One AI-Powered Toolkit for Academic Success.
+13062052269
info@desklib.com
Available 24*7 on WhatsApp / Email
![[object Object]](/_next/static/media/star-bottom.7253800d.svg)
Unlock your academic potential
Copyright © 2020–2026 A2Z Services. All Rights Reserved. Developed and managed by ZUCOL.