A Detailed Analysis of Executive Remuneration at QBE Insurance Company
VerifiedAdded on 2019/11/08
|6
|1266
|415
Report
AI Summary
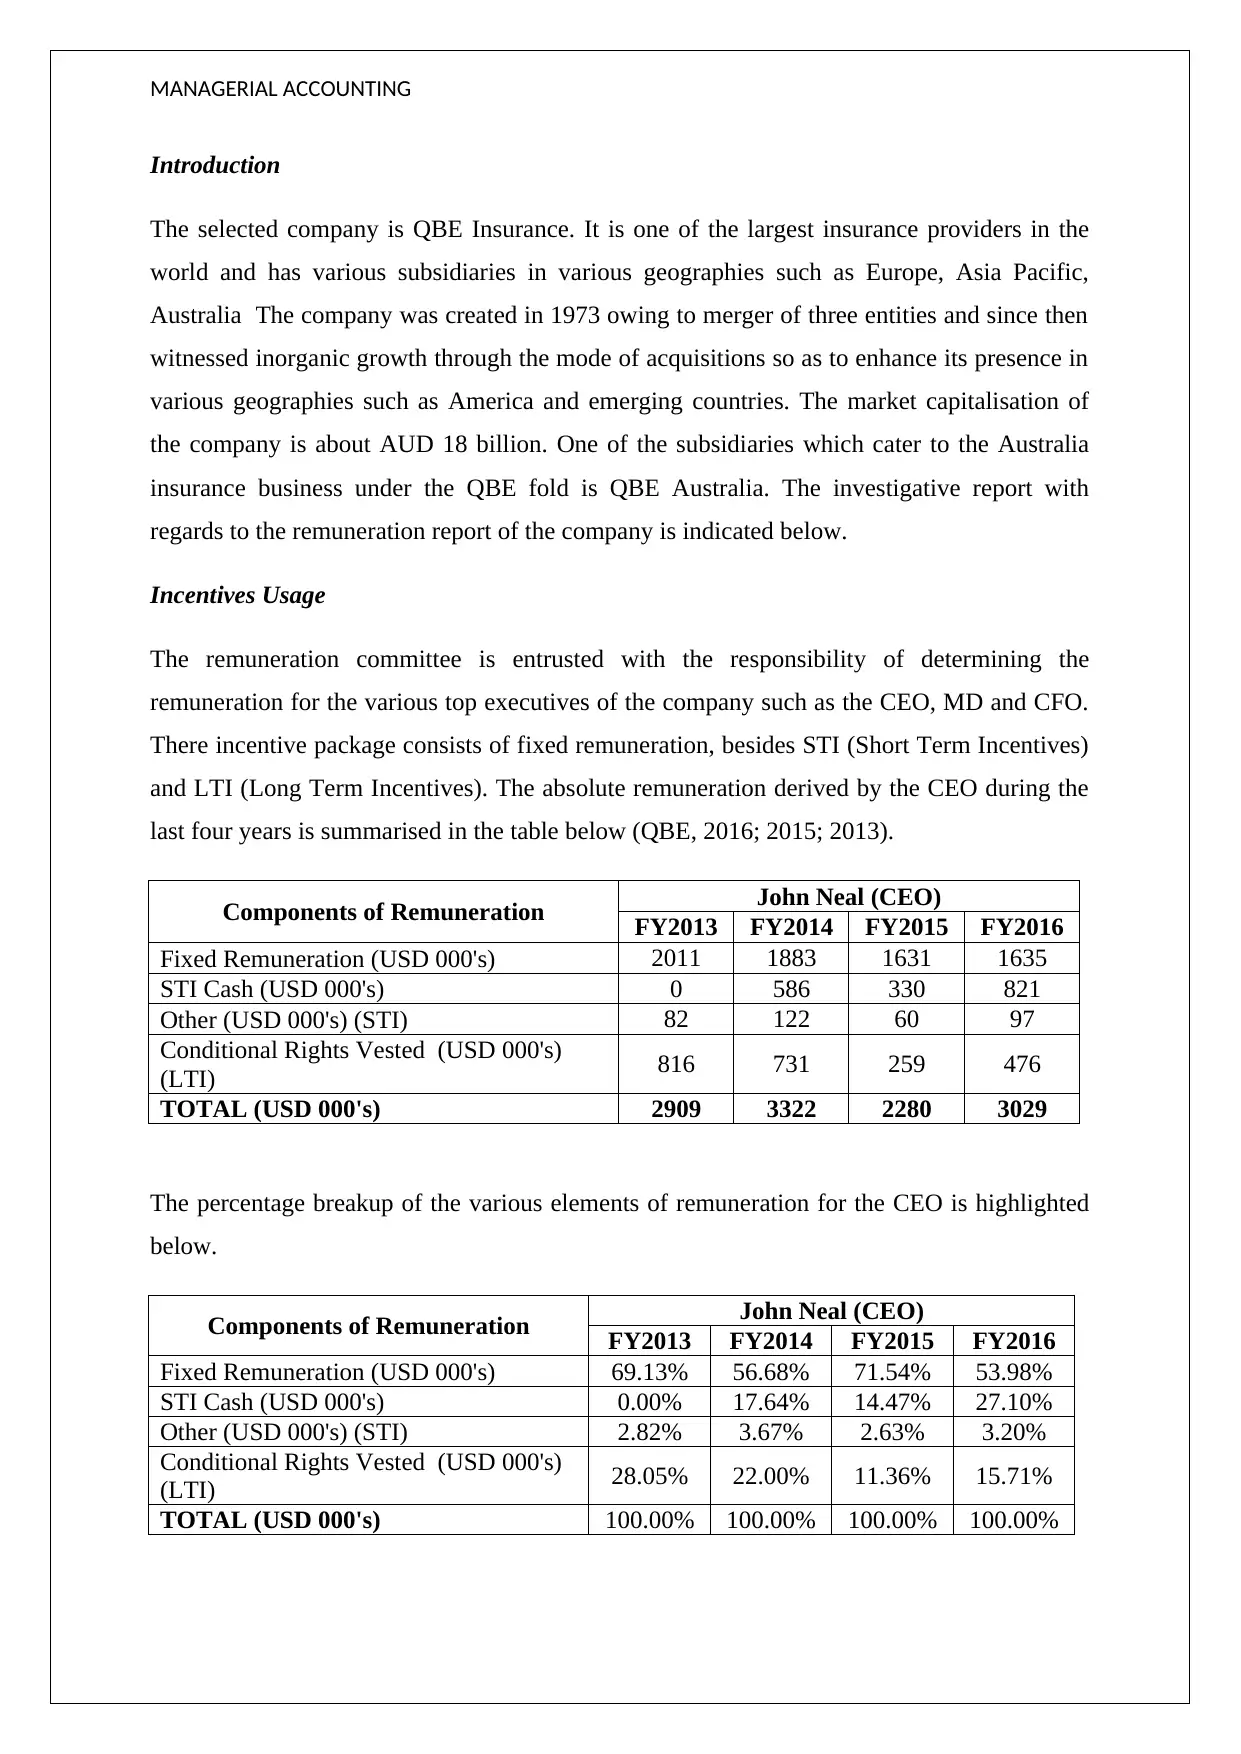
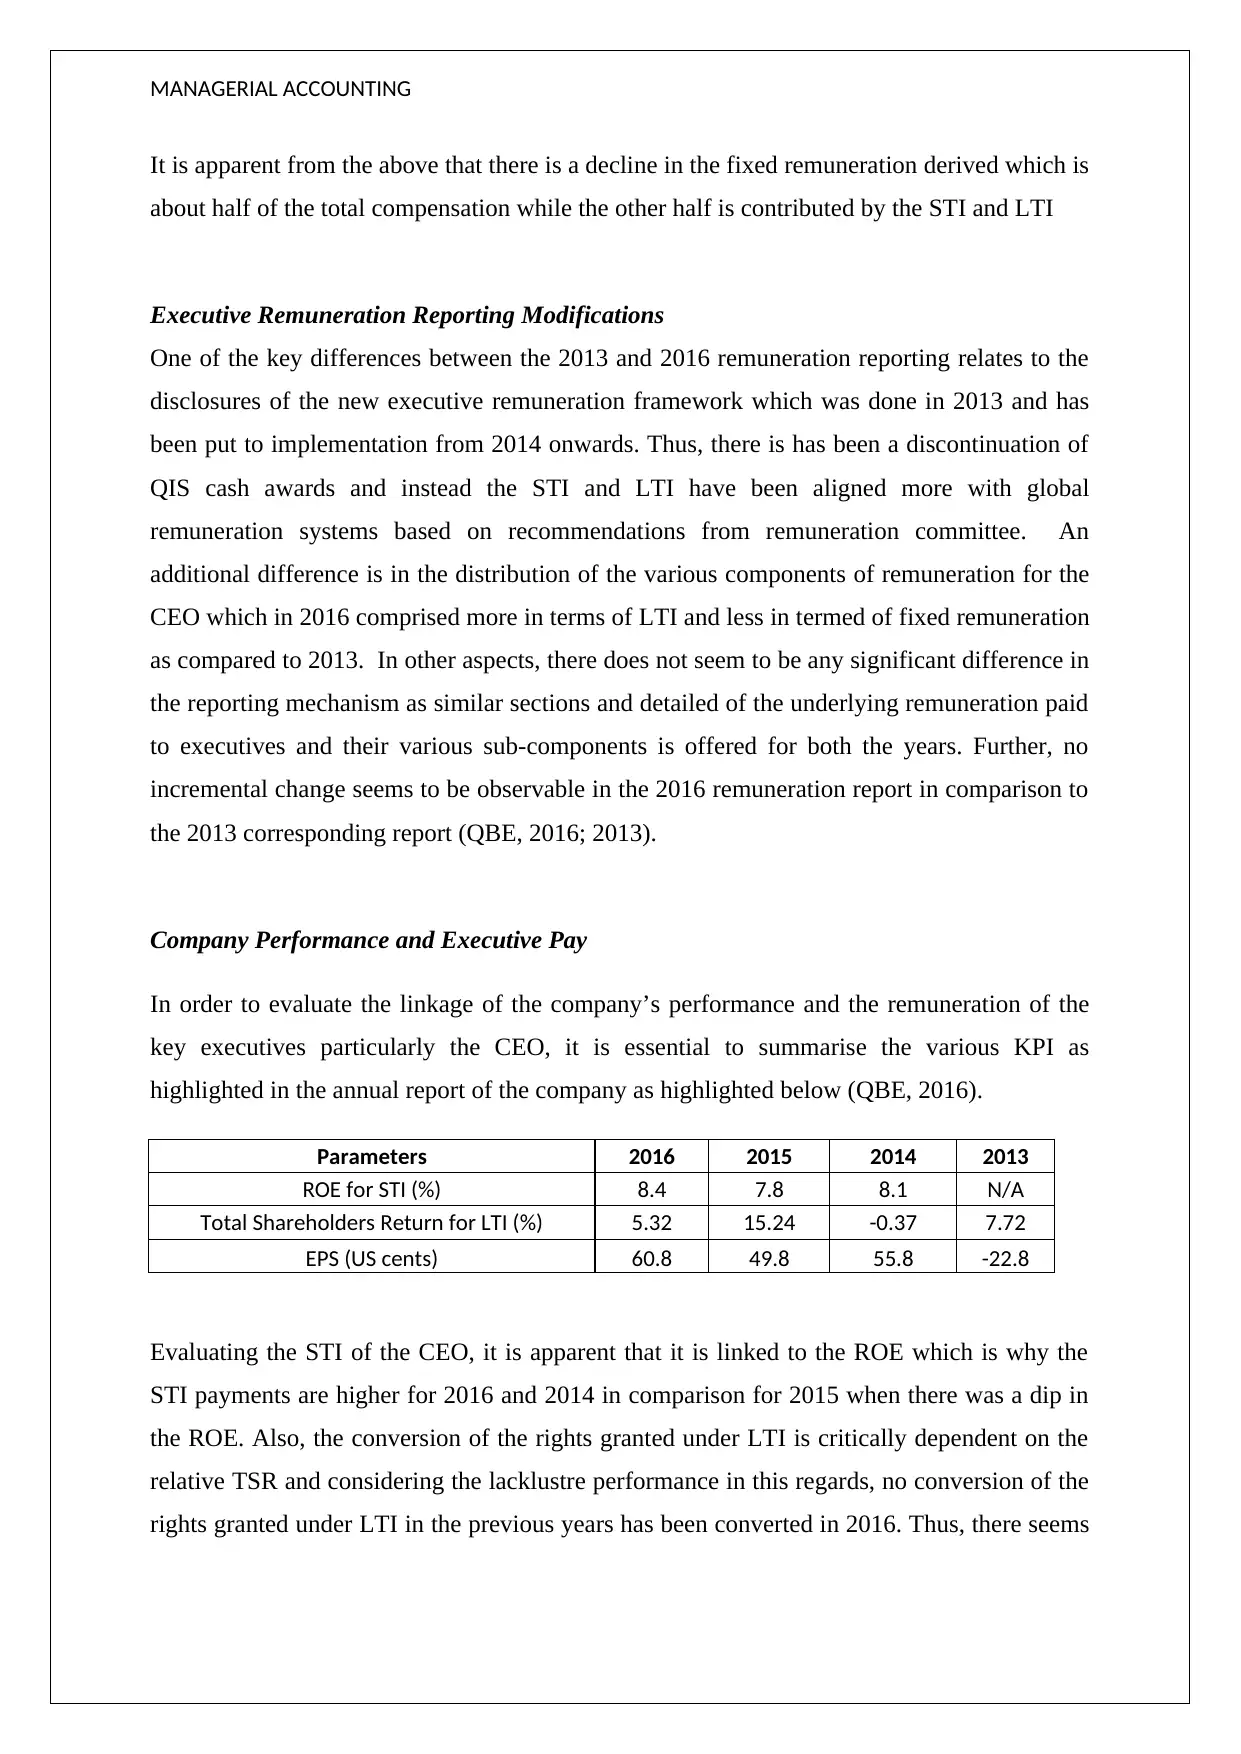
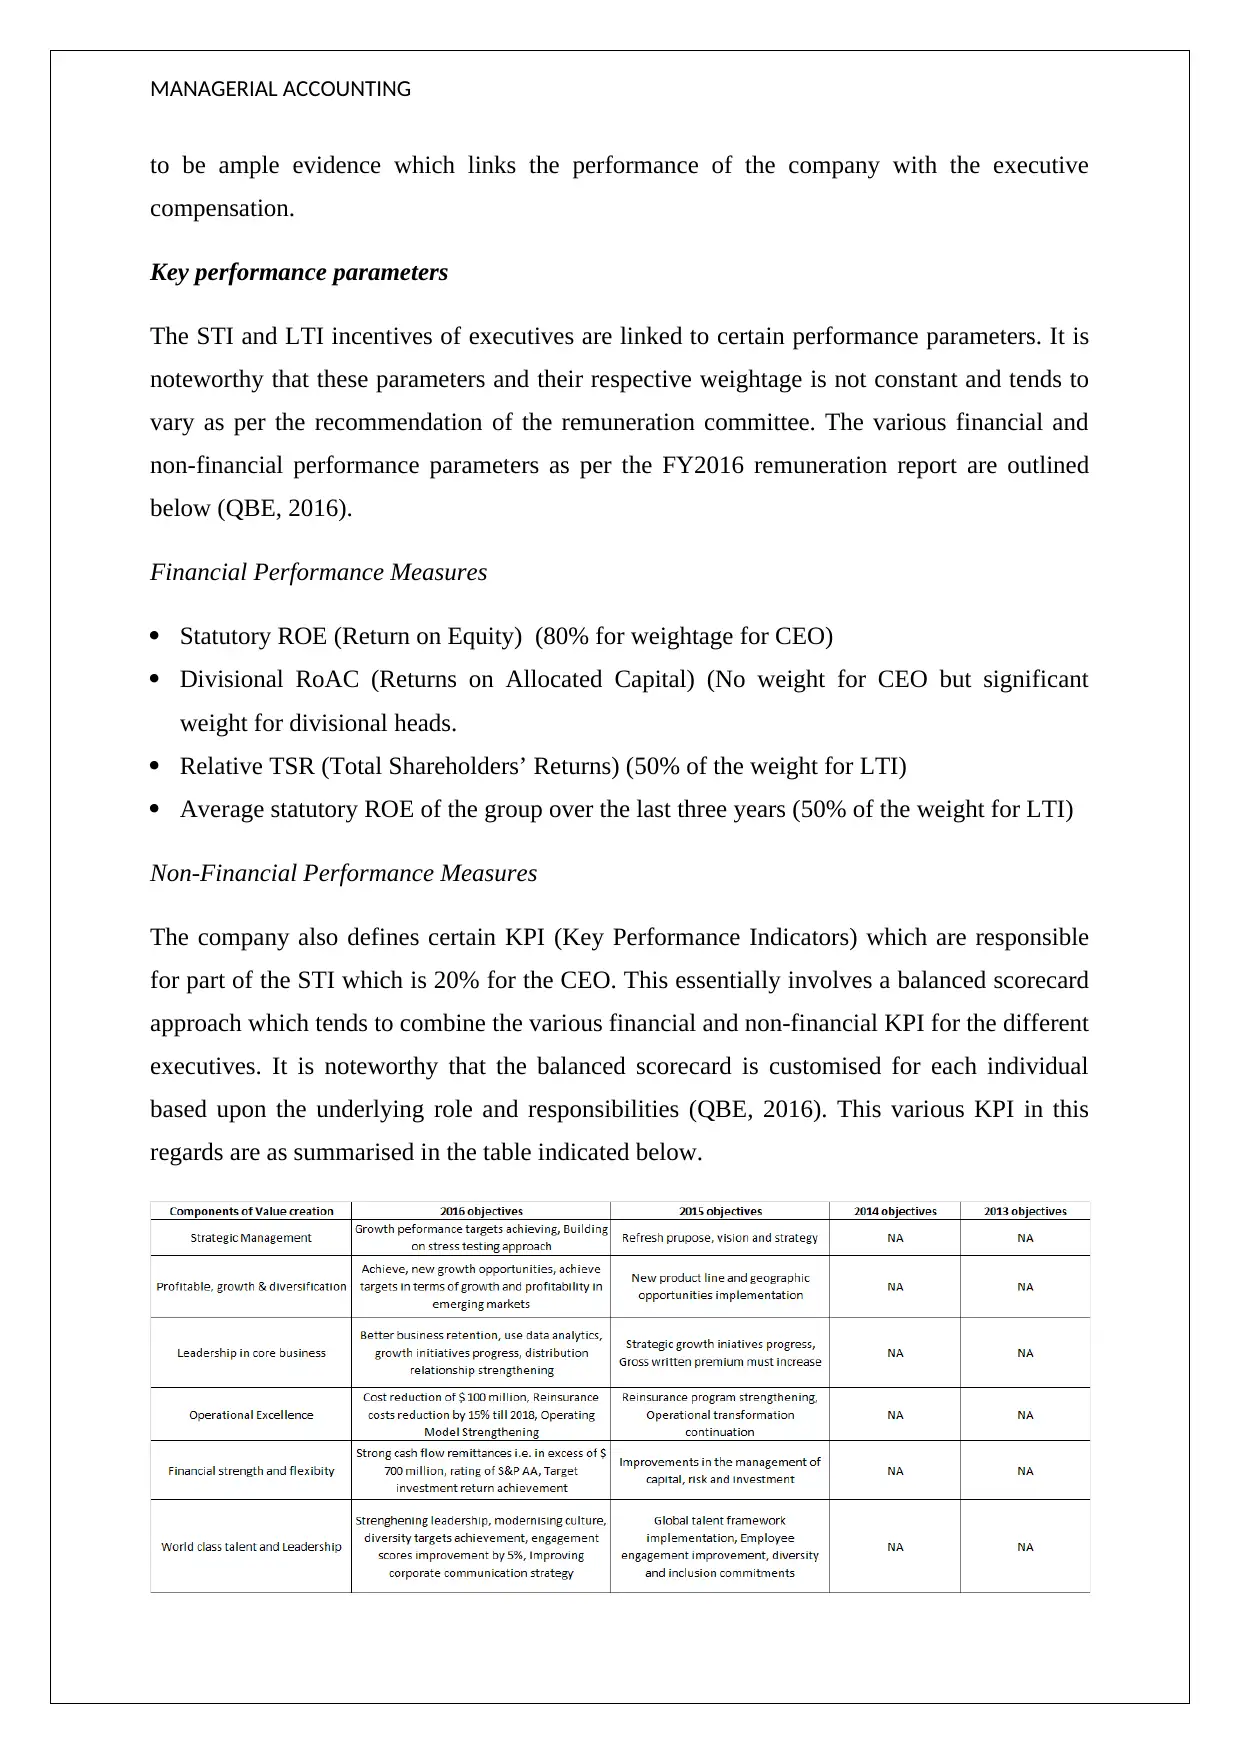
This report provides an in-depth analysis of the executive remuneration at QBE Insurance, focusing on the period from 2013 to 2016. It examines the components of the CEO's compensation, including fixed remuneration, Short-Term Incentives (STI), and Long-Term Incentives (LTI), and their respective percentages over the years. The report highlights the changes in the remuneration reporting framework, such as the introduction of a new executive remuneration framework and the alignment of STI and LTI with global systems. It also evaluates the linkage between the company's financial performance, measured by metrics like ROE and TSR, and the executive pay, demonstrating how STI and LTI are tied to specific performance parameters. The report also discusses the key performance indicators (KPIs), both financial and non-financial, used to determine executive incentives, and recommends increasing the weightage of the balanced scorecard for STI determination to incentivize management to focus on shareholder wealth creation. References to QBE's annual reports from 2013, 2014, and 2016 are provided.

MANAGERIAL ACCOUNTING
STUDENT ID:
[Pick the date]
STUDENT ID:
[Pick the date]
Paraphrase This Document
Need a fresh take? Get an instant paraphrase of this document with our AI Paraphraser

MANAGERIAL ACCOUNTING
Introduction
The selected company is QBE Insurance. It is one of the largest insurance providers in the
world and has various subsidiaries in various geographies such as Europe, Asia Pacific,
Australia The company was created in 1973 owing to merger of three entities and since then
witnessed inorganic growth through the mode of acquisitions so as to enhance its presence in
various geographies such as America and emerging countries. The market capitalisation of
the company is about AUD 18 billion. One of the subsidiaries which cater to the Australia
insurance business under the QBE fold is QBE Australia. The investigative report with
regards to the remuneration report of the company is indicated below.
Incentives Usage
The remuneration committee is entrusted with the responsibility of determining the
remuneration for the various top executives of the company such as the CEO, MD and CFO.
There incentive package consists of fixed remuneration, besides STI (Short Term Incentives)
and LTI (Long Term Incentives). The absolute remuneration derived by the CEO during the
last four years is summarised in the table below (QBE, 2016; 2015; 2013).
Components of Remuneration John Neal (CEO)
FY2013 FY2014 FY2015 FY2016
Fixed Remuneration (USD 000's) 2011 1883 1631 1635
STI Cash (USD 000's) 0 586 330 821
Other (USD 000's) (STI) 82 122 60 97
Conditional Rights Vested (USD 000's)
(LTI) 816 731 259 476
TOTAL (USD 000's) 2909 3322 2280 3029
The percentage breakup of the various elements of remuneration for the CEO is highlighted
below.
Components of Remuneration John Neal (CEO)
FY2013 FY2014 FY2015 FY2016
Fixed Remuneration (USD 000's) 69.13% 56.68% 71.54% 53.98%
STI Cash (USD 000's) 0.00% 17.64% 14.47% 27.10%
Other (USD 000's) (STI) 2.82% 3.67% 2.63% 3.20%
Conditional Rights Vested (USD 000's)
(LTI) 28.05% 22.00% 11.36% 15.71%
TOTAL (USD 000's) 100.00% 100.00% 100.00% 100.00%

MANAGERIAL ACCOUNTING
It is apparent from the above that there is a decline in the fixed remuneration derived which is
about half of the total compensation while the other half is contributed by the STI and LTI
Executive Remuneration Reporting Modifications
One of the key differences between the 2013 and 2016 remuneration reporting relates to the
disclosures of the new executive remuneration framework which was done in 2013 and has
been put to implementation from 2014 onwards. Thus, there is has been a discontinuation of
QIS cash awards and instead the STI and LTI have been aligned more with global
remuneration systems based on recommendations from remuneration committee. An
additional difference is in the distribution of the various components of remuneration for the
CEO which in 2016 comprised more in terms of LTI and less in termed of fixed remuneration
as compared to 2013. In other aspects, there does not seem to be any significant difference in
the reporting mechanism as similar sections and detailed of the underlying remuneration paid
to executives and their various sub-components is offered for both the years. Further, no
incremental change seems to be observable in the 2016 remuneration report in comparison to
the 2013 corresponding report (QBE, 2016; 2013).
Company Performance and Executive Pay
In order to evaluate the linkage of the company’s performance and the remuneration of the
key executives particularly the CEO, it is essential to summarise the various KPI as
highlighted in the annual report of the company as highlighted below (QBE, 2016).
Parameters 2016 2015 2014 2013
ROE for STI (%) 8.4 7.8 8.1 N/A
Total Shareholders Return for LTI (%) 5.32 15.24 -0.37 7.72
EPS (US cents) 60.8 49.8 55.8 -22.8
Evaluating the STI of the CEO, it is apparent that it is linked to the ROE which is why the
STI payments are higher for 2016 and 2014 in comparison for 2015 when there was a dip in
the ROE. Also, the conversion of the rights granted under LTI is critically dependent on the
relative TSR and considering the lacklustre performance in this regards, no conversion of the
rights granted under LTI in the previous years has been converted in 2016. Thus, there seems
⊘ This is a preview!⊘
Do you want full access?
Subscribe today to unlock all pages.

Trusted by 1+ million students worldwide

MANAGERIAL ACCOUNTING
to be ample evidence which links the performance of the company with the executive
compensation.
Key performance parameters
The STI and LTI incentives of executives are linked to certain performance parameters. It is
noteworthy that these parameters and their respective weightage is not constant and tends to
vary as per the recommendation of the remuneration committee. The various financial and
non-financial performance parameters as per the FY2016 remuneration report are outlined
below (QBE, 2016).
Financial Performance Measures
Statutory ROE (Return on Equity) (80% for weightage for CEO)
Divisional RoAC (Returns on Allocated Capital) (No weight for CEO but significant
weight for divisional heads.
Relative TSR (Total Shareholders’ Returns) (50% of the weight for LTI)
Average statutory ROE of the group over the last three years (50% of the weight for LTI)
Non-Financial Performance Measures
The company also defines certain KPI (Key Performance Indicators) which are responsible
for part of the STI which is 20% for the CEO. This essentially involves a balanced scorecard
approach which tends to combine the various financial and non-financial KPI for the different
executives. It is noteworthy that the balanced scorecard is customised for each individual
based upon the underlying role and responsibilities (QBE, 2016). This various KPI in this
regards are as summarised in the table indicated below.
Paraphrase This Document
Need a fresh take? Get an instant paraphrase of this document with our AI Paraphraser

MANAGERIAL ACCOUNTING
It is noteworthy that the balanced scorecard has been introduced from FY2015 onwards. It is
evident from above that major emphasis is paid on the financial performance only especially
the ROE while the non-financial performance parameters have limited weightage only.
Recommendation
On the basic of the above analysis, it is apparent that from FY2013 to FY2016, the
remuneration reporting has seen some positive changes with regards to the new remuneration
framework with the use of balanced scorecard. However, it may be recommended that the
weightage on the balanced scorecard should be increased especially with regards to
determination of STI. This would ensure that the management is provided with the requisite
incentive so as to focus on creation of shareholders’ wealth rather than focus on the financial
metrics alone.

MANAGERIAL ACCOUNTING
References
QBE (2016), Annual Report 2016, QBE Website, [online] Available at
https://www.group.qbe.com/sites/default/files/Default%20Media/QBE_2016_Annual_Report
.pdf [Accessed September 14, 2017]
QBE (2014), Annual Report 2014, QBE Website, [online] Available at
https://www.group.qbe.com/sites/default/files/Default%20Media/QBE_AR14_Full_report.pd
f [Accessed September 14, 2017]
QBE (2013), Annual Report 2013, QBE Website, [online] Available at
https://www.group.qbe.com/sites/default/files/Default%20Media/FY13%20Annual
%20Report.pdf [Accessed September 14, 2017]
⊘ This is a preview!⊘
Do you want full access?
Subscribe today to unlock all pages.

Trusted by 1+ million students worldwide
1 out of 6

Your All-in-One AI-Powered Toolkit for Academic Success.
+13062052269
info@desklib.com
Available 24*7 on WhatsApp / Email
Unlock your academic potential
Copyright © 2020–2025 A2Z Services. All Rights Reserved. Developed and managed by ZUCOL.