Analysis of QBE Insurance and NRMA Insurance: Financial Performance
VerifiedAdded on 2021/05/31
|19
|4596
|233
Report
AI Summary
This report presents a comparative financial performance analysis of QBE Insurance and NRMA Insurance, two prominent Australian listed companies. The analysis employs financial ratio analysis, evaluating key metrics across liquidity, long-term solvency, asset utilization, profitability, and market value ratios. The report assesses current and quick ratios to gauge short-term debt-paying ability, debt and debt-to-equity ratios for solvency, and inventory and accounts receivable turnover for asset efficiency. Profitability is assessed through interest coverage. The report culminates in a recommendation for potential investors based on the comparative financial strengths and weaknesses revealed through the ratio analysis, providing insights into which company offers a more favorable investment opportunity. The findings indicate that NRMA has performed better than QBE in terms of financial stability.
Analysis QBE Insurance And NRMA Insurance 1
ANALYSIS QBE INSURANCE AND NRMA INSURANCE
Author
Course Title
Professor
City
Date
ANALYSIS QBE INSURANCE AND NRMA INSURANCE
Author
Course Title
Professor
City
Date
Paraphrase This Document
Need a fresh take? Get an instant paraphrase of this document with our AI Paraphraser
Analysis QBE Insurance And NRMA Insurance 2
Table of Content
Introduction...........................................................................................................................................3
Overview of the Companies..............................................................................................................3
Financial Ratio Analysis of QBE Insurance and NRMA Insurance.......................................................3
Liquidity Ratios.................................................................................................................................4
Long-Term Solvency.........................................................................................................................6
Asset Utilization................................................................................................................................9
Profitability Ratios...........................................................................................................................10
Market Value Ratios........................................................................................................................13
Conclusion...........................................................................................................................................16
Recommendation.................................................................................................................................16
Reference Lists....................................................................................................................................17
Analysis QBE Insurance And NRMA Insurance 3
Introduction
The report aims to present financial performance analysis of two Australian listed companies.
It presents comparison of the two companies and provides recommendation to different
potential investors on which of the two firms is more superior to the other. With these
considerations, the report would present comparison of the financial performance of QBE
Insurance and NRMA Insurance in order to provided recommendation on which between the
two firms offer the best investment opportunity for potential investors. The comparison
would be based on financial ratio analysis of the two companies where the company with
favourable ratios is considered to offer the best investment opportunity.
Overview of the Companies
QBE insurance is one of the Australian largest insurers across the world. It offers insurance
services mostly to the America, Asia Pacific, Australia and Europe region. The company has
over 14,226 staffs working across 37 nations across the globe. The company was ranked as
the top general insurers in 2012 (QBE Insurance 2017). On the other hand, NRMA insurance
is the largest non-government contents and home insurers. It is the most diversified
insurance companies operating throughout Asia, New Zealand and Australia. The company
has continued to focus on its strategic intent of creating portfolio of customer-focused, high
performing as well as diverse operations which offer general insurance in a way that delivers
superior experience for its stockholders as well as create value for its shareholders (NRMA
Insurance 2017). In other words, NRMA Insurance is one of the Australian firms providing
roadside assistance, car servicing, motoring advice, travel, international driving permits as
well as other insurance services in Australian Capital Territory and New South Wales. The
NRMA Insurance makes the car insurance easier with broad range of numerous levels of the
insurance cover.
Financial Ratio Analysis of QBE Insurance and NRMA Insurance
⊘ This is a preview!⊘
Do you want full access?
Subscribe today to unlock all pages.
Trusted by 1+ million students worldwide
Analysis QBE Insurance And NRMA Insurance 4
Ratio analysis entails relationship which are determined from an organization’s financial data
and utilized for comparison purposes (Beaver, Correia and McNichols 2011). Besides, ratio
analysis give or offer small business operators with valuable tools used in measuring an
organization’s progress against the predetermined internal objectives, the overall sector or
specific competitor. Additionally, ratio analysis is a powerful tool in identifying the financial
trends in its early levels. Ratios are also utilized by investors, business analysts and bankers
in evaluating and examining an organization’s financial status (Megginson and Smart 2008).
They also enable business operators to assess relationship between different financial items
and examine that relationship. They are usually simple to compute, easy to utilize and offer
business operators with some insights into what has been happening in the firm, insights
which are not mostly apparent upon the review of financial information alone. Ratio analysis
could assist in pinpointing some of the areas that require greater attention before looming
issues in the area is readily visible.
Liquidity Ratios
These ratios usually demonstrate an organization’s capacity in settling all its current debt
commitments. They usually relate to availability of money as well as other liquid assets
available in covering short-term debts, account payables as well as other current liabilities
(Delen, Kuzey and Uyar 2013). Different organizations need specific level of the liquidity in
settling their bills, although the start-up and existing by young firms are usually not very
liquid in terms of their assets. In mature firms, low liquidity shoes poor management or need
for extra capital. As such liquidity ratios are crucial in providing business operators or
managers with important limits to assist them regulate spending and borrowing (Velnampy
and Niresh 2012). In this case, some of the best measures in evaluating financial liquidity of
the two companies include current ratio, cash to assets ratio as well as quick ratio.
Current ratio
Paraphrase This Document
Need a fresh take? Get an instant paraphrase of this document with our AI Paraphraser
Analysis QBE Insurance And NRMA Insurance 5
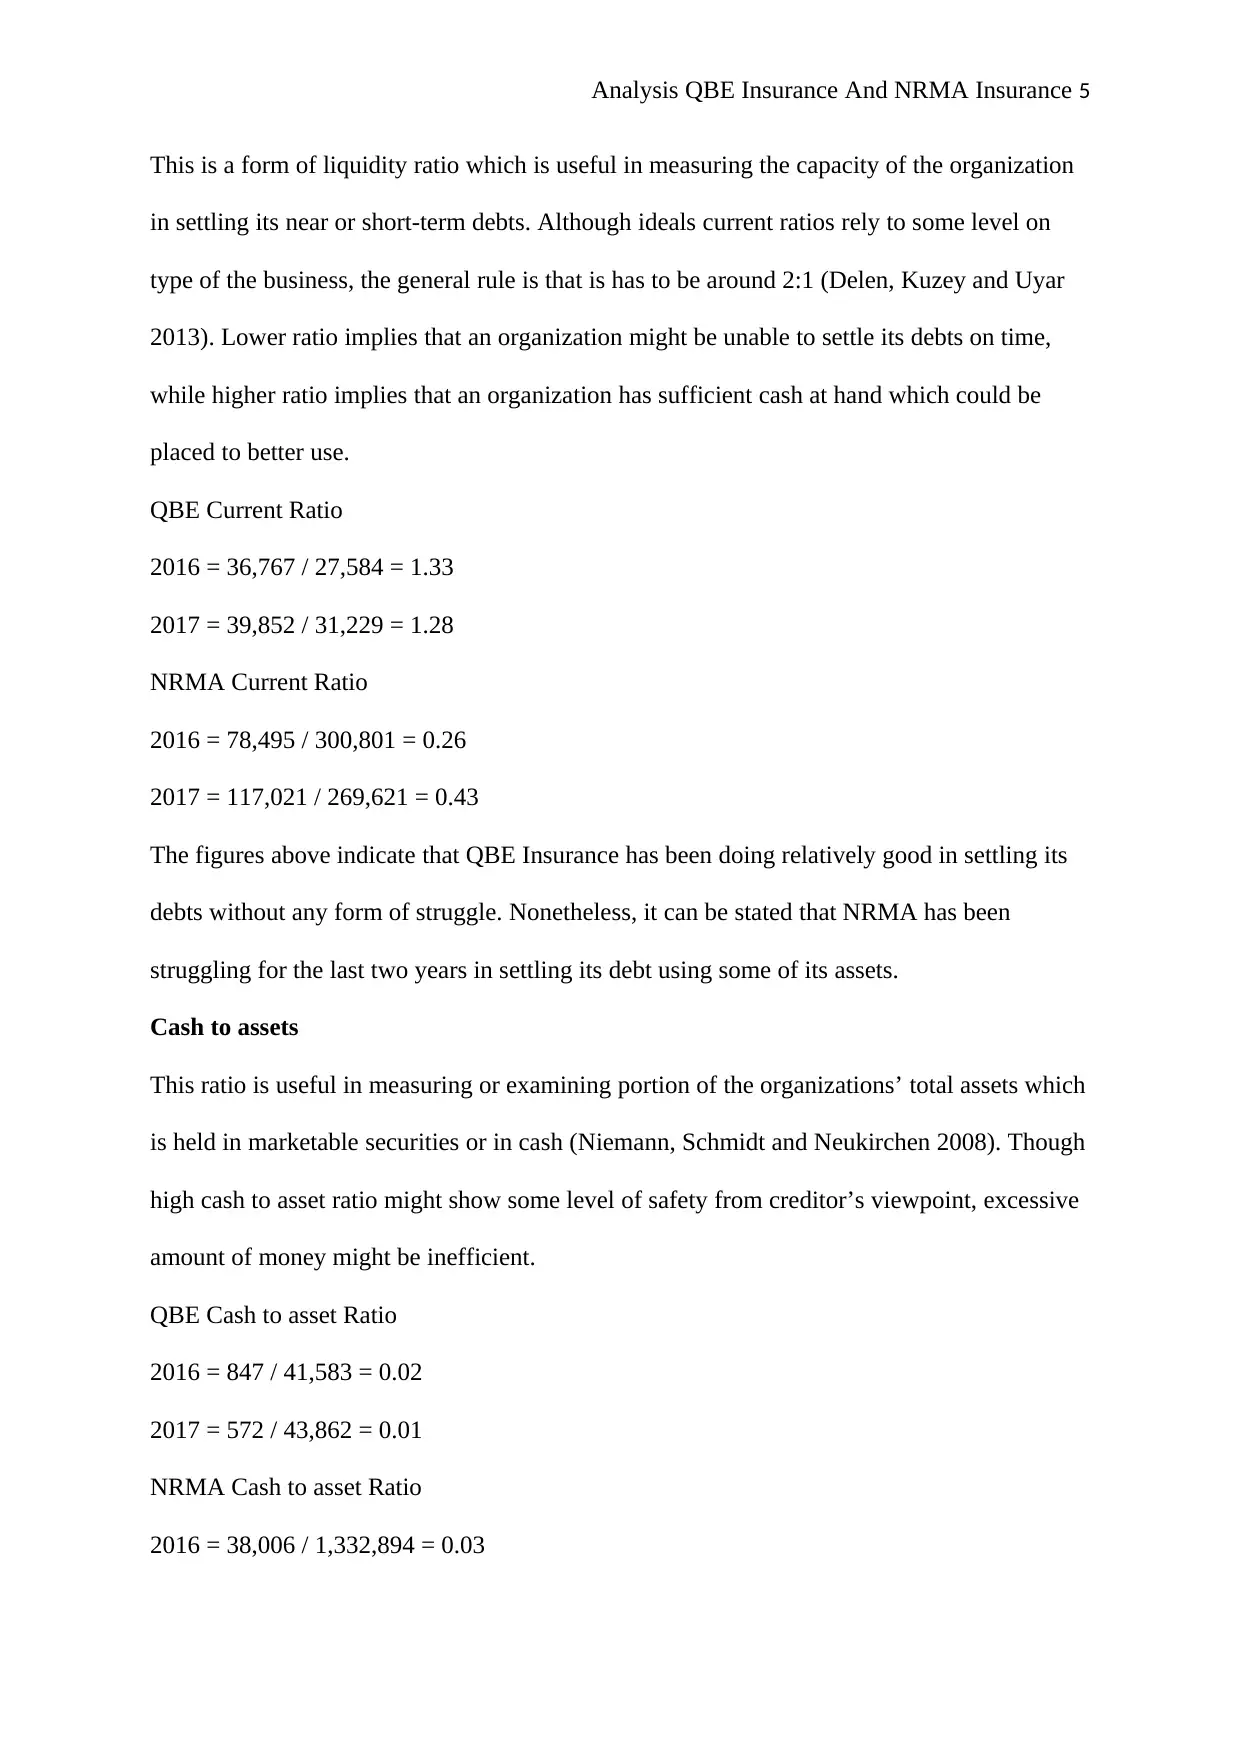
This is a form of liquidity ratio which is useful in measuring the capacity of the organization
in settling its near or short-term debts. Although ideals current ratios rely to some level on
type of the business, the general rule is that is has to be around 2:1 (Delen, Kuzey and Uyar
2013). Lower ratio implies that an organization might be unable to settle its debts on time,
while higher ratio implies that an organization has sufficient cash at hand which could be
placed to better use.
QBE Current Ratio
2016 = 36,767 / 27,584 = 1.33
2017 = 39,852 / 31,229 = 1.28
NRMA Current Ratio
2016 = 78,495 / 300,801 = 0.26
2017 = 117,021 / 269,621 = 0.43
The figures above indicate that QBE Insurance has been doing relatively good in settling its
debts without any form of struggle. Nonetheless, it can be stated that NRMA has been
struggling for the last two years in settling its debt using some of its assets.
Cash to assets
This ratio is useful in measuring or examining portion of the organizations’ total assets which
is held in marketable securities or in cash (Niemann, Schmidt and Neukirchen 2008). Though
high cash to asset ratio might show some level of safety from creditor’s viewpoint, excessive
amount of money might be inefficient.
QBE Cash to asset Ratio
2016 = 847 / 41,583 = 0.02
2017 = 572 / 43,862 = 0.01
NRMA Cash to asset Ratio
2016 = 38,006 / 1,332,894 = 0.03
Analysis QBE Insurance And NRMA Insurance 6
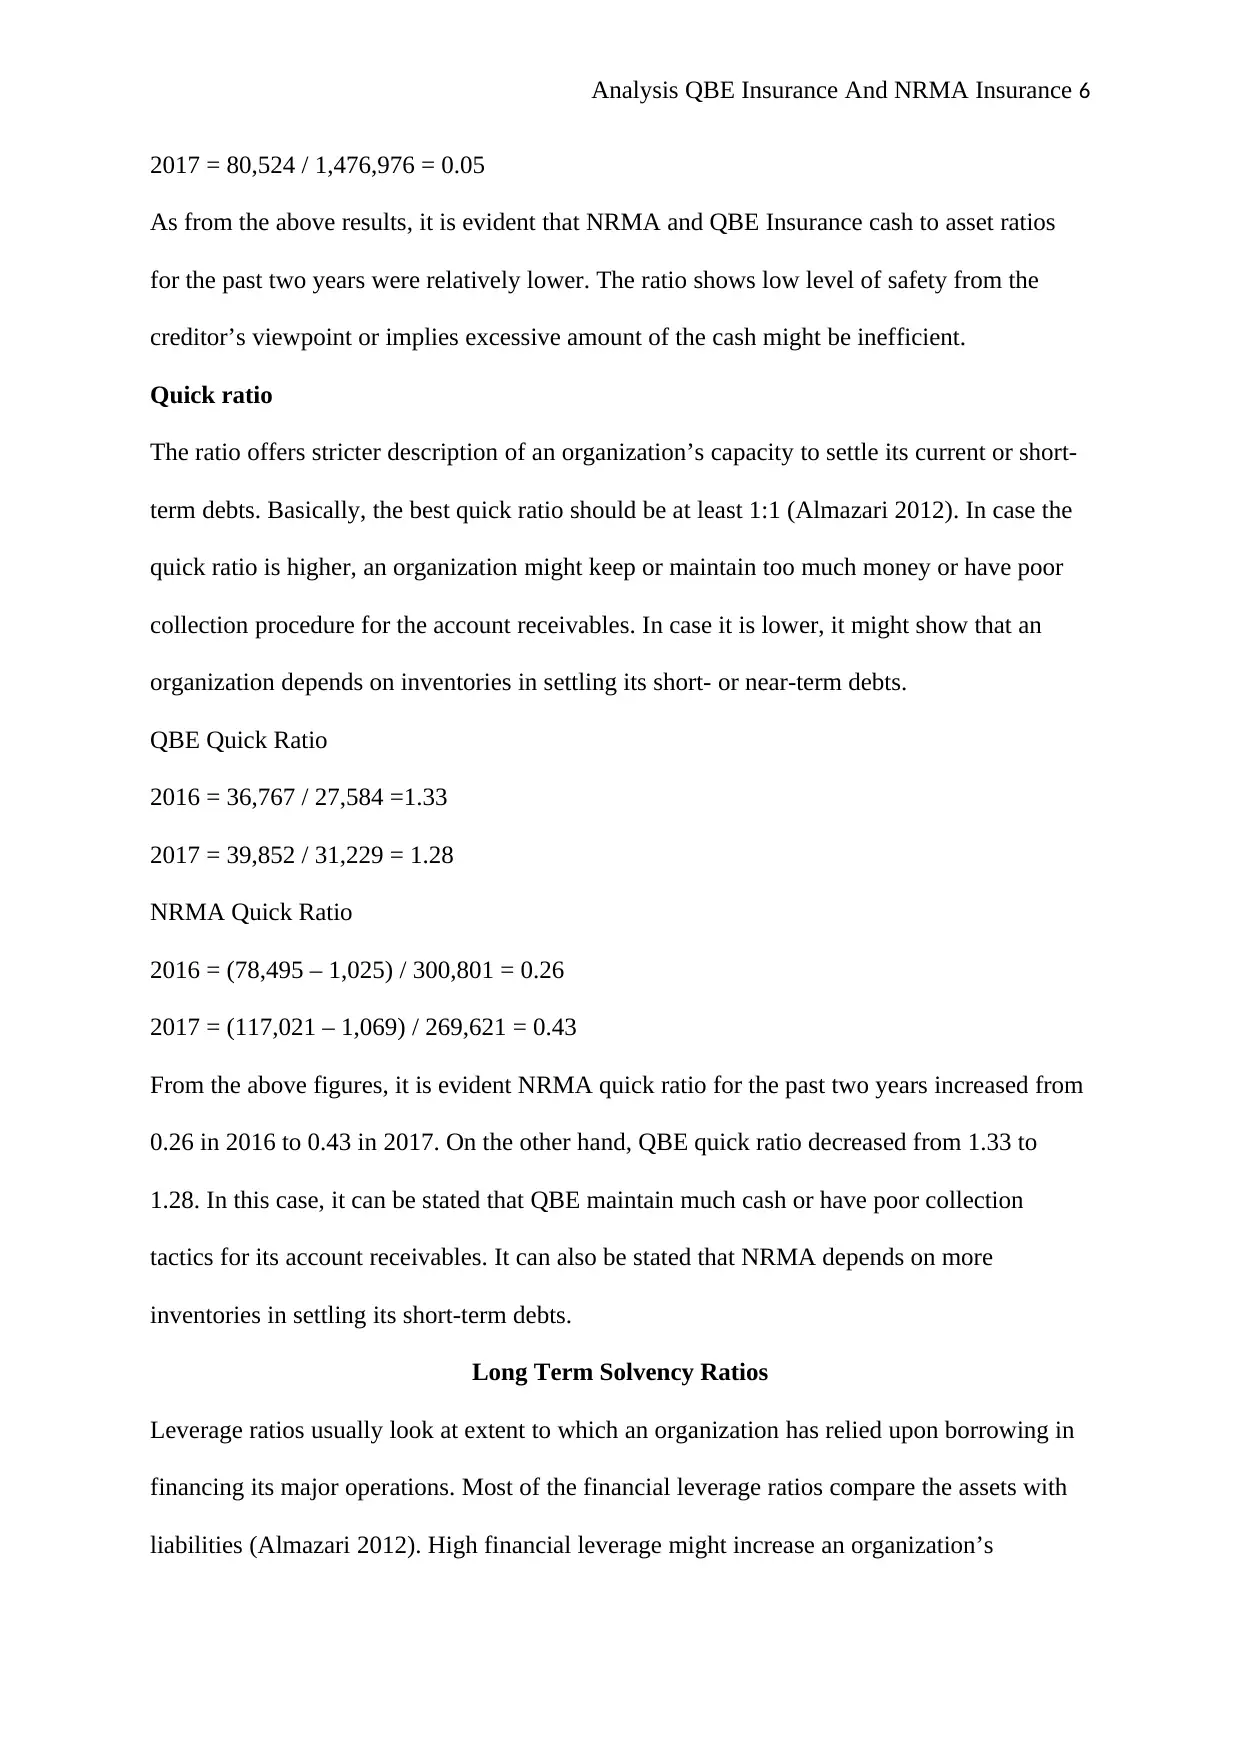
2017 = 80,524 / 1,476,976 = 0.05
As from the above results, it is evident that NRMA and QBE Insurance cash to asset ratios
for the past two years were relatively lower. The ratio shows low level of safety from the
creditor’s viewpoint or implies excessive amount of the cash might be inefficient.
Quick ratio
The ratio offers stricter description of an organization’s capacity to settle its current or short-
term debts. Basically, the best quick ratio should be at least 1:1 (Almazari 2012). In case the
quick ratio is higher, an organization might keep or maintain too much money or have poor
collection procedure for the account receivables. In case it is lower, it might show that an
organization depends on inventories in settling its short- or near-term debts.
QBE Quick Ratio
2016 = 36,767 / 27,584 =1.33
2017 = 39,852 / 31,229 = 1.28
NRMA Quick Ratio
2016 = (78,495 – 1,025) / 300,801 = 0.26
2017 = (117,021 – 1,069) / 269,621 = 0.43
From the above figures, it is evident NRMA quick ratio for the past two years increased from
0.26 in 2016 to 0.43 in 2017. On the other hand, QBE quick ratio decreased from 1.33 to
1.28. In this case, it can be stated that QBE maintain much cash or have poor collection
tactics for its account receivables. It can also be stated that NRMA depends on more
inventories in settling its short-term debts.
Long Term Solvency Ratios
Leverage ratios usually look at extent to which an organization has relied upon borrowing in
financing its major operations. Most of the financial leverage ratios compare the assets with
liabilities (Almazari 2012). High financial leverage might increase an organization’s
⊘ This is a preview!⊘
Do you want full access?
Subscribe today to unlock all pages.
Trusted by 1+ million students worldwide
Analysis QBE Insurance And NRMA Insurance 7
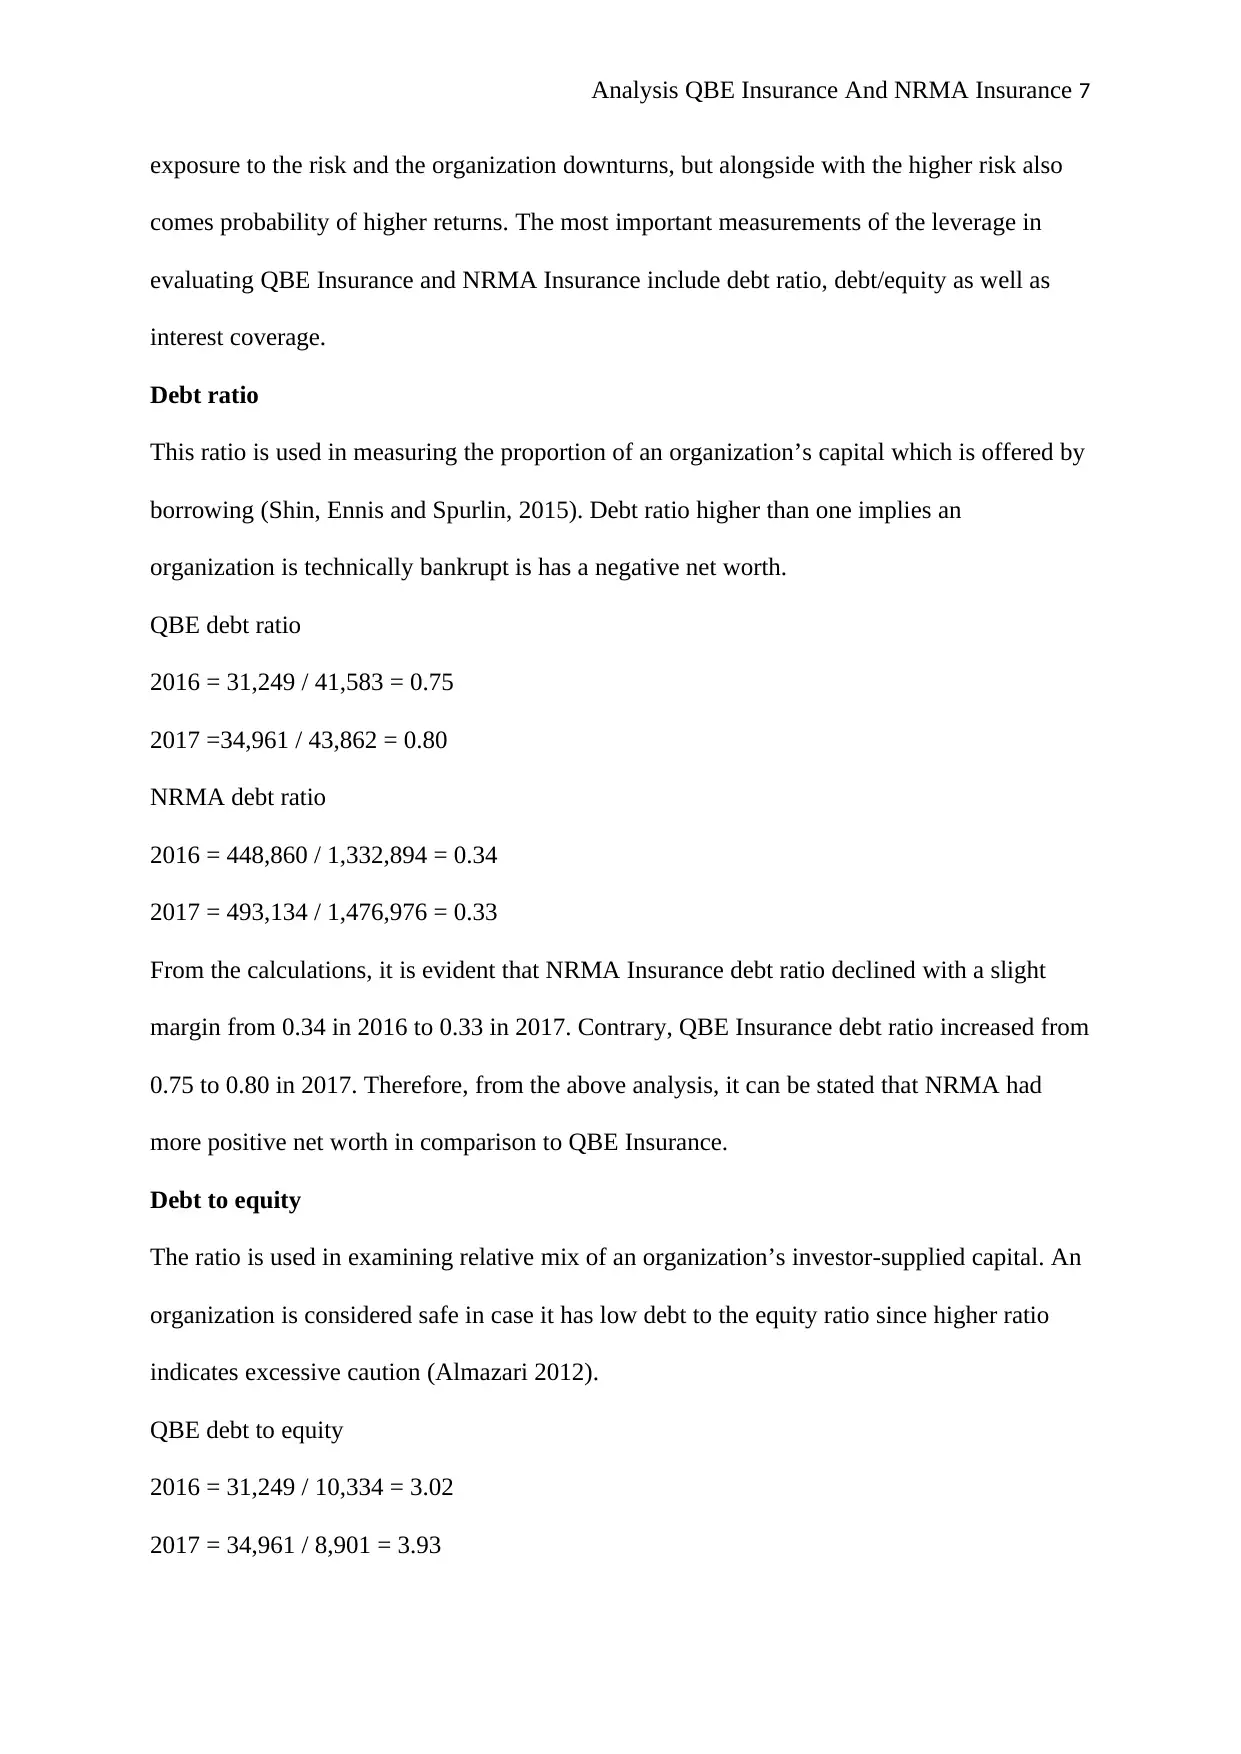
exposure to the risk and the organization downturns, but alongside with the higher risk also
comes probability of higher returns. The most important measurements of the leverage in
evaluating QBE Insurance and NRMA Insurance include debt ratio, debt/equity as well as
interest coverage.
Debt ratio
This ratio is used in measuring the proportion of an organization’s capital which is offered by
borrowing (Shin, Ennis and Spurlin, 2015). Debt ratio higher than one implies an
organization is technically bankrupt is has a negative net worth.
QBE debt ratio
2016 = 31,249 / 41,583 = 0.75
2017 =34,961 / 43,862 = 0.80
NRMA debt ratio
2016 = 448,860 / 1,332,894 = 0.34
2017 = 493,134 / 1,476,976 = 0.33
From the calculations, it is evident that NRMA Insurance debt ratio declined with a slight
margin from 0.34 in 2016 to 0.33 in 2017. Contrary, QBE Insurance debt ratio increased from
0.75 to 0.80 in 2017. Therefore, from the above analysis, it can be stated that NRMA had
more positive net worth in comparison to QBE Insurance.
Debt to equity
The ratio is used in examining relative mix of an organization’s investor-supplied capital. An
organization is considered safe in case it has low debt to the equity ratio since higher ratio
indicates excessive caution (Almazari 2012).
QBE debt to equity
2016 = 31,249 / 10,334 = 3.02
2017 = 34,961 / 8,901 = 3.93
Paraphrase This Document
Need a fresh take? Get an instant paraphrase of this document with our AI Paraphraser
Analysis QBE Insurance And NRMA Insurance 8
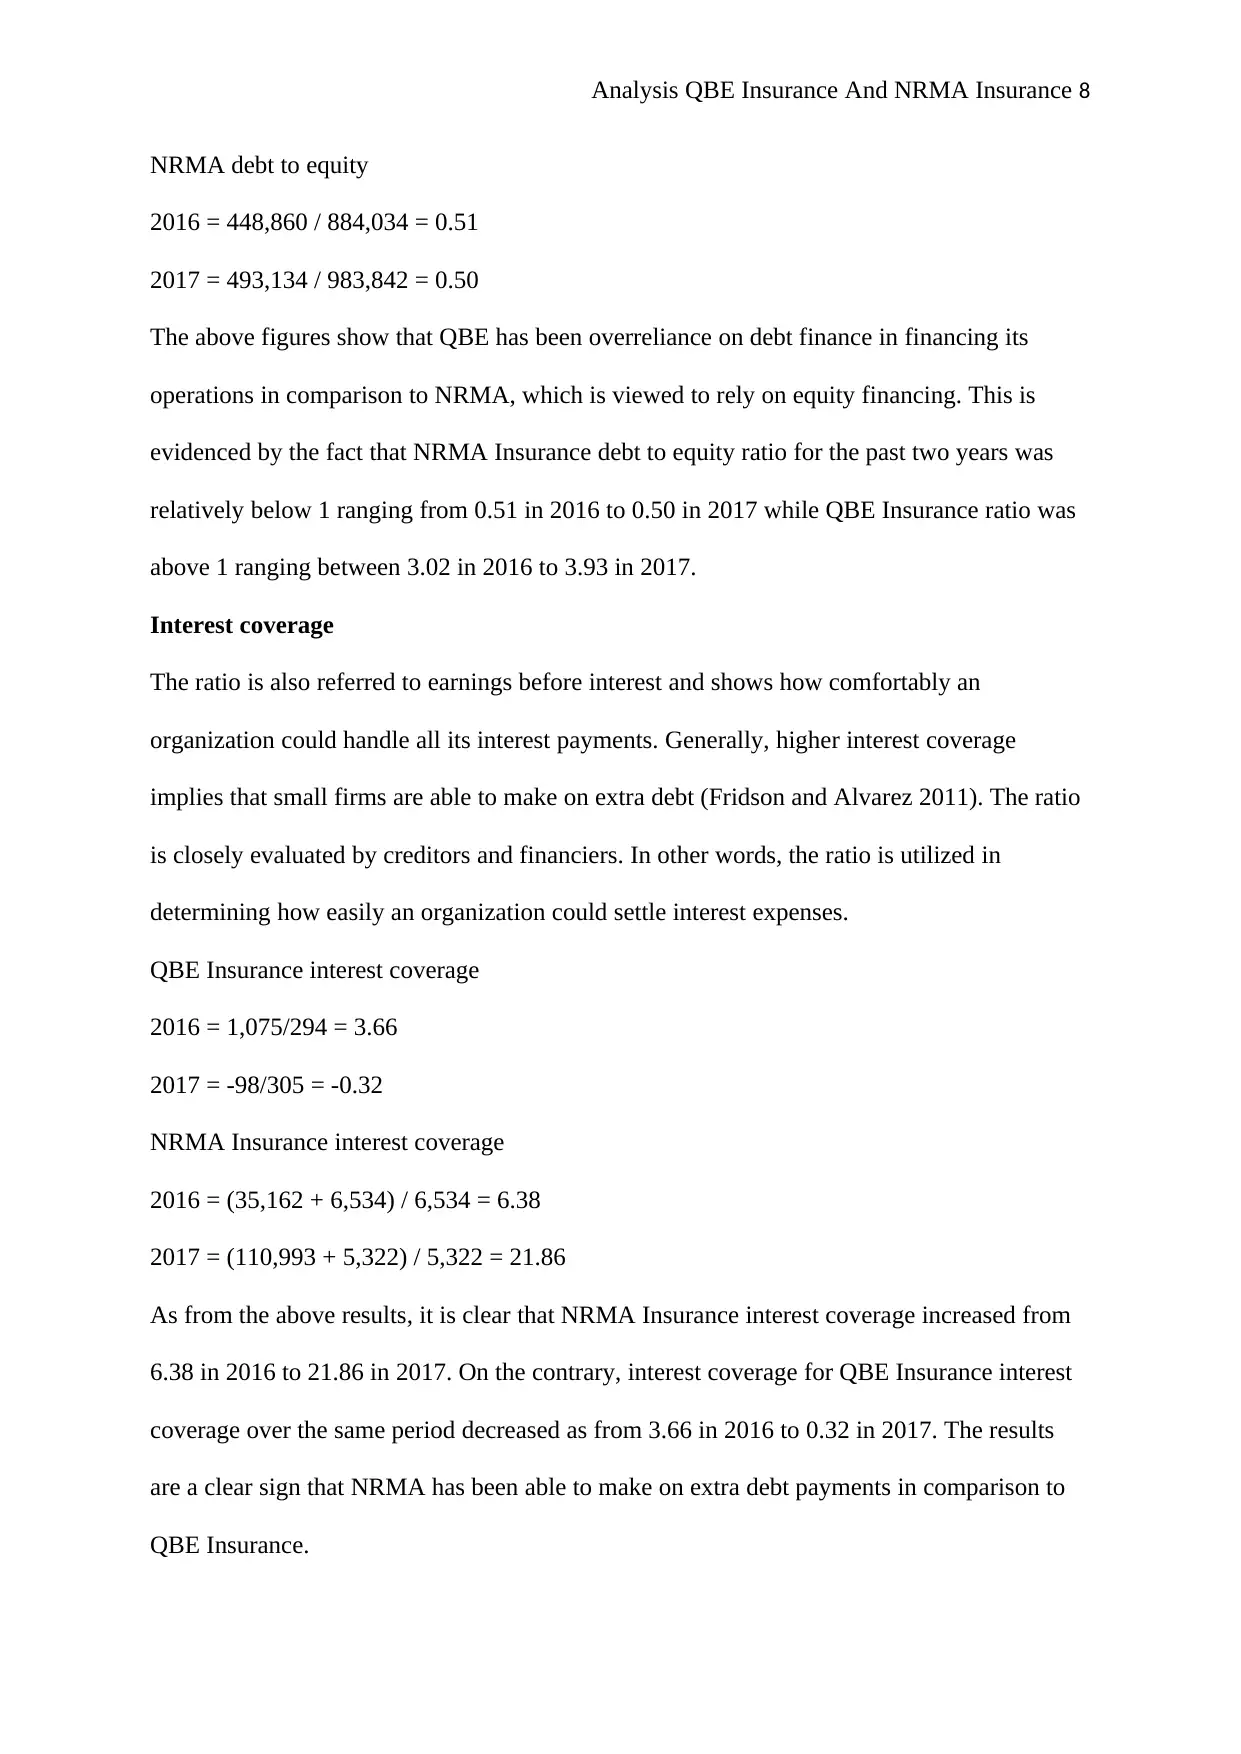
NRMA debt to equity
2016 = 448,860 / 884,034 = 0.51
2017 = 493,134 / 983,842 = 0.50
The above figures show that QBE has been overreliance on debt finance in financing its
operations in comparison to NRMA, which is viewed to rely on equity financing. This is
evidenced by the fact that NRMA Insurance debt to equity ratio for the past two years was
relatively below 1 ranging from 0.51 in 2016 to 0.50 in 2017 while QBE Insurance ratio was
above 1 ranging between 3.02 in 2016 to 3.93 in 2017.
Interest coverage
The ratio is also referred to earnings before interest and shows how comfortably an
organization could handle all its interest payments. Generally, higher interest coverage
implies that small firms are able to make on extra debt (Fridson and Alvarez 2011). The ratio
is closely evaluated by creditors and financiers. In other words, the ratio is utilized in
determining how easily an organization could settle interest expenses.
QBE Insurance interest coverage
2016 = 1,075/294 = 3.66
2017 = -98/305 = -0.32
NRMA Insurance interest coverage
2016 = (35,162 + 6,534) / 6,534 = 6.38
2017 = (110,993 + 5,322) / 5,322 = 21.86
As from the above results, it is clear that NRMA Insurance interest coverage increased from
6.38 in 2016 to 21.86 in 2017. On the contrary, interest coverage for QBE Insurance interest
coverage over the same period decreased as from 3.66 in 2016 to 0.32 in 2017. The results
are a clear sign that NRMA has been able to make on extra debt payments in comparison to
QBE Insurance.
Analysis QBE Insurance And NRMA Insurance 9
Asset Utilization Ratios
These are financial ratios used in assessing an organization’s utilization of assets, inventories
and credit (Velnampy and Niresh 2012). These ratios can assist an organization’s managers in
conducting business better. They can assist the management make decision on whether a
specific entity’s credit structures are fit as well as whether the organization’s purchasing
power are held in a more competent and effective style (Fridson and Alvarez 2011). In this
case, the most important efficiency ratios used in assessing QBE insurance and NRMA
Insurance financial efficiency include inventory turnover, asset turnover and account
receivable turnover.
Inventory Turnover
The ratio shows how efficient an organization management is managing its production into
consideration of its sales (Velnampy and Niresh, 2012). A higher inventory turnover is
considered better though extremely high ratio might shows narrow selection and probably
lost sales. On the other hand, low ratio implies that an organization is paying in order to keep
significantly high inventories and might be overstocking.
NRMA inventory turnover
2016 = 29,358 / 1,025 = 28.64
2017 = 32,192 / 1,069 = 30.11
Account receivable turnover
This ratio is used in measuring how quickly or fast credit sales or receivables are collected. In
other words, it indicates the proportion of credit sales which are outstanding at a specific time
(Higgins 2012).
QBE Insurance account receivable turnover
2016 = 14,276/4,831= 2.96
⊘ This is a preview!⊘
Do you want full access?
Subscribe today to unlock all pages.
Trusted by 1+ million students worldwide
Analysis QBE Insurance And NRMA Insurance 10
2017 = 14,446/4,906 = 2.94
NRMA account receivable turnover
2016 = 511,040 / 27,634 = 18.49
2017 =527,458 / 24,430 = 21.59
From the above calculations, it is evident that NRMA receivable turnover increased from
18.49 times to 21.59 times. On the other hand, QBE Insurance receivable turnover decreased
from 2.96 times to 2.94 times. This is a clear sign that NRMA was more efficient in
collecting amount owed by debtors in comparison to QBE Insurance.
Asset Turnover
The ratio is used in measuring management efficiency in utilizing assets to generate sales
(Velnampy and Niresh 2012). It is gotten by dividing sales by the total assets.
QBE asset turnover
2016 = 14,276/41,583 = 0.34
2017 = 14,446/ 43,862 = 0.33
NRMA asset turnover
2016 = 511,040 / 1,332,894 = 0.38
2017 =527,458 / 1,476,976 = 0.36
As from the asset turnover ratio above, it is clear that both companies experienced decreasing
trend in their asset turnover. Such shows that both firms have been struggling to manage their
assets. In other words, the figures show that both companies’ management were inefficient in
utilizing their assets to generate sales or revenues.
Profitability Ratios
These ratios offer information on management’s performance in utilizing resources of
different firms (McCue and Nayar 2009). A good number of the organization starts their
Paraphrase This Document
Need a fresh take? Get an instant paraphrase of this document with our AI Paraphraser
Analysis QBE Insurance And NRMA Insurance 11
businesses to earn better income. If profitability ratios show that this is not taking place,
especially once organization has moved beyond start-up phase, the organization for whom
return on the money is the primary concern might wish to sell shares or reinvest their cash
elsewhere (Huang, Tsai, Yen & Cheng, 2008). Nonetheless, it is crucial that various aspects
could include profitability ratios. Some of the most specific profitability ratios useful in
evaluating QBE and NRMA Insurance profitability include gross profit margin, the ROA, the
profit margin as well as the ROE.
Gross margin
This ratio is used in measuring margin on the total sales within an organization. It could be
used as a signal of marketing effectiveness or manufacturing efficiency (Kumbirai 2010).
This is computed by dividing gross profit by total revenue.
QBE gross margin
2016 = 11,066/14,276 * 100% = 77.51%
2017 = 12,041/14,446 * 100% = 83.35%
NRMA gross margin
2016 = 163,186/511,040 * 100% = 31.93%
2017 = 170,906/527,458 * 100% = 32.40%
As from the above results, it is evident that QBE Insurance had significant high gross profit
margin over the last two years. This was contrary to its counterpart which was having
relatively lower gross margin in comparison to QBE Insurance. The results are clear
indication that QBE Insurance and NRMA were more profitable over the two years since they
had relatively high gross margin and their gross margin over the past two years increased
over time.
Return on assets
Analysis QBE Insurance And NRMA Insurance 12
The ratio shows how efficient an organization is utilizing its assets in generating income. A
low ROA shows inefficient management while high ROA implies efficient management in
generating income (Gibson 2011).
QBE Insurance ROA
2016 = 844/41,583 * 100% = 2.03%
2017 = -1,253/43,862 * 100% = -2.86%
NRMA ROA
2016 = 34,111/1,332,894 * 100% = 2.56%
2017 = 92,990/1,476,976 * 100% = 6.30%
Based on the above calculations, it is evident that NRMA Insurance ROA over the past two
years increased from 2.56% in 2016 to 6.30% in 2017. Contrary, QBE Insurance ROA
decreased over the same period moving from 2.03% in 2016 to -2.86% in 2017. This is a
clear sign that NRMA Insurance management was more efficient in utilizing its assets in
generating income or net profit.
Net profit margin
The ratio is used in measuring overall profitability of an organization or how much the
organization is bringing to bottom line (Megginson & Smart 2008). A strong profitability in
collaboration with a weak profitability might show some issues with the indirect operating
expenses such as the interest expenses. Generally, the net profit margin indicates
effectiveness of the organization’s management. It is usually gotten by dividing net income
by the total revenue.
QBE Insurance Net profit margin
2016 = 844/14,276 * 100% = 5.91%
2017 = -1,253/14,446 * 100% = - 8.67%
NRMA Net profit margin
⊘ This is a preview!⊘
Do you want full access?
Subscribe today to unlock all pages.
Trusted by 1+ million students worldwide
1 out of 19
Related Documents


Your All-in-One AI-Powered Toolkit for Academic Success.
+13062052269
info@desklib.com
Available 24*7 on WhatsApp / Email
![[object Object]](/_next/static/media/star-bottom.7253800d.svg)
Unlock your academic potential
Copyright © 2020–2026 A2Z Services. All Rights Reserved. Developed and managed by ZUCOL.