QBM117 Business Statistics Assignment: Data Analysis and Probability
VerifiedAdded on 2020/03/04
|11
|1776
|42
Homework Assignment
AI Summary
This document provides a comprehensive solution to a QBM117 Business Statistics assignment. The solution includes detailed answers to questions involving variable identification, pivot table analysis, and calculation of percentages. It covers probability concepts, including binomial and Poisson distributions, with calculations for various scenarios. Furthermore, the assignment explores normal distribution, descriptive statistics, and the application of statistical methods to real-world business problems, such as analyzing car repair data, cinema attendance, and tire lifespan. The solution also includes interpretations of statistical results and critical analysis of data collection methods.
QBM117 Business Statistics
Name of the Student
Name of the University
Author Note
Name of the Student
Name of the University
Author Note
Paraphrase This Document
Need a fresh take? Get an instant paraphrase of this document with our AI Paraphraser
Question 1
a. Variable from the data set:
i. Qualitative and Nominal: Suburb, Address, Type, Result, and Agent
ii. Qualitative and Ordinal: No Variable
iii. Quantitative and Ratio: Price
iv. Quantitative and Ordinal: Bedrooms
b. Overall outcome to the appropriate results:
Result code Overall Outcome
PI, NB, VB Did not sell
SP, PN Sold prior to the auction
S, SN Sold at the auction
SA, SS Sold after the auction
W Withdrawn from sale
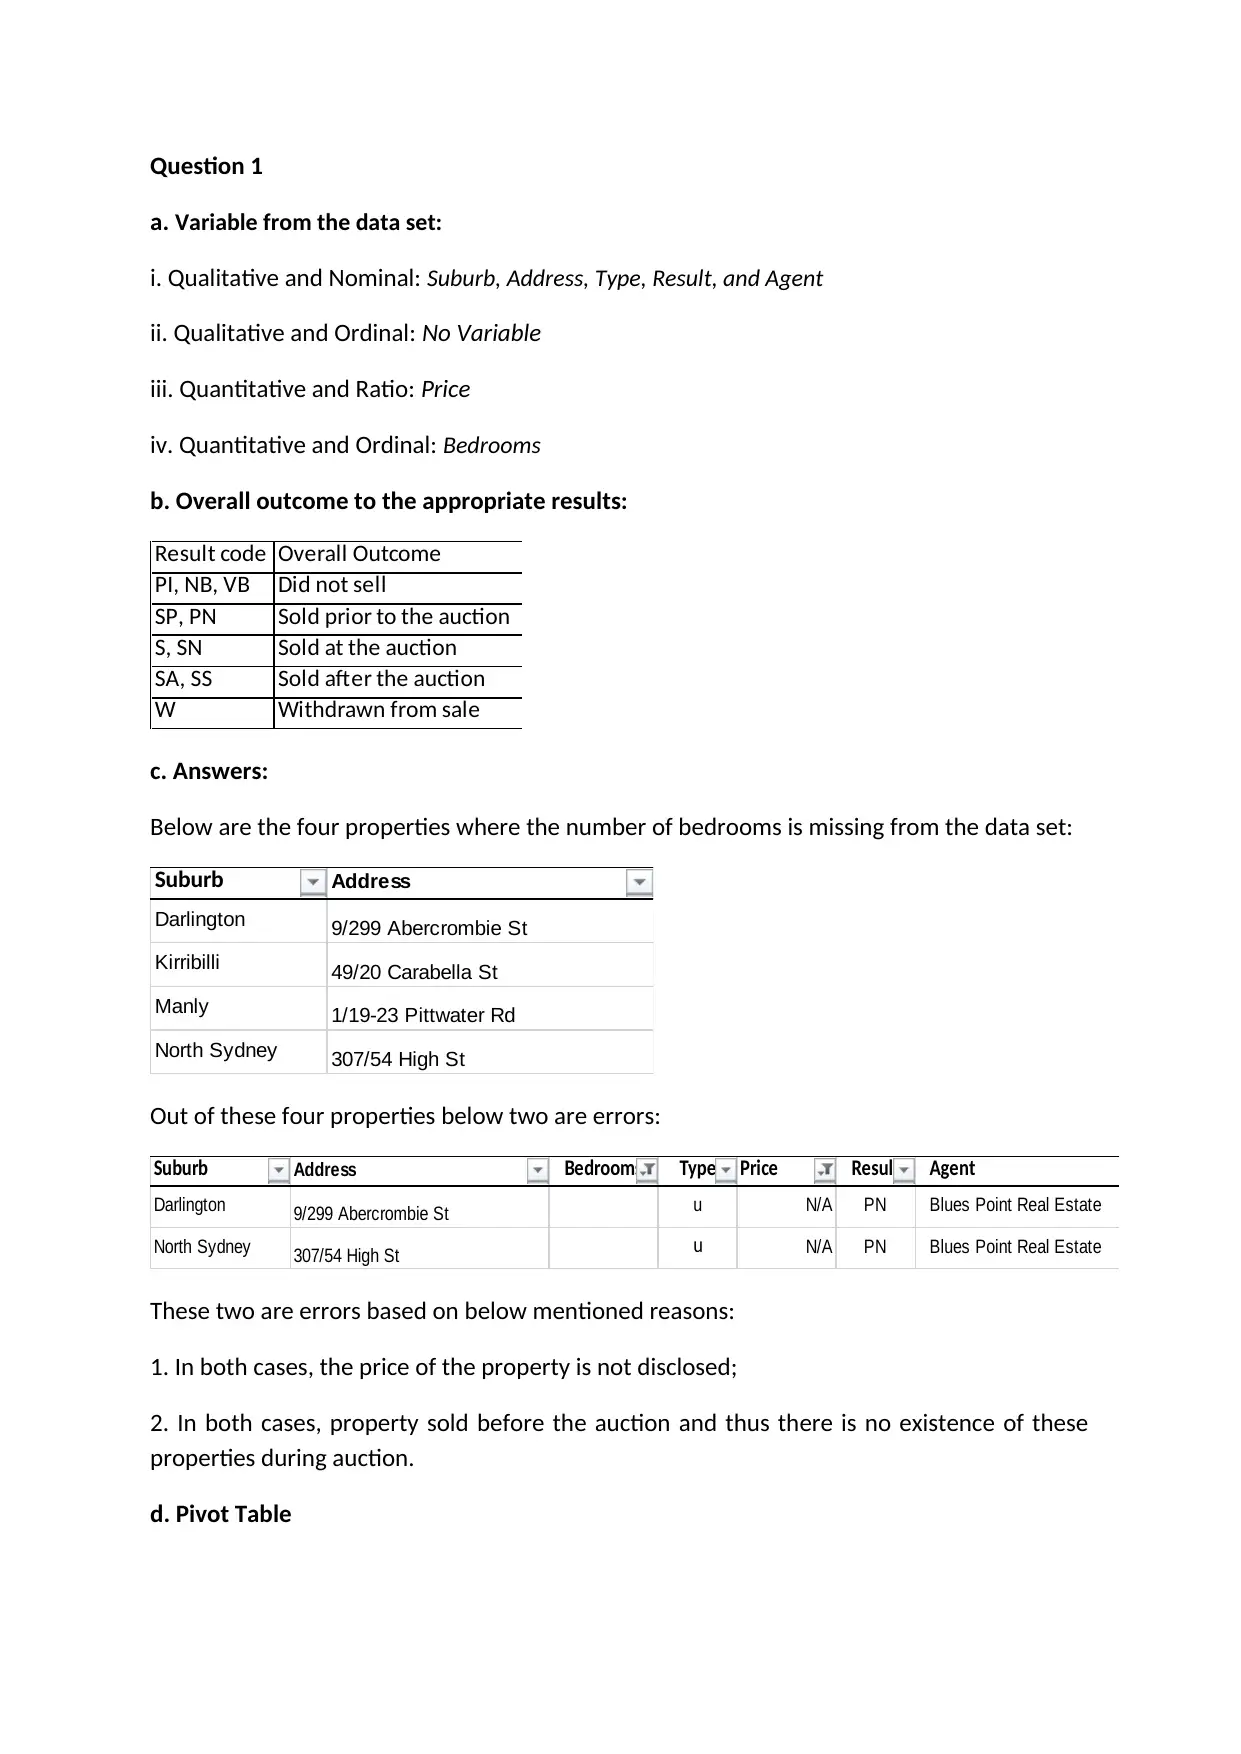
c. Answers:
Below are the four properties where the number of bedrooms is missing from the data set:
Suburb Address
Darlington 9/299 Abercrombie St
Kirribilli 49/20 Carabella St
Manly 1/19-23 Pittwater Rd
North Sydney 307/54 High St
Out of these four properties below two are errors:
Suburb Address Bedrooms Type Price Result Agent
Darlington 9/299 Abercrombie St u N/A PN Blues Point Real Estate
North Sydney 307/54 High St u N/A PN Blues Point Real Estate
These two are errors based on below mentioned reasons:
1. In both cases, the price of the property is not disclosed;
2. In both cases, property sold before the auction and thus there is no existence of these
properties during auction.
d. Pivot Table
a. Variable from the data set:
i. Qualitative and Nominal: Suburb, Address, Type, Result, and Agent
ii. Qualitative and Ordinal: No Variable
iii. Quantitative and Ratio: Price
iv. Quantitative and Ordinal: Bedrooms
b. Overall outcome to the appropriate results:
Result code Overall Outcome
PI, NB, VB Did not sell
SP, PN Sold prior to the auction
S, SN Sold at the auction
SA, SS Sold after the auction
W Withdrawn from sale
c. Answers:
Below are the four properties where the number of bedrooms is missing from the data set:
Suburb Address
Darlington 9/299 Abercrombie St
Kirribilli 49/20 Carabella St
Manly 1/19-23 Pittwater Rd
North Sydney 307/54 High St
Out of these four properties below two are errors:
Suburb Address Bedrooms Type Price Result Agent
Darlington 9/299 Abercrombie St u N/A PN Blues Point Real Estate
North Sydney 307/54 High St u N/A PN Blues Point Real Estate
These two are errors based on below mentioned reasons:
1. In both cases, the price of the property is not disclosed;
2. In both cases, property sold before the auction and thus there is no existence of these
properties during auction.
d. Pivot Table
Count of ResultColumn Labels
Row Labels PI PN S SN SP VB W Grand Total
h 36 8 159 28 72 5 5 313
1 1 1
2 2 18 3 6 1 30
3 15 4 60 12 29 120
4 6 4 54 7 27 2 2 102
5 7 22 4 9 1 2 45
6 3 4 1 1 1 10
7 3 1 4
8 1 1
studio 2 2
(blank) 2 2
t 1 3 15 3 1 23
2 1 3 1 5
3 1 2 10 2 1 16
4 1 1
5 1 1
u 6 5 68 3 46 1 129
1 9 12 21
2 4 3 45 1 30 1 84
3 1 12 2 4 19
4 1 2 3
(blank) 2 2
Grand Total 43 16 244 31 121 6 6 467
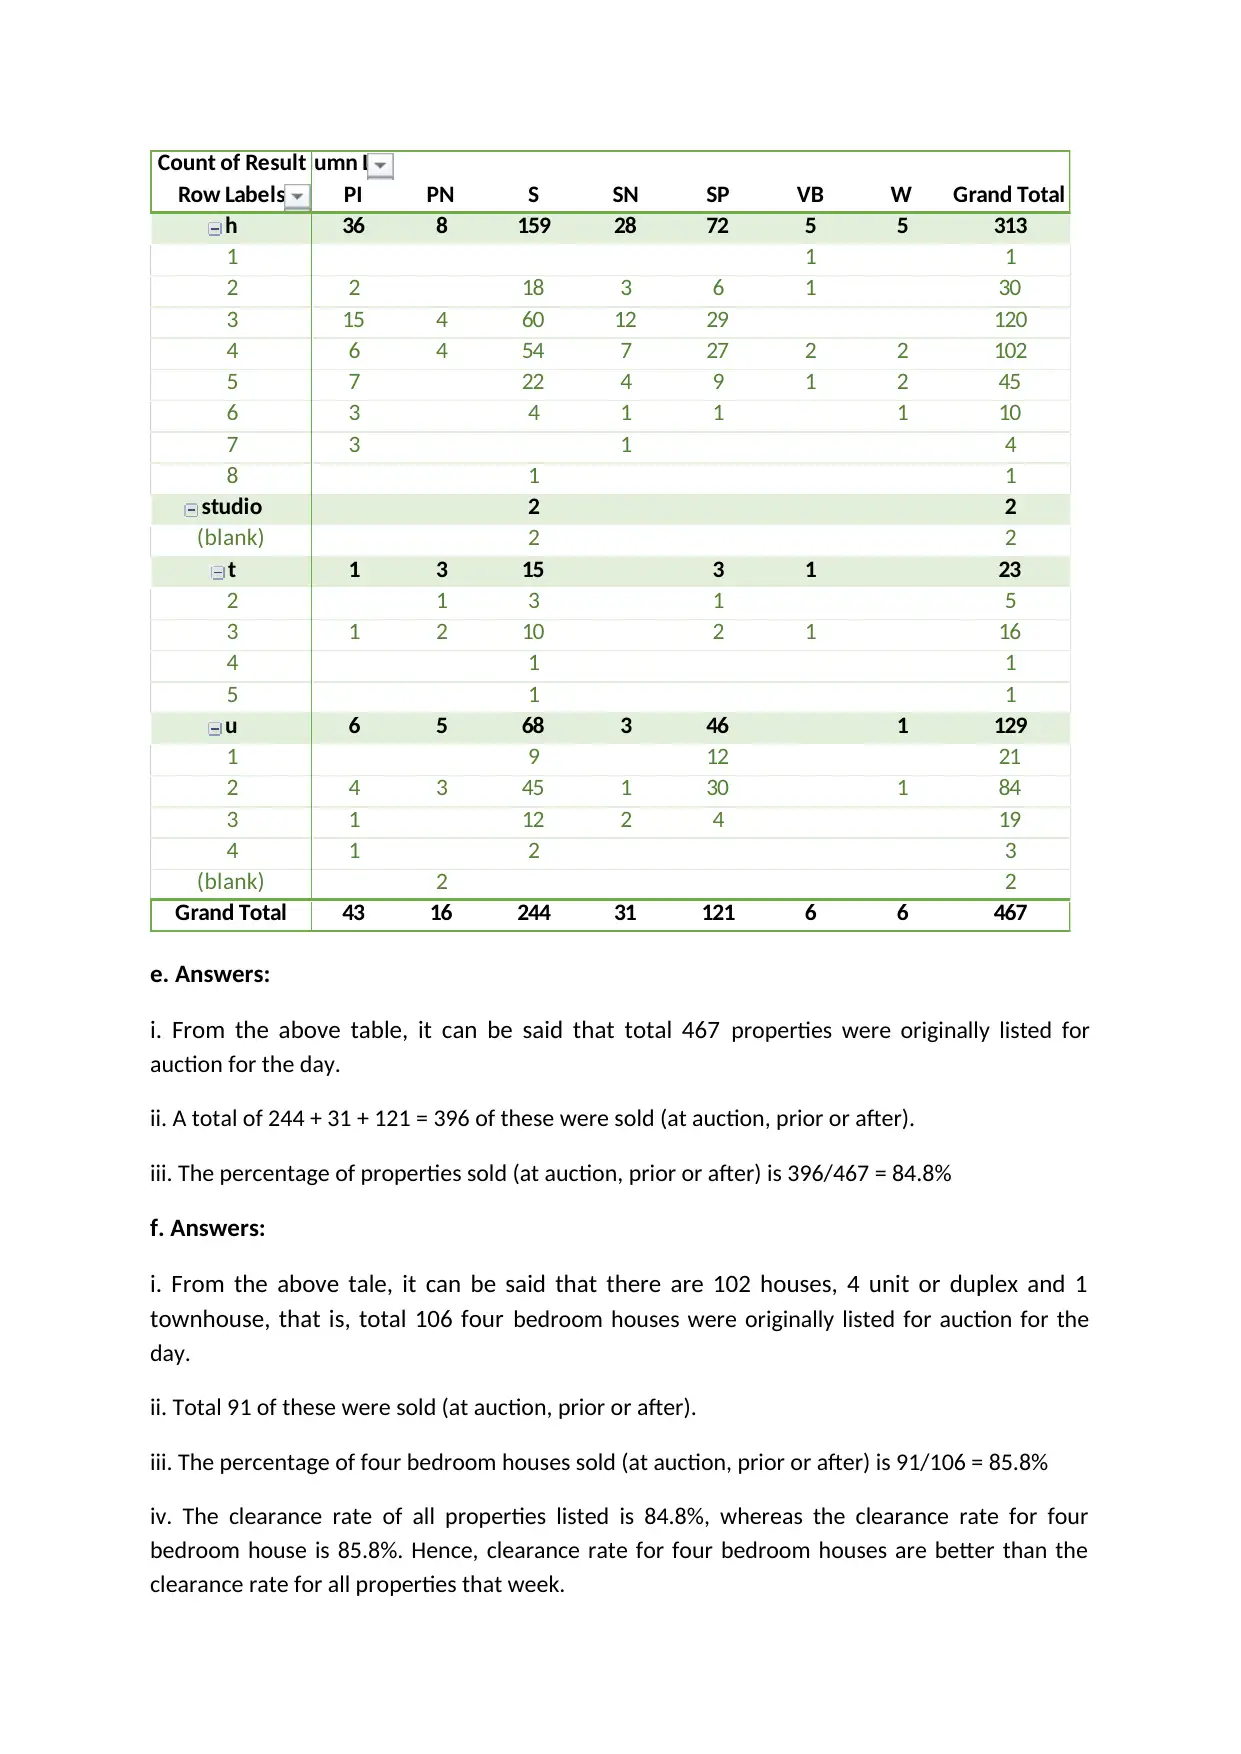
e. Answers:
i. From the above table, it can be said that total 467 properties were originally listed for
auction for the day.
ii. A total of 244 + 31 + 121 = 396 of these were sold (at auction, prior or after).
iii. The percentage of properties sold (at auction, prior or after) is 396/467 = 84.8%
f. Answers:
i. From the above tale, it can be said that there are 102 houses, 4 unit or duplex and 1
townhouse, that is, total 106 four bedroom houses were originally listed for auction for the
day.
ii. Total 91 of these were sold (at auction, prior or after).
iii. The percentage of four bedroom houses sold (at auction, prior or after) is 91/106 = 85.8%
iv. The clearance rate of all properties listed is 84.8%, whereas the clearance rate for four
bedroom house is 85.8%. Hence, clearance rate for four bedroom houses are better than the
clearance rate for all properties that week.
Row Labels PI PN S SN SP VB W Grand Total
h 36 8 159 28 72 5 5 313
1 1 1
2 2 18 3 6 1 30
3 15 4 60 12 29 120
4 6 4 54 7 27 2 2 102
5 7 22 4 9 1 2 45
6 3 4 1 1 1 10
7 3 1 4
8 1 1
studio 2 2
(blank) 2 2
t 1 3 15 3 1 23
2 1 3 1 5
3 1 2 10 2 1 16
4 1 1
5 1 1
u 6 5 68 3 46 1 129
1 9 12 21
2 4 3 45 1 30 1 84
3 1 12 2 4 19
4 1 2 3
(blank) 2 2
Grand Total 43 16 244 31 121 6 6 467
e. Answers:
i. From the above table, it can be said that total 467 properties were originally listed for
auction for the day.
ii. A total of 244 + 31 + 121 = 396 of these were sold (at auction, prior or after).
iii. The percentage of properties sold (at auction, prior or after) is 396/467 = 84.8%
f. Answers:
i. From the above tale, it can be said that there are 102 houses, 4 unit or duplex and 1
townhouse, that is, total 106 four bedroom houses were originally listed for auction for the
day.
ii. Total 91 of these were sold (at auction, prior or after).
iii. The percentage of four bedroom houses sold (at auction, prior or after) is 91/106 = 85.8%
iv. The clearance rate of all properties listed is 84.8%, whereas the clearance rate for four
bedroom house is 85.8%. Hence, clearance rate for four bedroom houses are better than the
clearance rate for all properties that week.
⊘ This is a preview!⊘
Do you want full access?
Subscribe today to unlock all pages.
Trusted by 1+ million students worldwide
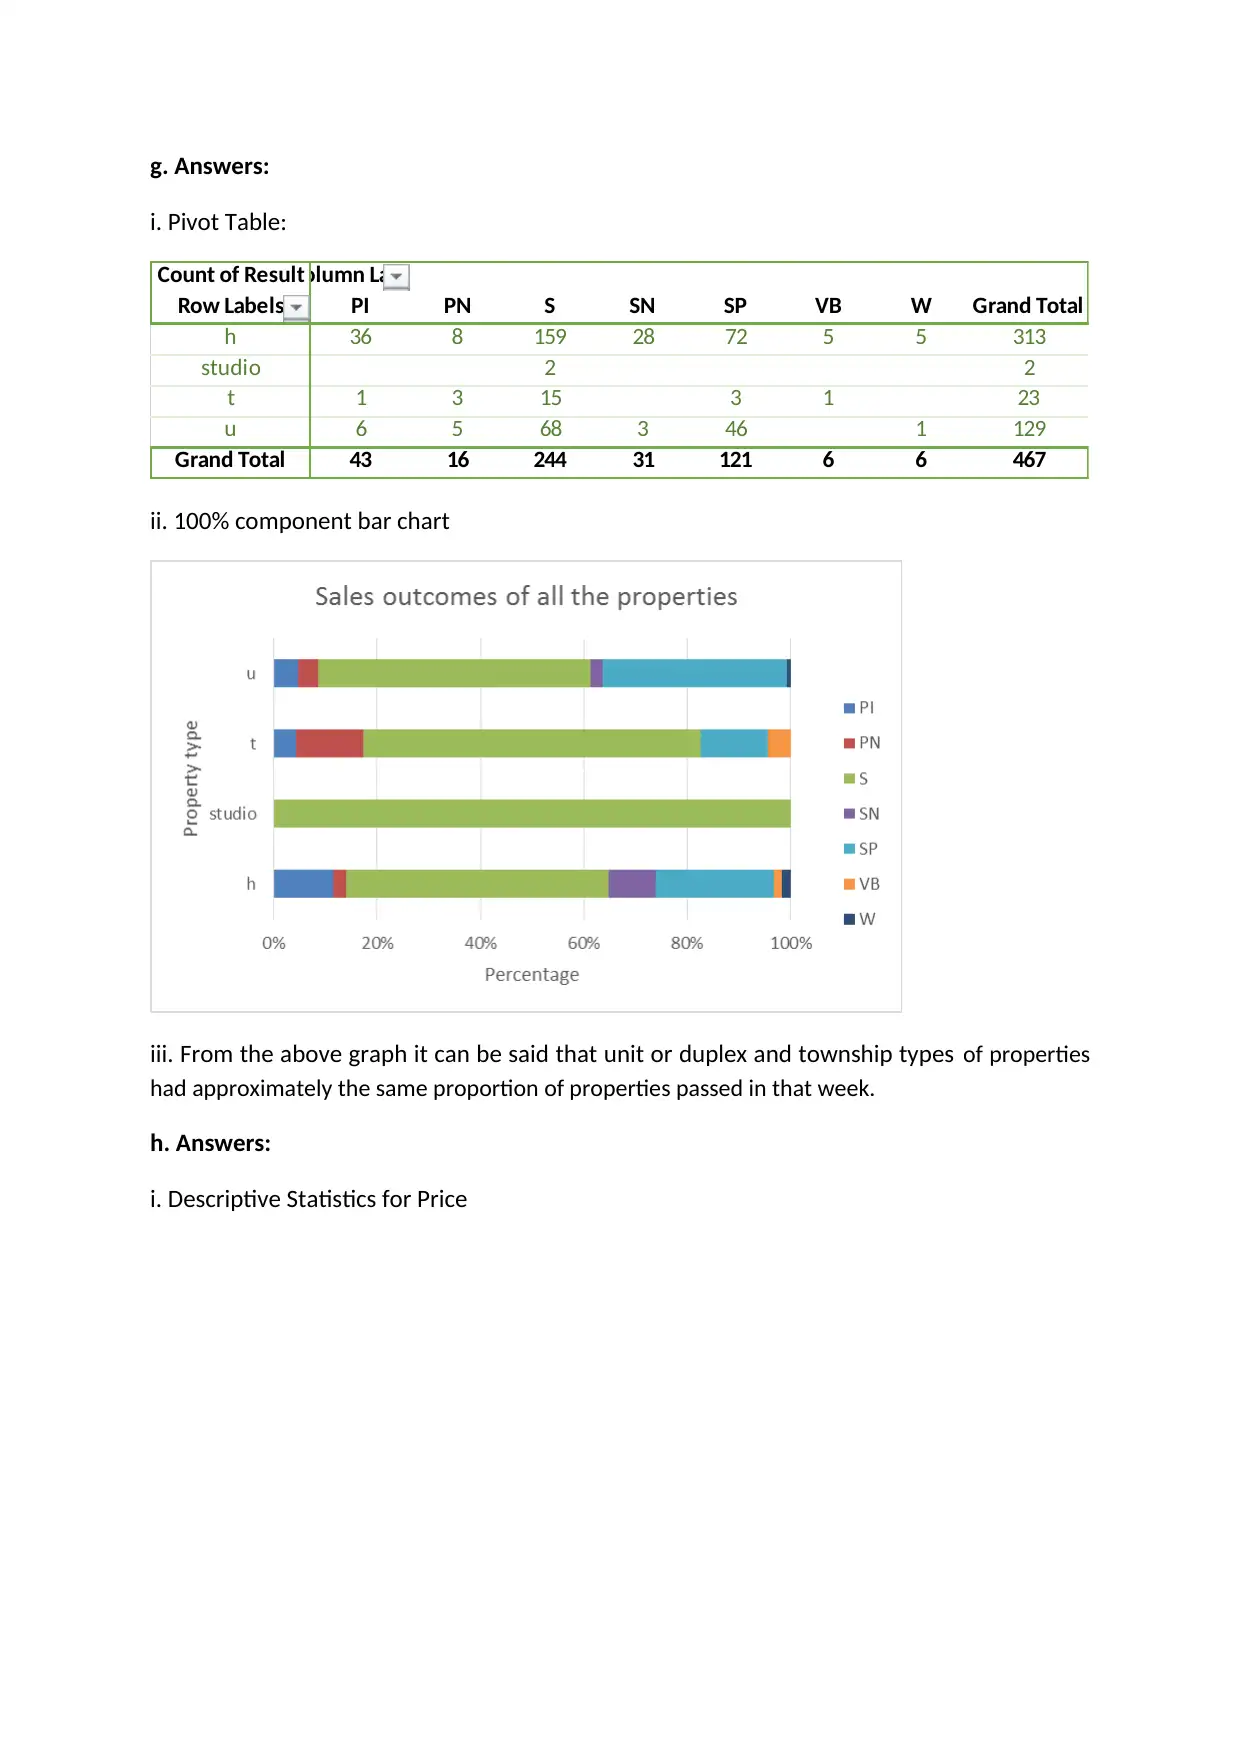
g. Answers:
i. Pivot Table:
Count of ResultColumn Labels
Row Labels PI PN S SN SP VB W Grand Total
h 36 8 159 28 72 5 5 313
studio 2 2
t 1 3 15 3 1 23
u 6 5 68 3 46 1 129
Grand Total 43 16 244 31 121 6 6 467
ii. 100% component bar chart
iii. From the above graph it can be said that unit or duplex and township types of properties
had approximately the same proportion of properties passed in that week.
h. Answers:
i. Descriptive Statistics for Price
Paraphrase This Document
Need a fresh take? Get an instant paraphrase of this document with our AI Paraphraser
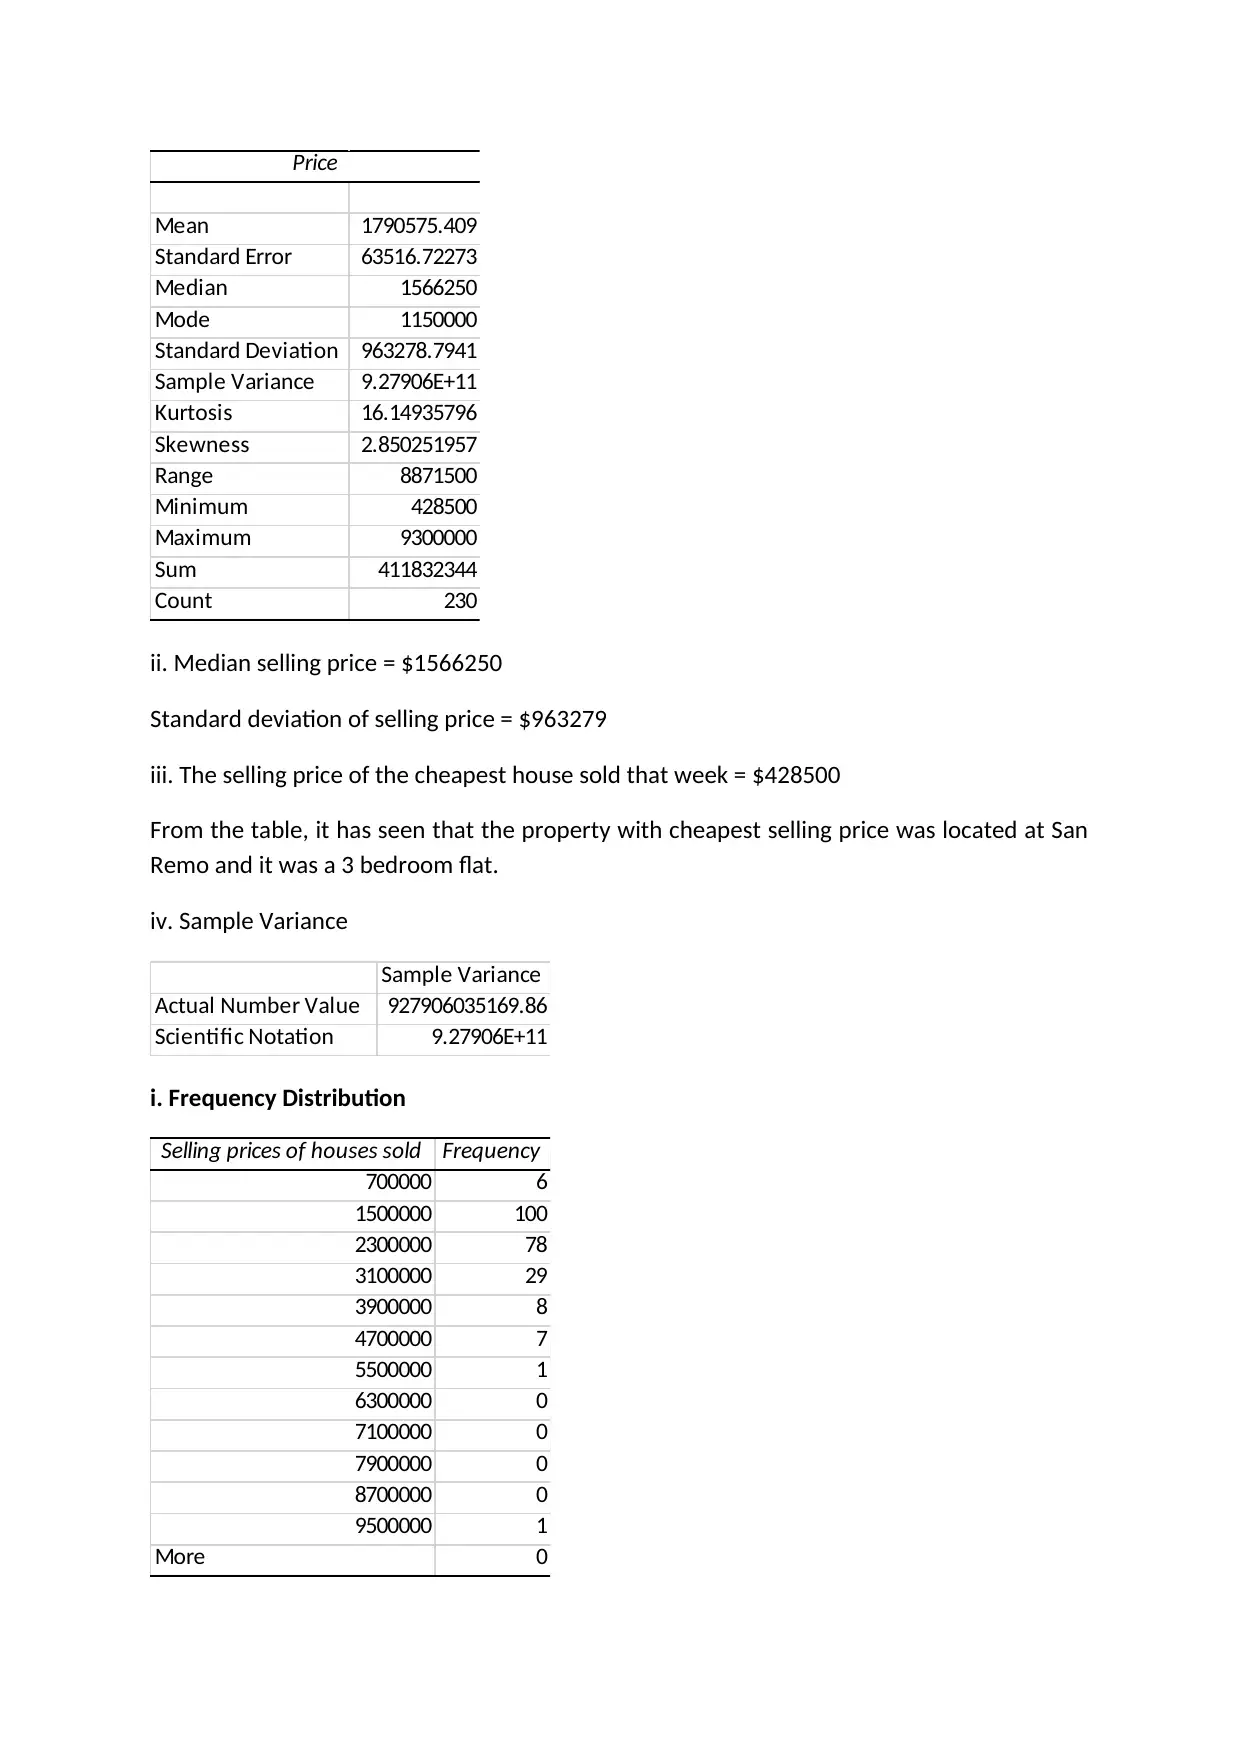
Price
Mean 1790575.409
Standard Error 63516.72273
Median 1566250
Mode 1150000
Standard Deviation 963278.7941
Sample Variance 9.27906E+11
Kurtosis 16.14935796
Skewness 2.850251957
Range 8871500
Minimum 428500
Maximum 9300000
Sum 411832344
Count 230
ii. Median selling price = $1566250
Standard deviation of selling price = $963279
iii. The selling price of the cheapest house sold that week = $428500
From the table, it has seen that the property with cheapest selling price was located at San
Remo and it was a 3 bedroom flat.
iv. Sample Variance
Sample Variance
Actual Number Value 927906035169.86
Scientific Notation 9.27906E+11
i. Frequency Distribution
Selling prices of houses sold Frequency
700000 6
1500000 100
2300000 78
3100000 29
3900000 8
4700000 7
5500000 1
6300000 0
7100000 0
7900000 0
8700000 0
9500000 1
More 0
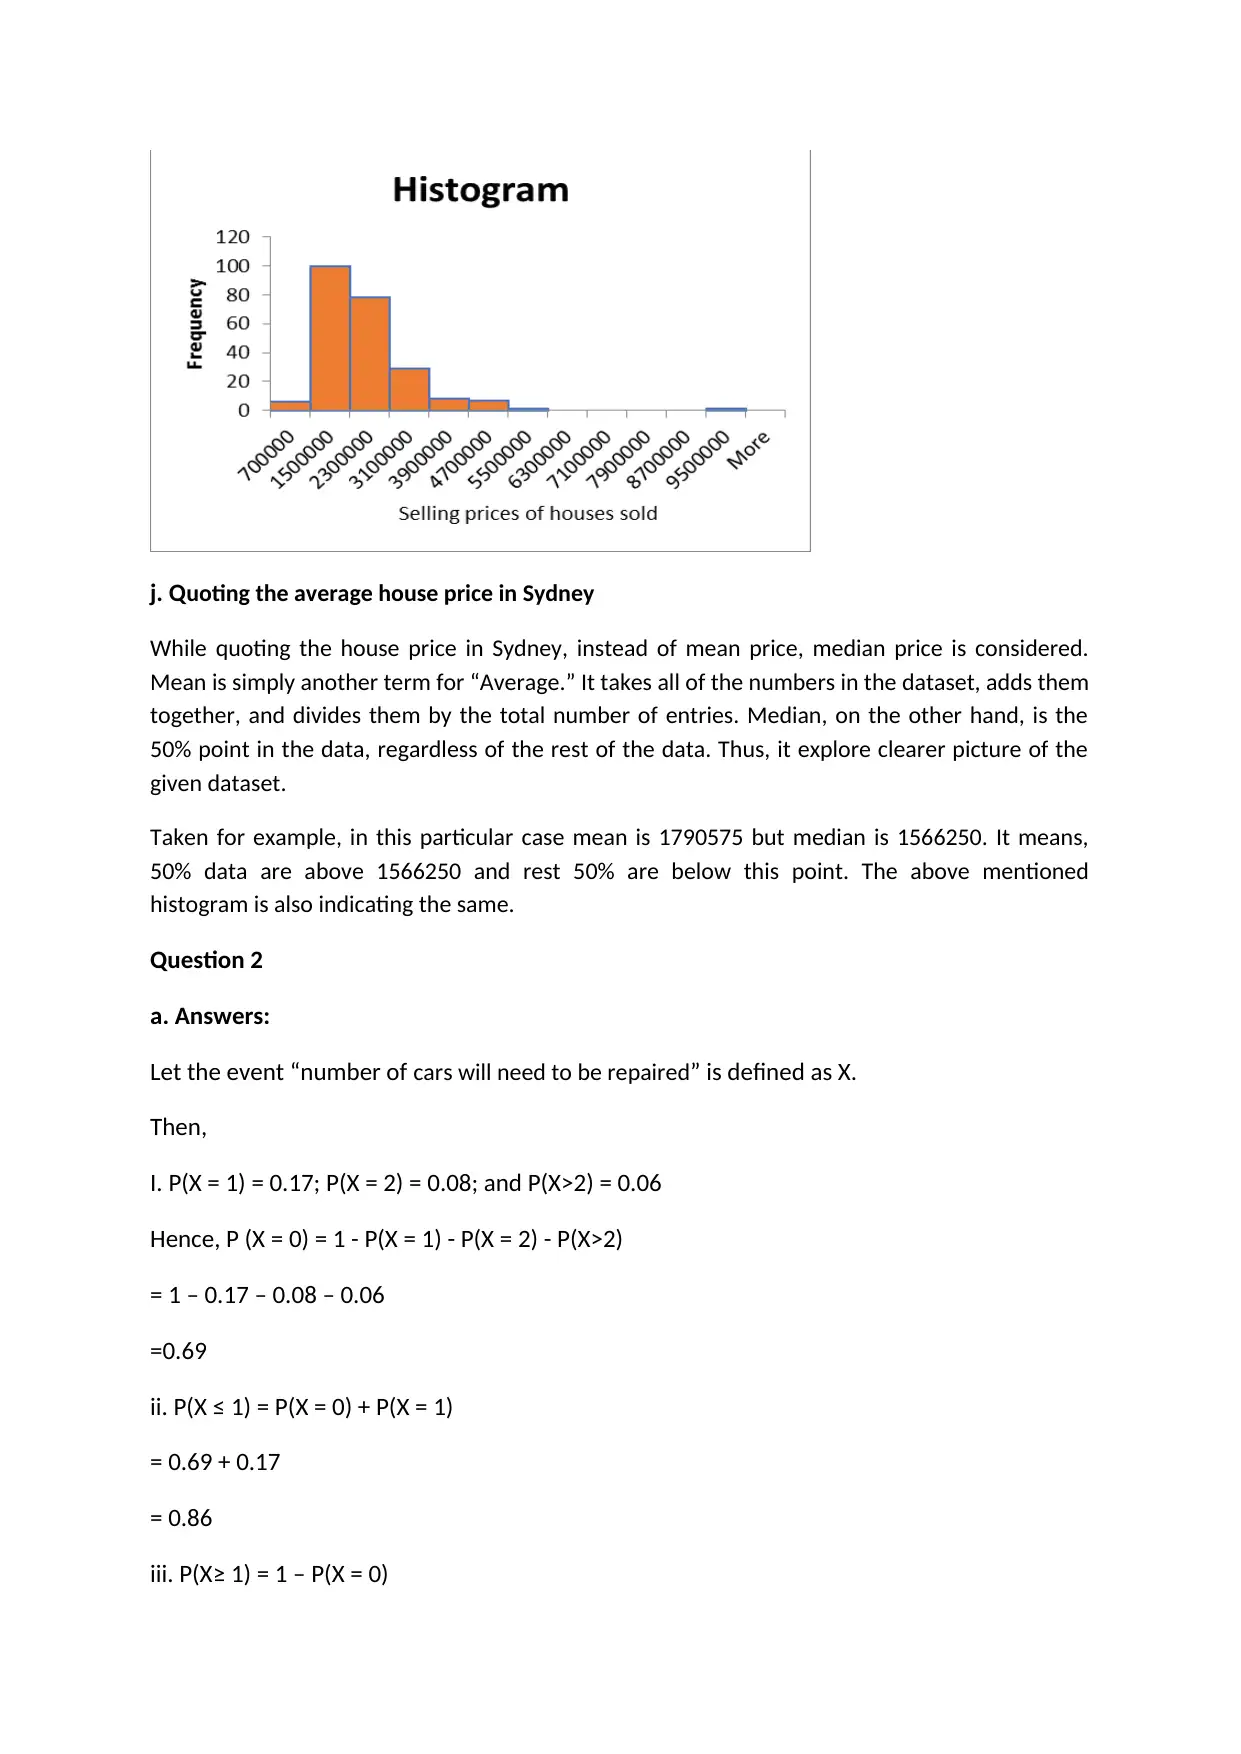
j. Quoting the average house price in Sydney
While quoting the house price in Sydney, instead of mean price, median price is considered.
Mean is simply another term for “Average.” It takes all of the numbers in the dataset, adds them
together, and divides them by the total number of entries. Median, on the other hand, is the
50% point in the data, regardless of the rest of the data. Thus, it explore clearer picture of the
given dataset.
Taken for example, in this particular case mean is 1790575 but median is 1566250. It means,
50% data are above 1566250 and rest 50% are below this point. The above mentioned
histogram is also indicating the same.
Question 2
a. Answers:
Let the event “number of cars will need to be repaired” is defined as X.
Then,
I. P(X = 1) = 0.17; P(X = 2) = 0.08; and P(X>2) = 0.06
Hence, P (X = 0) = 1 - P(X = 1) - P(X = 2) - P(X>2)
= 1 – 0.17 – 0.08 – 0.06
=0.69
ii. P(X ≤ 1) = P(X = 0) + P(X = 1)
= 0.69 + 0.17
= 0.86
iii. P(X≥ 1) = 1 – P(X = 0)
⊘ This is a preview!⊘
Do you want full access?
Subscribe today to unlock all pages.
Trusted by 1+ million students worldwide
= 1 – 0.69
= 0.31
b. Answers:
Given, X be the number of cars a mechanic repairs on a given day. The probability distribution of
X follows:
No. cars X 6 7 8 9 10
Probability 0.15 0.25 0.3 0.23 0.07
Now, mean number of cars repaired on any given day = μ= ∑Xi*Pi
= 6*0.15 + 7*0.25 + 8*0.3 + 9*0.23 + 10*0.07
= 7.82
= 8 [approx.]
Also standard deviation number of cars repaired on any given day = sqrt (∑Pi*(Xi-μ)^2)
As per given table, therefore the standard deviation is sqrt (84.896) = 9.21 = 10 [approx.]
No. cars X 6 7 8 9 10
Probability 0.15 0.25 0.3 0.23 0.07
Xi-μ -1.82 -0.82 0.18 1.18 2.18
(Xi-μ)^2 3.3124 0.6724 0.0324 1.3924 4.7524
Pi*(Xi-μ)^2 19.8744 4.7068 0.2592 12.5316 47.524
c. Answer:
The sample chosen by Paul is a biased one because of the following reasons:
1. The survey was done on a particular day. There was significant chance that the very next day
or any other day different number of people will come to watch cinema. Hence, instead of one
day observation, the sample should be collected over a period more than 4 days at least;
2. The survey mainly considered women. However, considering women only will not give clear
picture to determine how often people go to the cinema.
d. Stratified Sampling by age and gender
i. Male members in the age range 31 to 50 = (300/900)*90 = 30
ii. Female members = (200/900)*90 = 20
Paraphrase This Document
Need a fresh take? Get an instant paraphrase of this document with our AI Paraphraser
Question 3
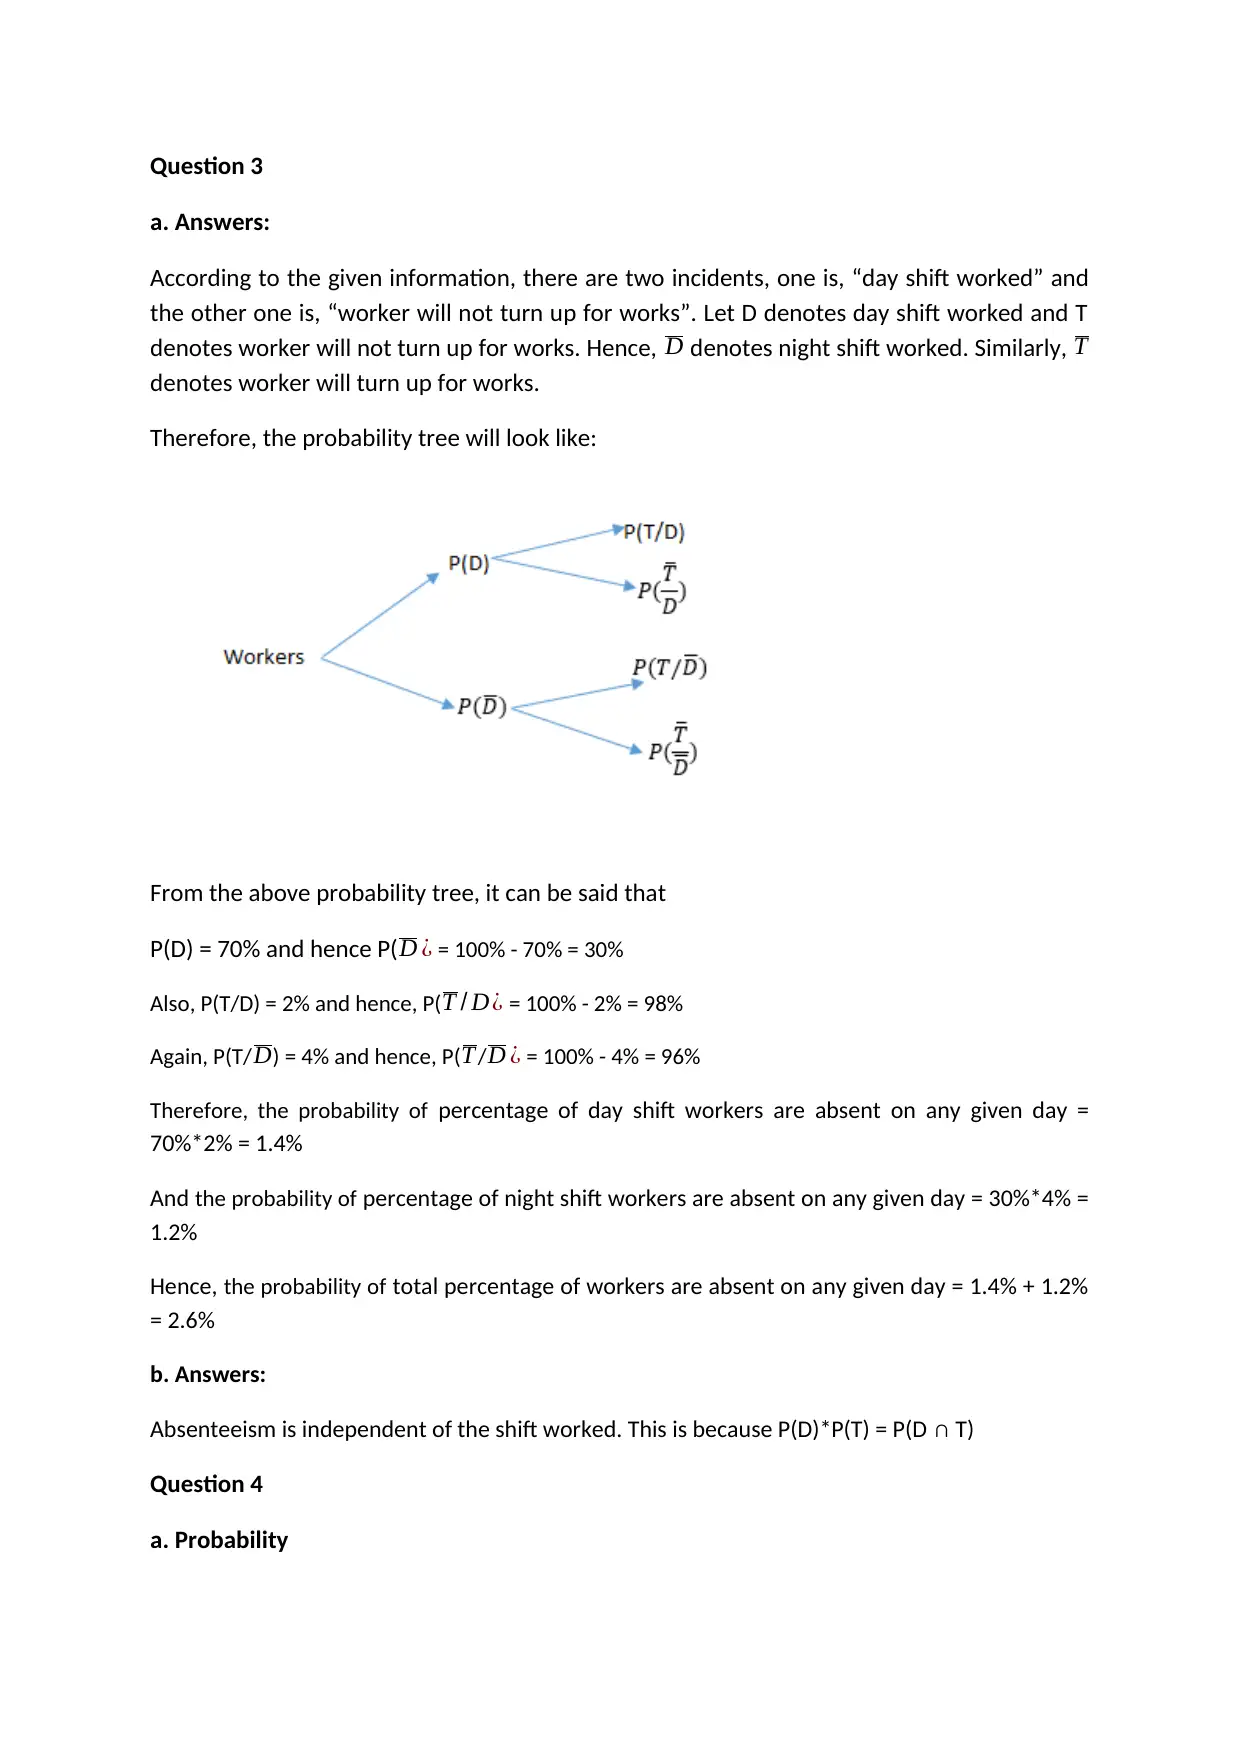
a. Answers:
According to the given information, there are two incidents, one is, “day shift worked” and
the other one is, “worker will not turn up for works”. Let D denotes day shift worked and T
denotes worker will not turn up for works. Hence, D denotes night shift worked. Similarly, T
denotes worker will turn up for works.
Therefore, the probability tree will look like:
From the above probability tree, it can be said that
P(D) = 70% and hence P(D ¿ = 100% - 70% = 30%
Also, P(T/D) = 2% and hence, P(T / D¿ = 100% - 2% = 98%
Again, P(T/ D) = 4% and hence, P( T / D ¿ = 100% - 4% = 96%
Therefore, the probability of percentage of day shift workers are absent on any given day =
70%*2% = 1.4%
And the probability of percentage of night shift workers are absent on any given day = 30%*4% =
1.2%
Hence, the probability of total percentage of workers are absent on any given day = 1.4% + 1.2%
= 2.6%
b. Answers:
Absenteeism is independent of the shift worked. This is because P(D)*P(T) = P(D ∩ T)
Question 4
a. Probability
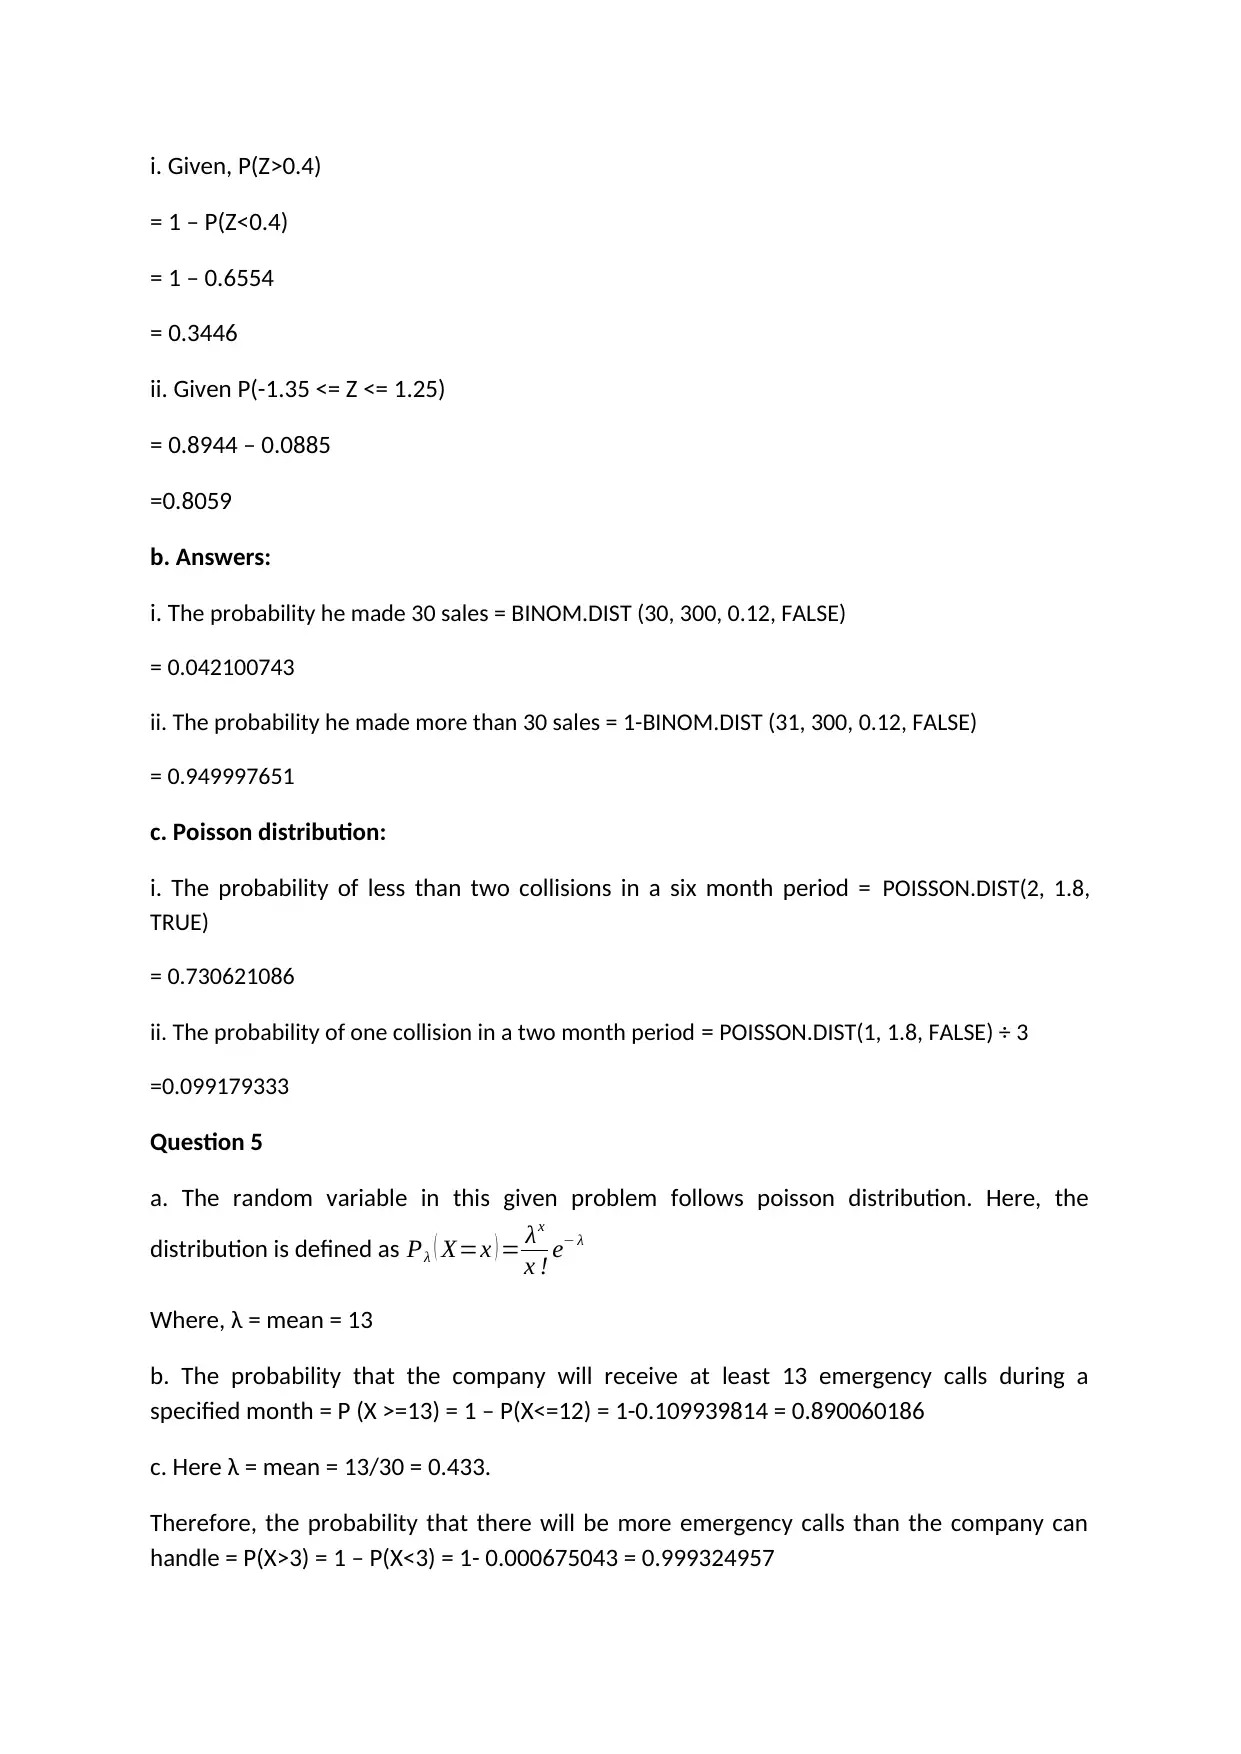
i. Given, P(Z>0.4)
= 1 – P(Z<0.4)
= 1 – 0.6554
= 0.3446
ii. Given P(-1.35 <= Z <= 1.25)
= 0.8944 – 0.0885
=0.8059
b. Answers:
i. The probability he made 30 sales = BINOM.DIST (30, 300, 0.12, FALSE)
= 0.042100743
ii. The probability he made more than 30 sales = 1-BINOM.DIST (31, 300, 0.12, FALSE)
= 0.949997651
c. Poisson distribution:
i. The probability of less than two collisions in a six month period = POISSON.DIST(2, 1.8,
TRUE)
= 0.730621086
ii. The probability of one collision in a two month period = POISSON.DIST(1, 1.8, FALSE) ÷ 3
=0.099179333
Question 5
a. The random variable in this given problem follows poisson distribution. Here, the
distribution is defined as Pλ ( X=x ) = λx
x ! e− λ
Where, λ = mean = 13
b. The probability that the company will receive at least 13 emergency calls during a
specified month = P (X >=13) = 1 – P(X<=12) = 1-0.109939814 = 0.890060186
c. Here λ = mean = 13/30 = 0.433.
Therefore, the probability that there will be more emergency calls than the company can
handle = P(X>3) = 1 – P(X<3) = 1- 0.000675043 = 0.999324957
⊘ This is a preview!⊘
Do you want full access?
Subscribe today to unlock all pages.
Trusted by 1+ million students worldwide
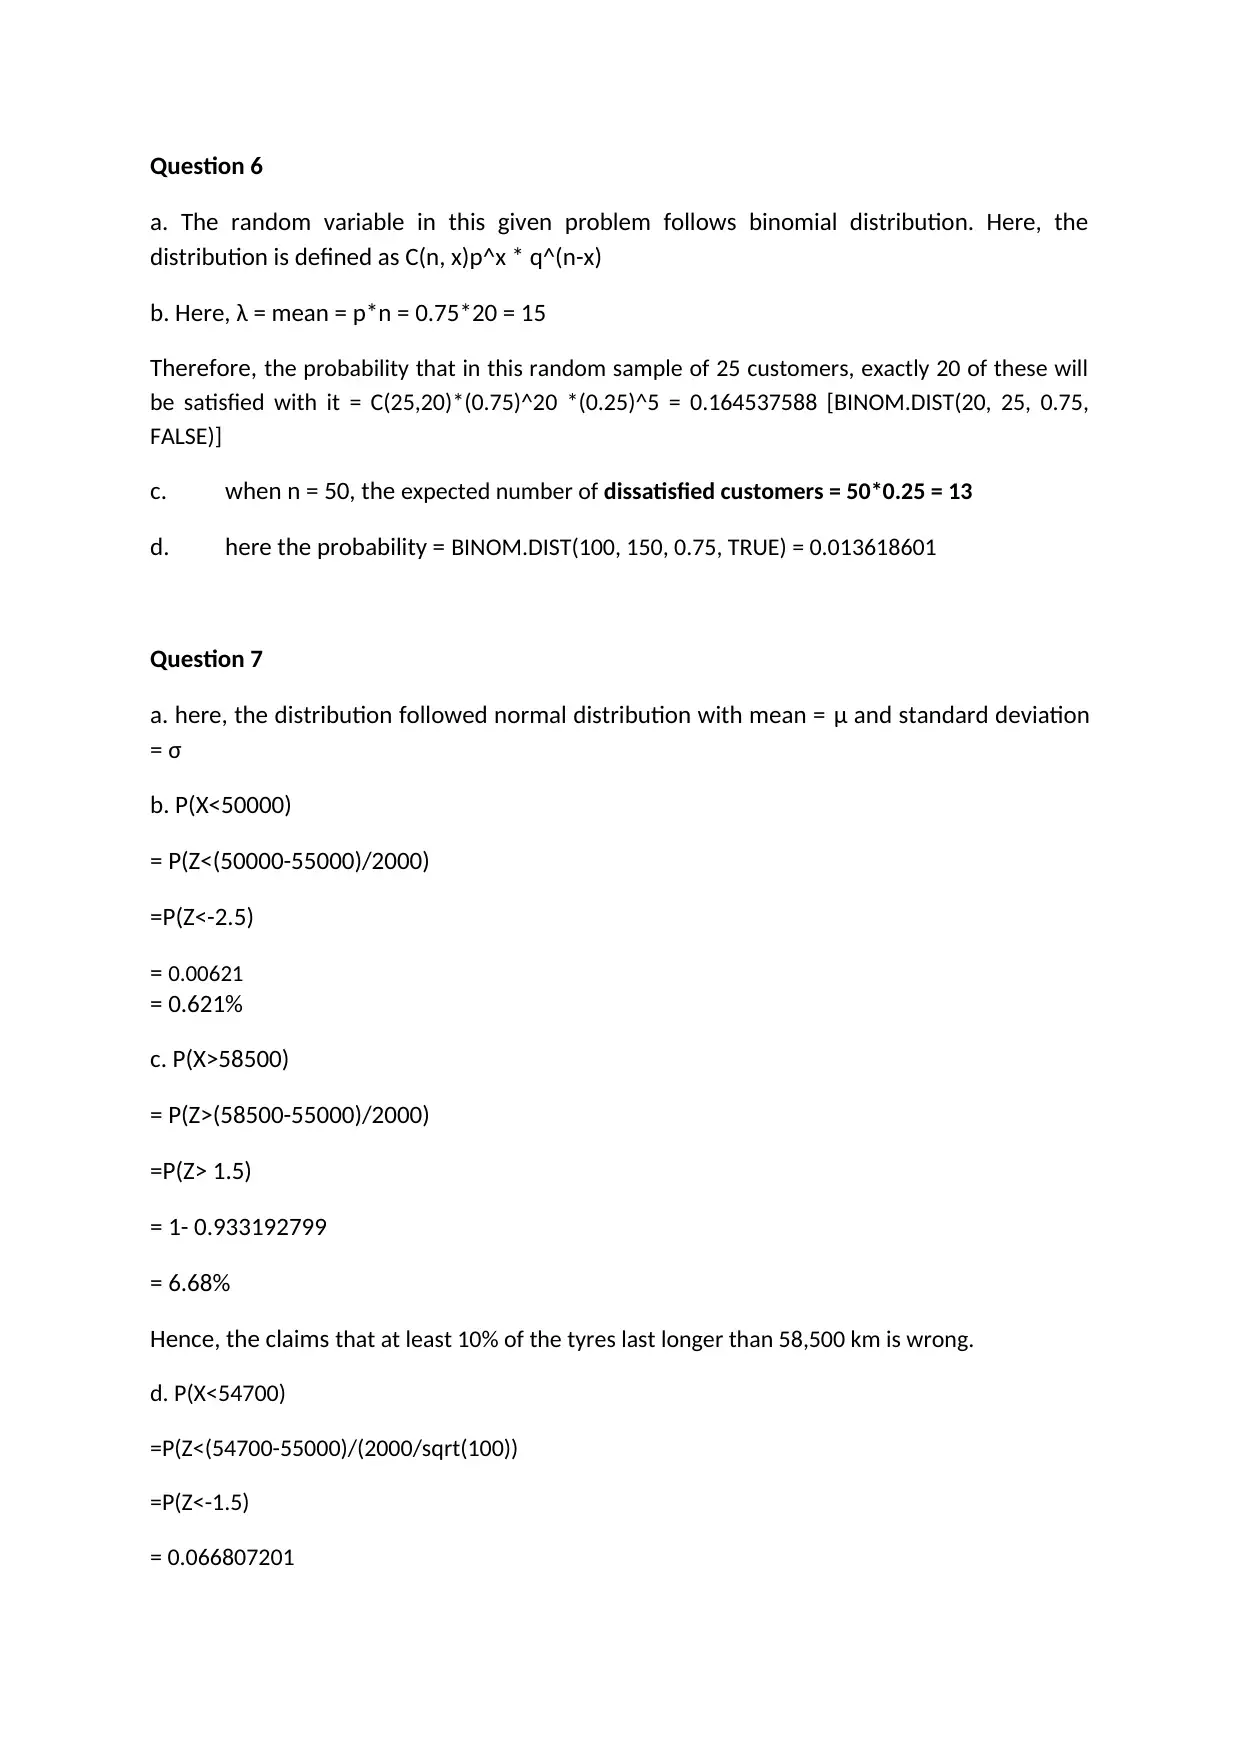
Question 6
a. The random variable in this given problem follows binomial distribution. Here, the
distribution is defined as C(n, x)p^x * q^(n-x)
b. Here, λ = mean = p*n = 0.75*20 = 15
Therefore, the probability that in this random sample of 25 customers, exactly 20 of these will
be satisfied with it = C(25,20)*(0.75)^20 *(0.25)^5 = 0.164537588 [BINOM.DIST(20, 25, 0.75,
FALSE)]
c. when n = 50, the expected number of dissatisfied customers = 50*0.25 = 13
d. here the probability = BINOM.DIST(100, 150, 0.75, TRUE) = 0.013618601
Question 7
a. here, the distribution followed normal distribution with mean = μ and standard deviation
= σ
b. P(X<50000)
= P(Z<(50000-55000)/2000)
=P(Z<-2.5)
= 0.00621
= 0.621%
c. P(X>58500)
= P(Z>(58500-55000)/2000)
=P(Z> 1.5)
= 1- 0.933192799
= 6.68%
Hence, the claims that at least 10% of the tyres last longer than 58,500 km is wrong.
d. P(X<54700)
=P(Z<(54700-55000)/(2000/sqrt(100))
=P(Z<-1.5)
= 0.066807201
Paraphrase This Document
Need a fresh take? Get an instant paraphrase of this document with our AI Paraphraser

=6.68%
1 out of 11


Your All-in-One AI-Powered Toolkit for Academic Success.
+13062052269
info@desklib.com
Available 24*7 on WhatsApp / Email
![[object Object]](/_next/static/media/star-bottom.7253800d.svg)
Unlock your academic potential
Copyright © 2020–2026 A2Z Services. All Rights Reserved. Developed and managed by ZUCOL.