QI/PI Tools: Analyzing the Closure of Long Beach Community Hospital

Verified

Added on  2022/10/19

|10
|1275
|11
Case Study
AI Summary
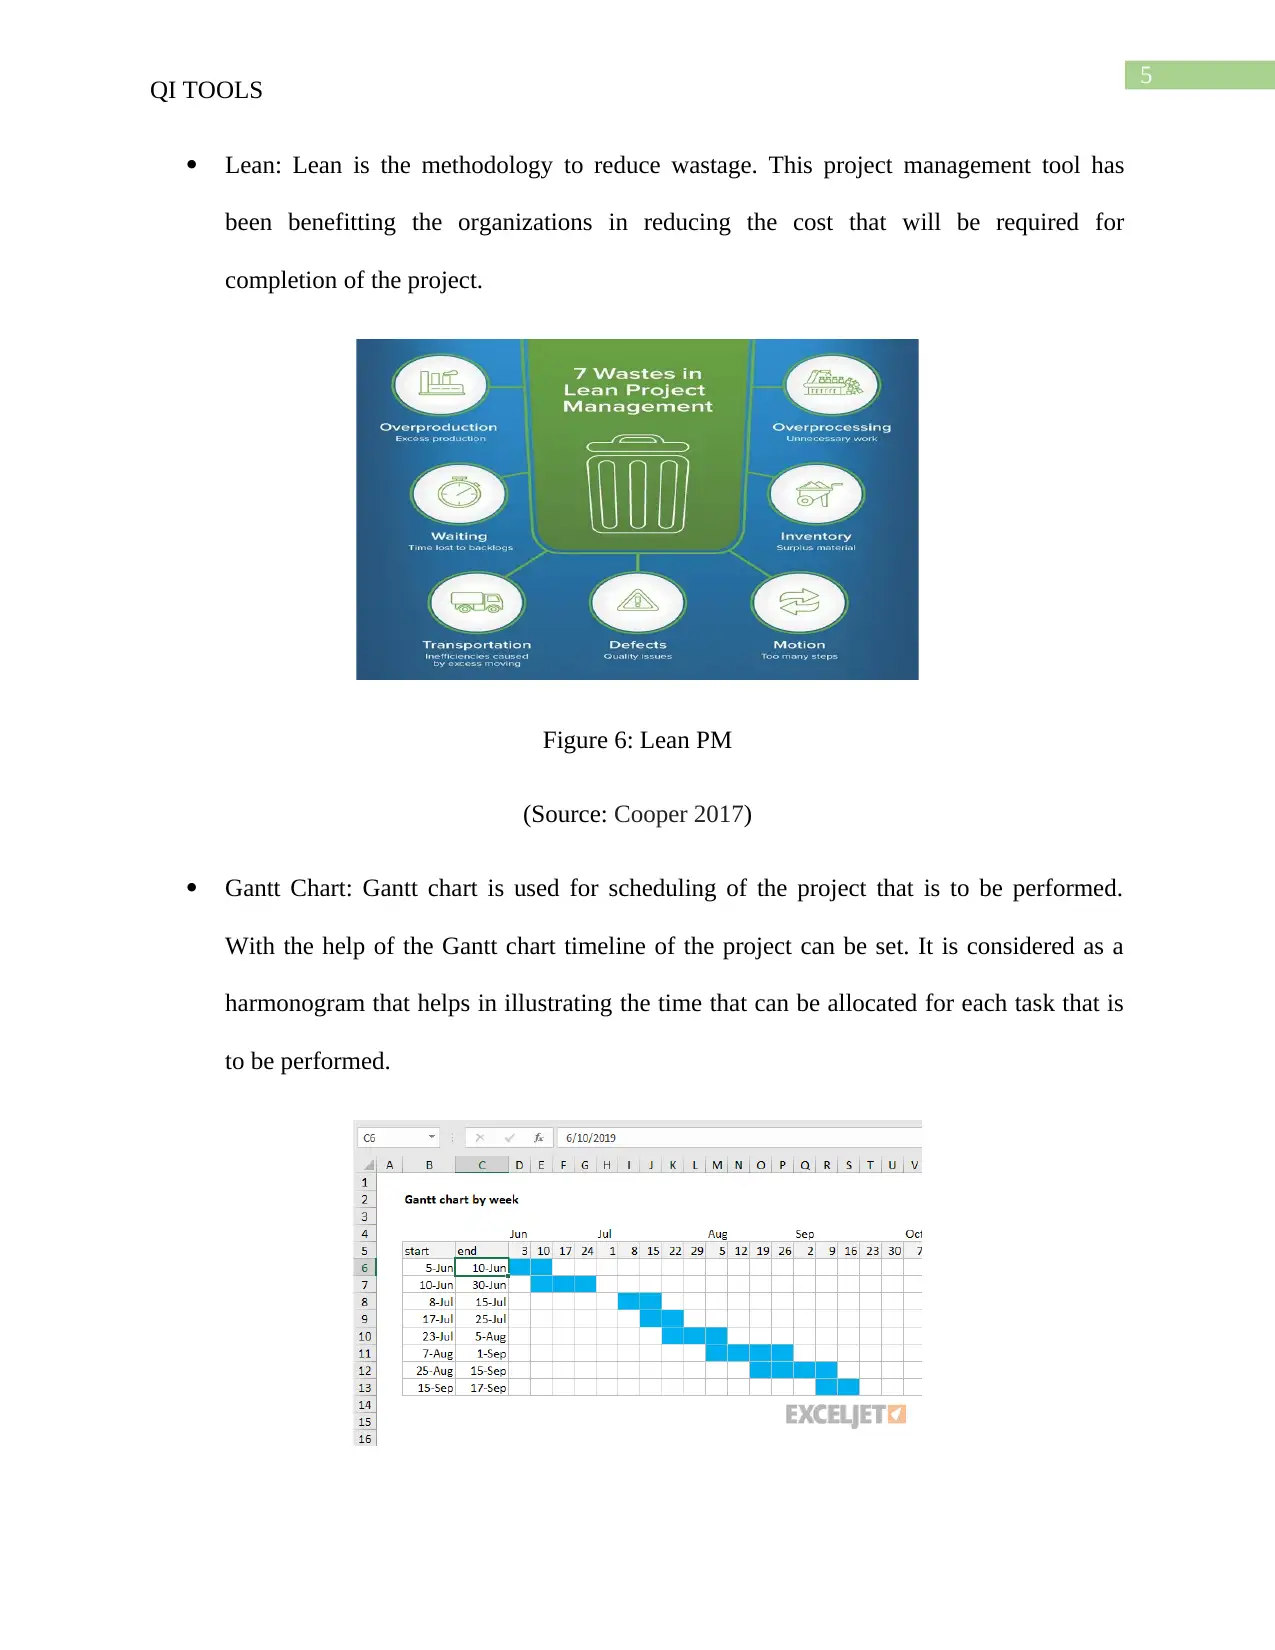
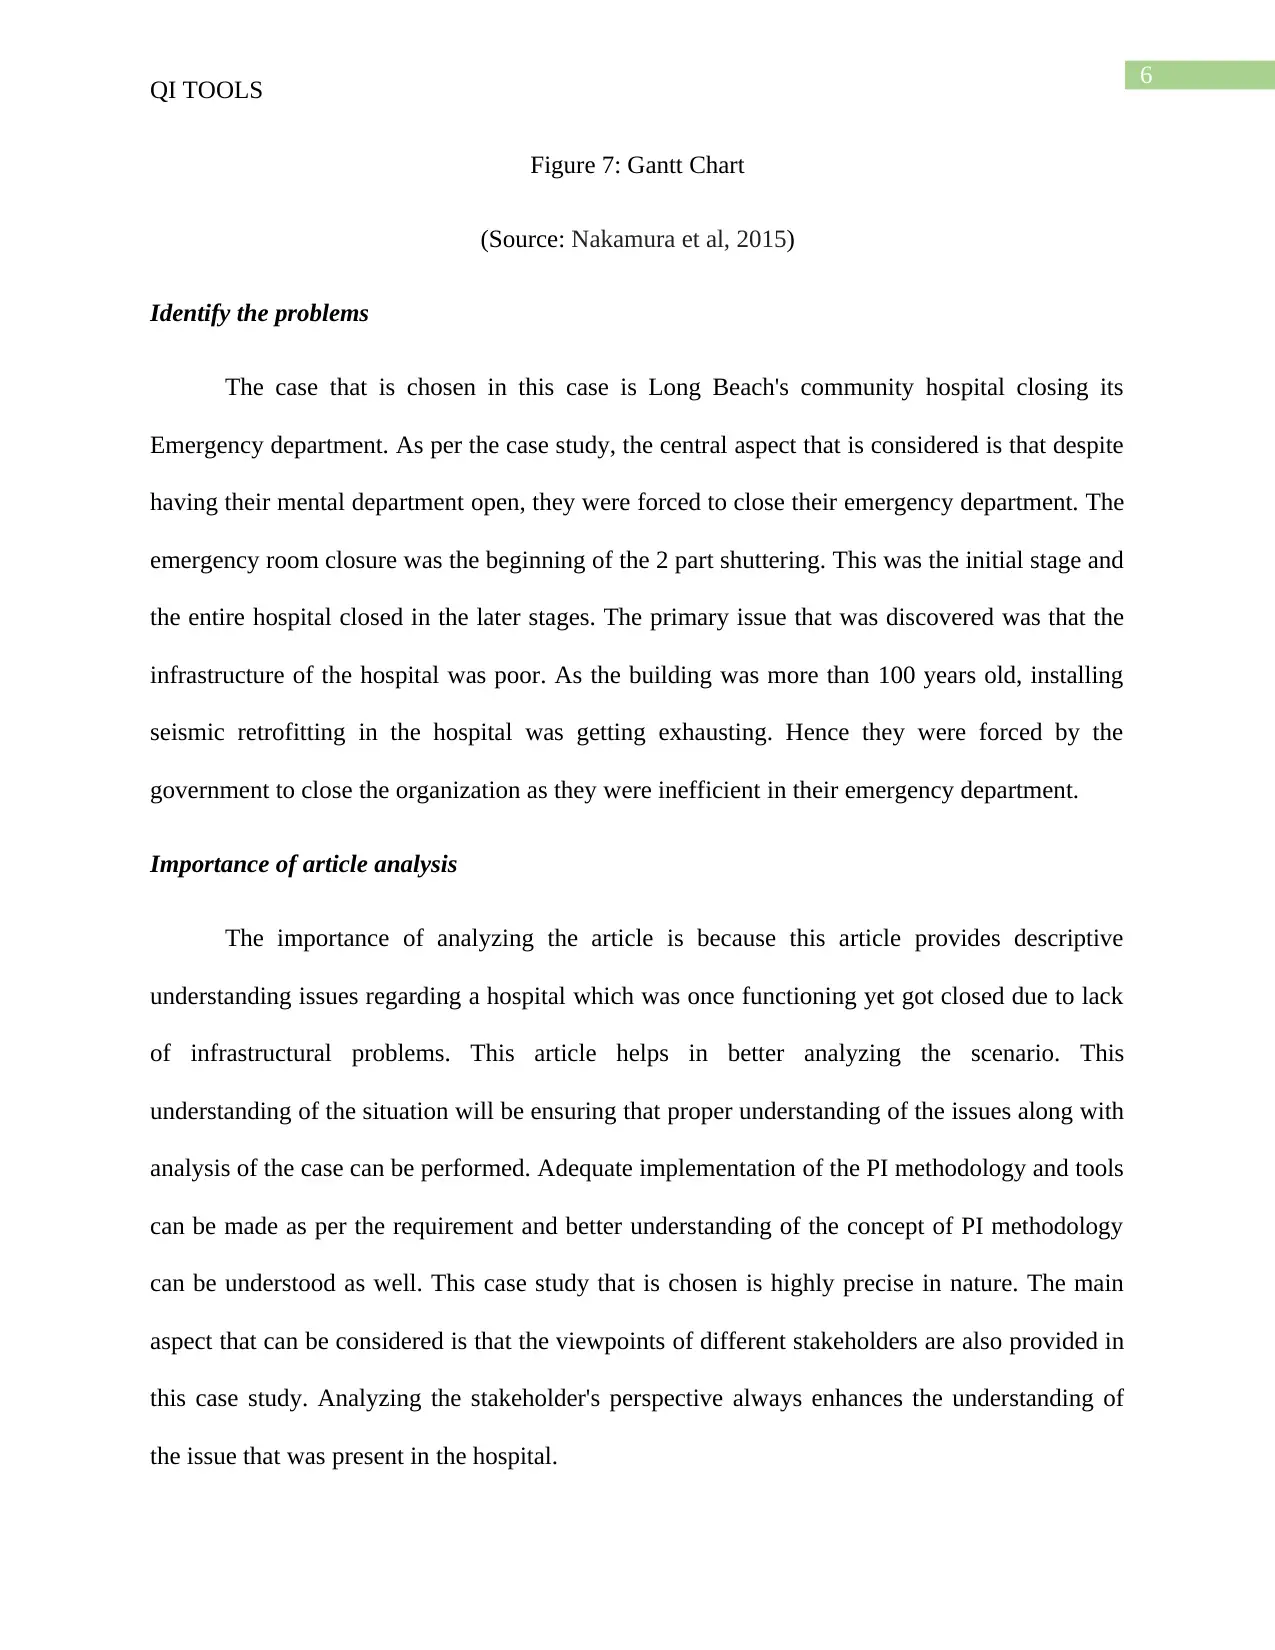
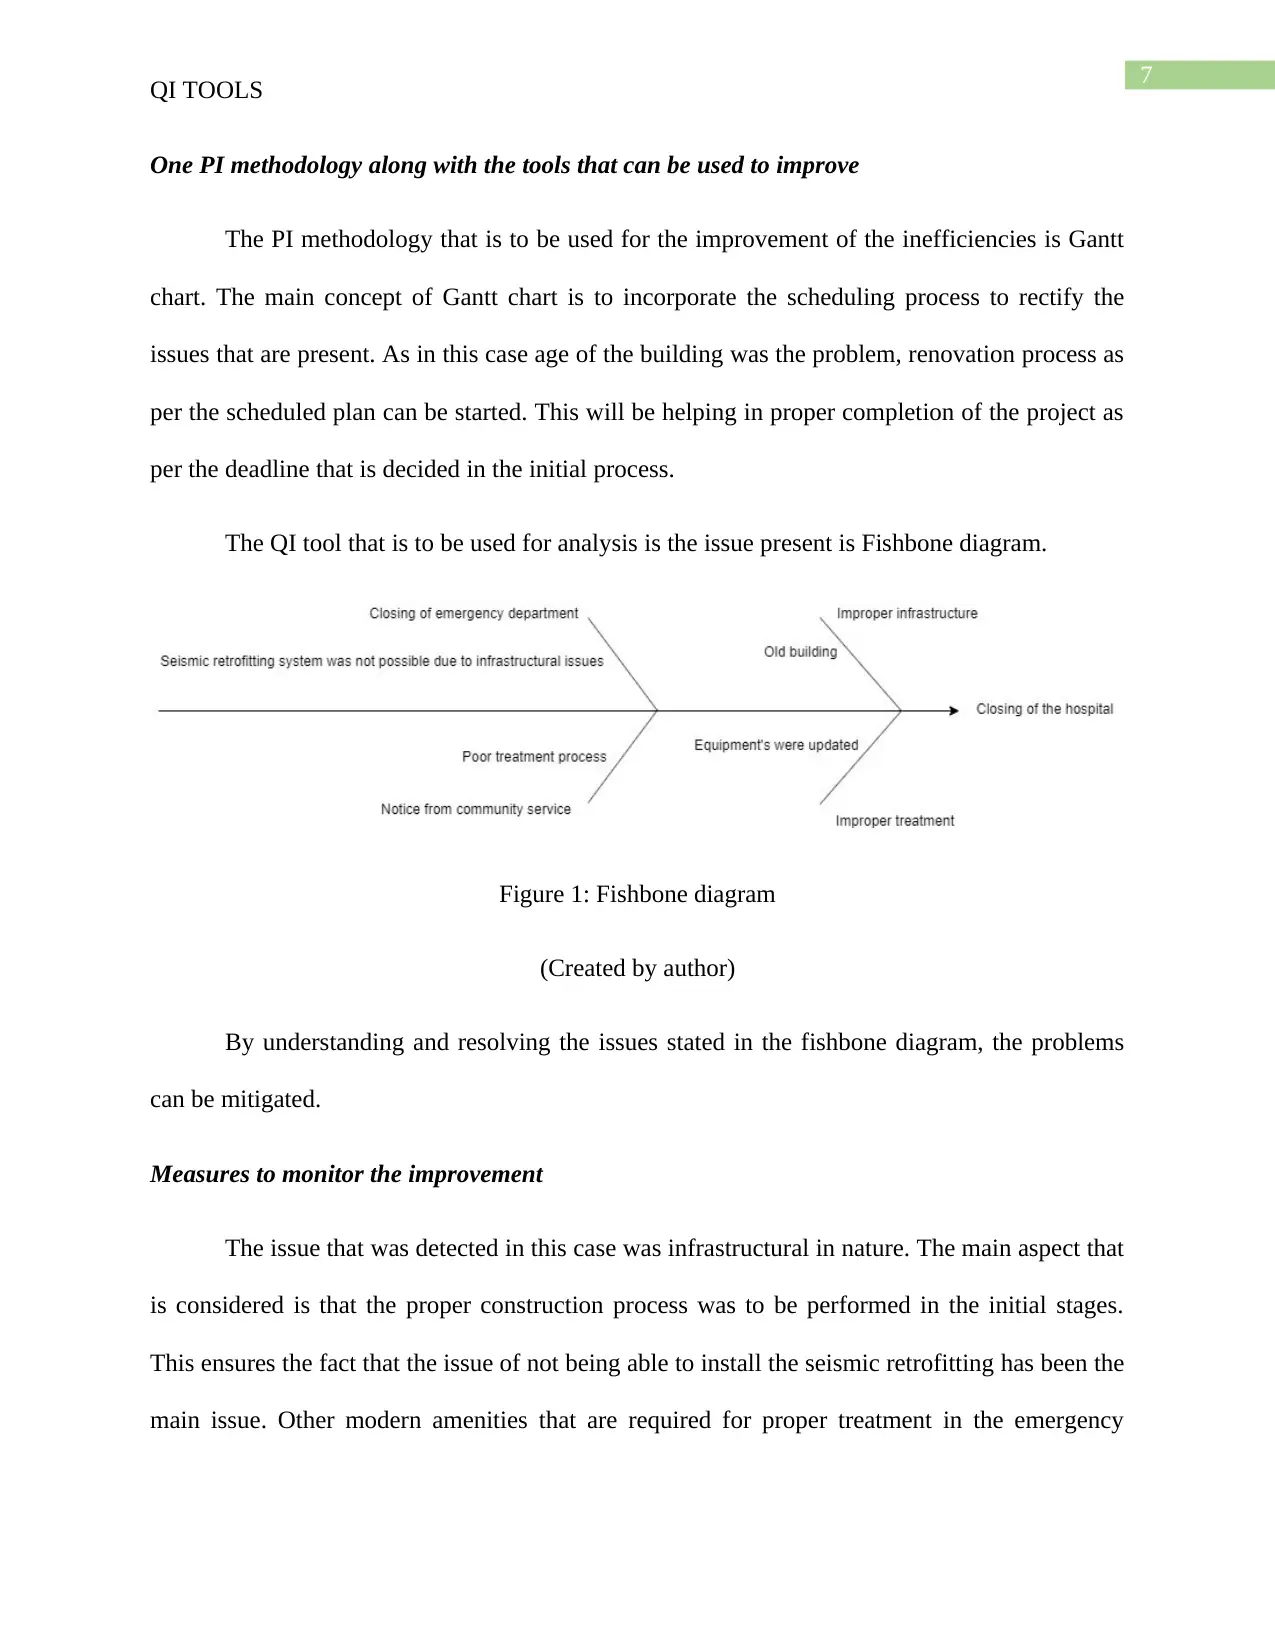
This case study examines the closure of Long Beach Community Hospital, focusing on the infrastructural issues that led to its shutdown. The analysis utilizes various Quality Improvement (QI) and Performance Improvement (PI) tools such as FMEA, SBAR, PDCA, Six Sigma, RCA, Lean, and Gantt charts to understand the problems and potential solutions. The primary issue identified was the hospital's aging infrastructure and the inability to implement necessary seismic retrofitting. The study emphasizes the importance of proactive planning and the application of QI methodologies, particularly the Gantt chart for scheduling renovations and the Fishbone diagram for root cause analysis. The case study concludes that proper initial planning and continuous improvement measures could have mitigated the issues, preventing the hospital's closure. The analysis also considers stakeholder perspectives, providing a comprehensive understanding of the challenges faced by the hospital.
Document Page
Running head: QI TOOLS
QI TOOLS
Name of the Student
Name of the University
Author note
tabler-icon-diamond-filled.svg

Paraphrase This Document

Need a fresh take? Get an instant paraphrase of this document with our AI Paraphraser
Document Page
1
QI TOOLS
Table of Contents
Introduction......................................................................................................................................2
Body.................................................................................................................................................2
Conclusion.......................................................................................................................................8
References........................................................................................................................................9
Document Page
2
QI TOOLS
Introduction
This discussion regarding problem detection process is important as with the help of this
discussion proper understanding of the PI tools as well as QI tools are understood. Hence
performing analysis will be getting easier and mitigation of the issues will also be performed.
Body
Brief Discussion of: -
FMEA: FMEA stands for Failure Modes Effects Analysis. This tool helps in
understanding the modes in which the project might fail. Hence this helps in bettering the
understanding of the failure modes. Effects analysis helps in a proper interpretation of the
failure.
Figure 1: FMEA
(Source: Safari, Faraji & Majidian 2016)
SBAR: SBAR stands for Situation, Background, Assessment and Recommendation. This
tool helps in better understanding of the entire scenario, which helps in bettering the
communication process.
Document Page
3
QI TOOLS
Figure 2: SBAR
PDCA PDCA (or PDSA): Plan do check act has is the complete sectioning of the tool. It
is also known as the Deming Cycle. Continuous improvement has been the primary goal
has been the main goal of this tool.
Figure 3: PDCA
(Source: Prashar 2017)
Six Sigma: Six Sigma is a statistical-based and data-based process which will be helping
in continuous improvement regarding the project. This is the main aspect that is
eliminating the defects that are present in the project.
tabler-icon-diamond-filled.svg

Paraphrase This Document

Need a fresh take? Get an instant paraphrase of this document with our AI Paraphraser
Document Page
4
QI TOOLS
Figure 4: Six Sigma
(Source: Jacobs, Swink & Linderman 2015)
RCA: Root Cause Analysis has been a significant tool which helps in better
understanding of the issue that is present in the project. The fundamental problem that
has been causing significant challenges to the project is detected and hence wise
resolving the issue gets easier.
Figure 5: RCA
(Source: Pham et al, 2016)
Document Page
5
QI TOOLS
Lean: Lean is the methodology to reduce wastage. This project management tool has
been benefitting the organizations in reducing the cost that will be required for
completion of the project.
Figure 6: Lean PM
(Source: Cooper 2017)
Gantt Chart: Gantt chart is used for scheduling of the project that is to be performed.
With the help of the Gantt chart timeline of the project can be set. It is considered as a
harmonogram that helps in illustrating the time that can be allocated for each task that is
to be performed.
Document Page
6
QI TOOLS
Figure 7: Gantt Chart
(Source: Nakamura et al, 2015)
Identify the problems
The case that is chosen in this case is Long Beach's community hospital closing its
Emergency department. As per the case study, the central aspect that is considered is that despite
having their mental department open, they were forced to close their emergency department. The
emergency room closure was the beginning of the 2 part shuttering. This was the initial stage and
the entire hospital closed in the later stages. The primary issue that was discovered was that the
infrastructure of the hospital was poor. As the building was more than 100 years old, installing
seismic retrofitting in the hospital was getting exhausting. Hence they were forced by the
government to close the organization as they were inefficient in their emergency department.
Importance of article analysis
The importance of analyzing the article is because this article provides descriptive
understanding issues regarding a hospital which was once functioning yet got closed due to lack
of infrastructural problems. This article helps in better analyzing the scenario. This
understanding of the situation will be ensuring that proper understanding of the issues along with
analysis of the case can be performed. Adequate implementation of the PI methodology and tools
can be made as per the requirement and better understanding of the concept of PI methodology
can be understood as well. This case study that is chosen is highly precise in nature. The main
aspect that can be considered is that the viewpoints of different stakeholders are also provided in
this case study. Analyzing the stakeholder's perspective always enhances the understanding of
the issue that was present in the hospital.
tabler-icon-diamond-filled.svg

Paraphrase This Document

Need a fresh take? Get an instant paraphrase of this document with our AI Paraphraser
Document Page
7
QI TOOLS
One PI methodology along with the tools that can be used to improve
The PI methodology that is to be used for the improvement of the inefficiencies is Gantt
chart. The main concept of Gantt chart is to incorporate the scheduling process to rectify the
issues that are present. As in this case age of the building was the problem, renovation process as
per the scheduled plan can be started. This will be helping in proper completion of the project as
per the deadline that is decided in the initial process.
The QI tool that is to be used for analysis is the issue present is Fishbone diagram.
Figure 1: Fishbone diagram
(Created by author)
By understanding and resolving the issues stated in the fishbone diagram, the problems
can be mitigated.
Measures to monitor the improvement
The issue that was detected in this case was infrastructural in nature. The main aspect that
is considered is that the proper construction process was to be performed in the initial stages.
This ensures the fact that the issue of not being able to install the seismic retrofitting has been the
main issue. Other modern amenities that are required for proper treatment in the emergency
Document Page
8
QI TOOLS
section was absent as well. Hence proper planning from the initial stages could have mitigated
the issue.
Conclusion
From the above discussion, the main aspect that is considered is that Long Beach's
community hospital has been closed down due to infrastructural issues. Usage of QI tools and PI
tools have been made for understanding the issues.
Document Page
9
QI TOOLS
References
Cooper, R. (2017). Supply chain development for the lean enterprise: interorganizational cost
management. Routledge.
Jacobs, B. W., Swink, M., & Linderman, K. (2015). Performance effects of early and late Six
Sigma adoptions. Journal of Operations Management, 36, 244-257.
Nakamura, S., Kaneko, K., Okada, Y., Yin, C., & Ogata, H. (2015). Cubic gantt chart as
visualization tool for learning activity data. In 23rd International Conference on
Computers in Education, ICCE 2015 (pp. 649-658). Asia-Pacific Society for Computers
in Education.
Pham, J. C., Hoffman, C., Popescu, I., Ijagbemi, O. M., & Carson, K. A. (2016). A tool for the
concise analysis of patient safety incidents. The Joint Commission Journal on Quality
and Patient Safety, 42(1), 26-AP3.
Prashar, A. (2017). Adopting PDCA (Plan-Do-Check-Act) cycle for energy optimization in
energy-intensive SMEs. Journal of cleaner production, 145, 277-293.
Safari, H., Faraji, Z., & Majidian, S. (2016). Identifying and evaluating enterprise architecture
risks using FMEA and fuzzy VIKOR. Journal of Intelligent Manufacturing, 27(2), 475-
486.
chevron_up_icon
1 out of 10
circle_padding
hide_on_mobile
zoom_out_icon
[object Object]