Financial Analysis of ASX Listed Organisation: QMS Media Report
VerifiedAdded on 2021/06/17
|14
|2276
|24
Report
AI Summary
This report conducts a financial evaluation of QMS Media Limited, an ASX-listed company providing out-of-home advertising and media services. The analysis assesses the company's financial statements over two years, focusing on key financial ratios such as current ratio, quick ratio, gross profit margin, return on equity, and return on assets. The study benchmarks QMS Media against its main competitors, Ooh Media Limited and APN Outdoor Group Limited, to provide a comparative performance analysis. The report indicates that APN Outdoor Group demonstrated superior financial performance. While QMS Media Limited presents potential investment opportunities, the report suggests that future returns might be limited. The analysis includes limitations related to the scope of the financial ratios and external economic factors. The report uses financial data from 2016 and 2017 to analyze the liquidity, profitability, and efficiency of QMS Media Limited and its competitors within the Australian market.
Running head: ACCOUNTING FOR BUSINESS
Accounting for Business
Name of the Student:
Name of the University:
Author’s Note:
Course ID:
Accounting for Business
Name of the Student:
Name of the University:
Author’s Note:
Course ID:
Paraphrase This Document
Need a fresh take? Get an instant paraphrase of this document with our AI Paraphraser
1ACCOUNTING FOR BUSINESS
Executive Summary:
The purpose of the report is to conduct financial evaluation of an ASX listed
organisation by assessing its financial statements for the previous two years. In this paper,
QMS Media Limited is chosen as the firm that provides out-of-home advertising and media
services in Australia and other global nations. In order to widen the scope of the report, the
financial condition of QMS Media Limited is compared with its two main rivals, Ooh Media
Limited and APN Outdoor Group Limited. It could be inferred that APN Outdoor Group is
the best performing company among the three organisations, as evaluated from the financial
analysis. Even though the investors could earn positive return on investment by investing in
the shares of QMS Media Limited, the returns might be minimised in future.
2ACCOUNTING FOR BUSINESS
Table of Contents
1.0 Introduction:.........................................................................................................................3
1.1 Purpose:............................................................................................................................3
1.2 Scope:...............................................................................................................................3
1.3 Limitations:......................................................................................................................3
2.0 Company overview of QMS Media Limited:......................................................................3
3.0 Ratio analysis:......................................................................................................................4
3.1 Current ratio:....................................................................................................................4
3.2 Quick ratio:.......................................................................................................................5
3.3 Gross profit margin:.........................................................................................................6
3.4 Return on equity:..............................................................................................................7
3.5 Return on assets:..............................................................................................................8
4.0 Analysis and comparison of QMS Media Limited with Ooh Media Limited and APN
Outdoor Group:..........................................................................................................................9
References:...............................................................................................................................13
⊘ This is a preview!⊘
Do you want full access?
Subscribe today to unlock all pages.
Trusted by 1+ million students worldwide
3ACCOUNTING FOR BUSINESS
1.0 Introduction:
1.1 Purpose:
The purpose of the report is to conduct financial evaluation of an ASX listed
organisation by assessing its financial statements for the previous two years. In this paper,
QMS Media Limited is chosen as the firm that provides out-of-home advertising and media
services in Australia and other global nations. The financial evaluation is carried out by
computing five various financial ratios for obtaining an overview of the present standing of
the firm in the operating market of Australia.
1.2 Scope:
In order to widen the scope of the report, the financial condition of QMS Media
Limited is compared with its two main rivals, Ooh Media Limited and APN Outdoor Group
Limited. Three ratios from the above five ratios are used for ascertaining the best performing
company in the market.
1.3 Limitations:
Since this report contains only analysis of certain financial ratios computed, such
ratios could only tell the past performance of the organisation. It would be difficult to predict
the future growth through these ratios, since they ignore the recessionary effects on the global
economy, variations in industrial trends and customer preferences. Moreover, the ratios
computed are for the past two years only, while consideration of another past three additional
years could have improved the analysis further.
2.0 Company overview of QMS Media Limited:
QMS Media Limited is one of the leading outdoor media companies in Australia and
New Zealand. It specialises in providing its clients and agency partners with new and
innovative advertising solutions throughout its premium outdoor media network
(Qmsmedia.com 2018). By using its portfolio of outstanding conventional and digital
billboards in large formats, offerings of exclusive street furniture along with opportunities of
ambient media, it is committed to provide its clients with flexible and tailored outdoor
solutions for delivering solutions. Thus, it provides its clients with engaging and inspiring
campaigns for their target audiences.
Paraphrase This Document
Need a fresh take? Get an instant paraphrase of this document with our AI Paraphraser
4ACCOUNTING FOR BUSINESS
3.0 Ratio analysis:
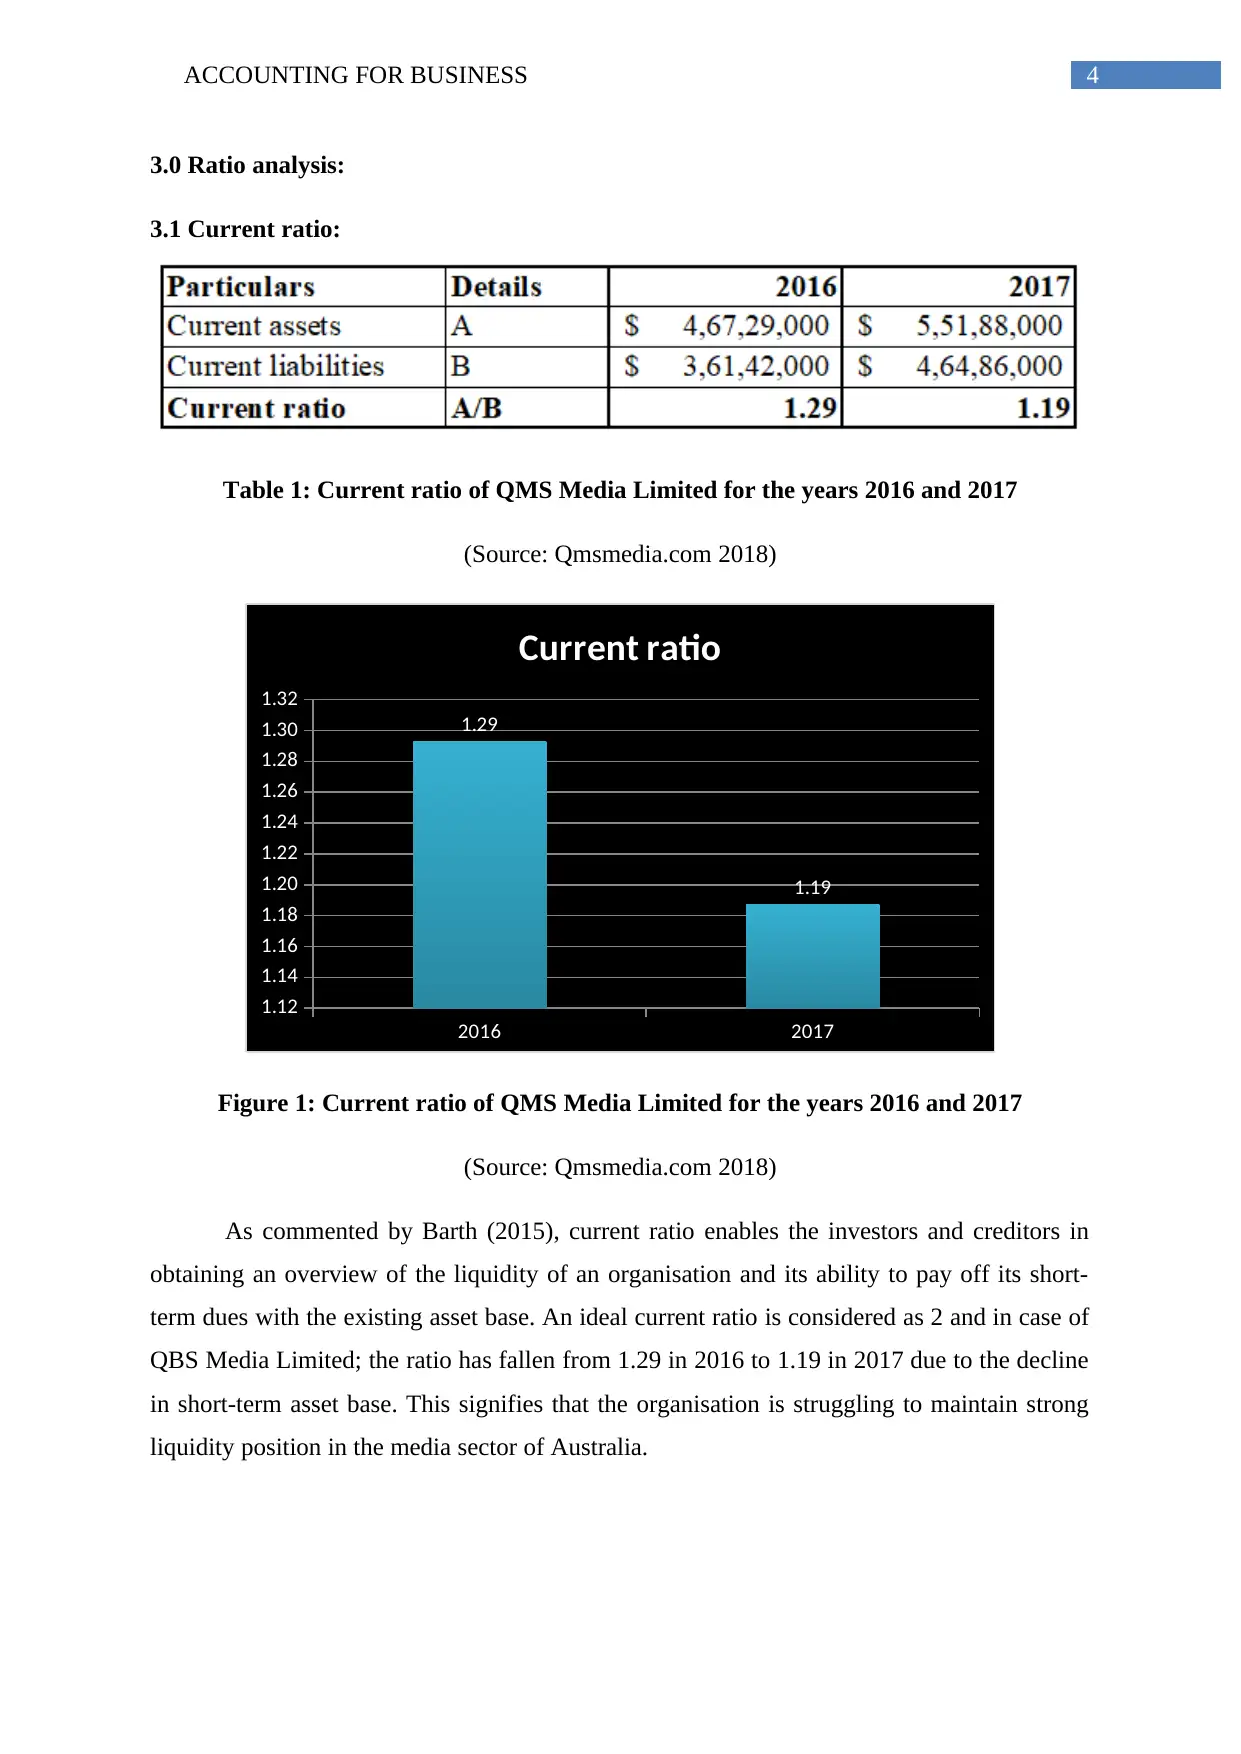
3.1 Current ratio:
Table 1: Current ratio of QMS Media Limited for the years 2016 and 2017
(Source: Qmsmedia.com 2018)
2016 2017
1.12
1.14
1.16
1.18
1.20
1.22
1.24
1.26
1.28
1.30
1.32
1.29
1.19
Current ratio
Figure 1: Current ratio of QMS Media Limited for the years 2016 and 2017
(Source: Qmsmedia.com 2018)
As commented by Barth (2015), current ratio enables the investors and creditors in
obtaining an overview of the liquidity of an organisation and its ability to pay off its short-
term dues with the existing asset base. An ideal current ratio is considered as 2 and in case of
QBS Media Limited; the ratio has fallen from 1.29 in 2016 to 1.19 in 2017 due to the decline
in short-term asset base. This signifies that the organisation is struggling to maintain strong
liquidity position in the media sector of Australia.
3.0 Ratio analysis:
3.1 Current ratio:
Table 1: Current ratio of QMS Media Limited for the years 2016 and 2017
(Source: Qmsmedia.com 2018)
2016 2017
1.12
1.14
1.16
1.18
1.20
1.22
1.24
1.26
1.28
1.30
1.32
1.29
1.19
Current ratio
Figure 1: Current ratio of QMS Media Limited for the years 2016 and 2017
(Source: Qmsmedia.com 2018)
As commented by Barth (2015), current ratio enables the investors and creditors in
obtaining an overview of the liquidity of an organisation and its ability to pay off its short-
term dues with the existing asset base. An ideal current ratio is considered as 2 and in case of
QBS Media Limited; the ratio has fallen from 1.29 in 2016 to 1.19 in 2017 due to the decline
in short-term asset base. This signifies that the organisation is struggling to maintain strong
liquidity position in the media sector of Australia.
5ACCOUNTING FOR BUSINESS
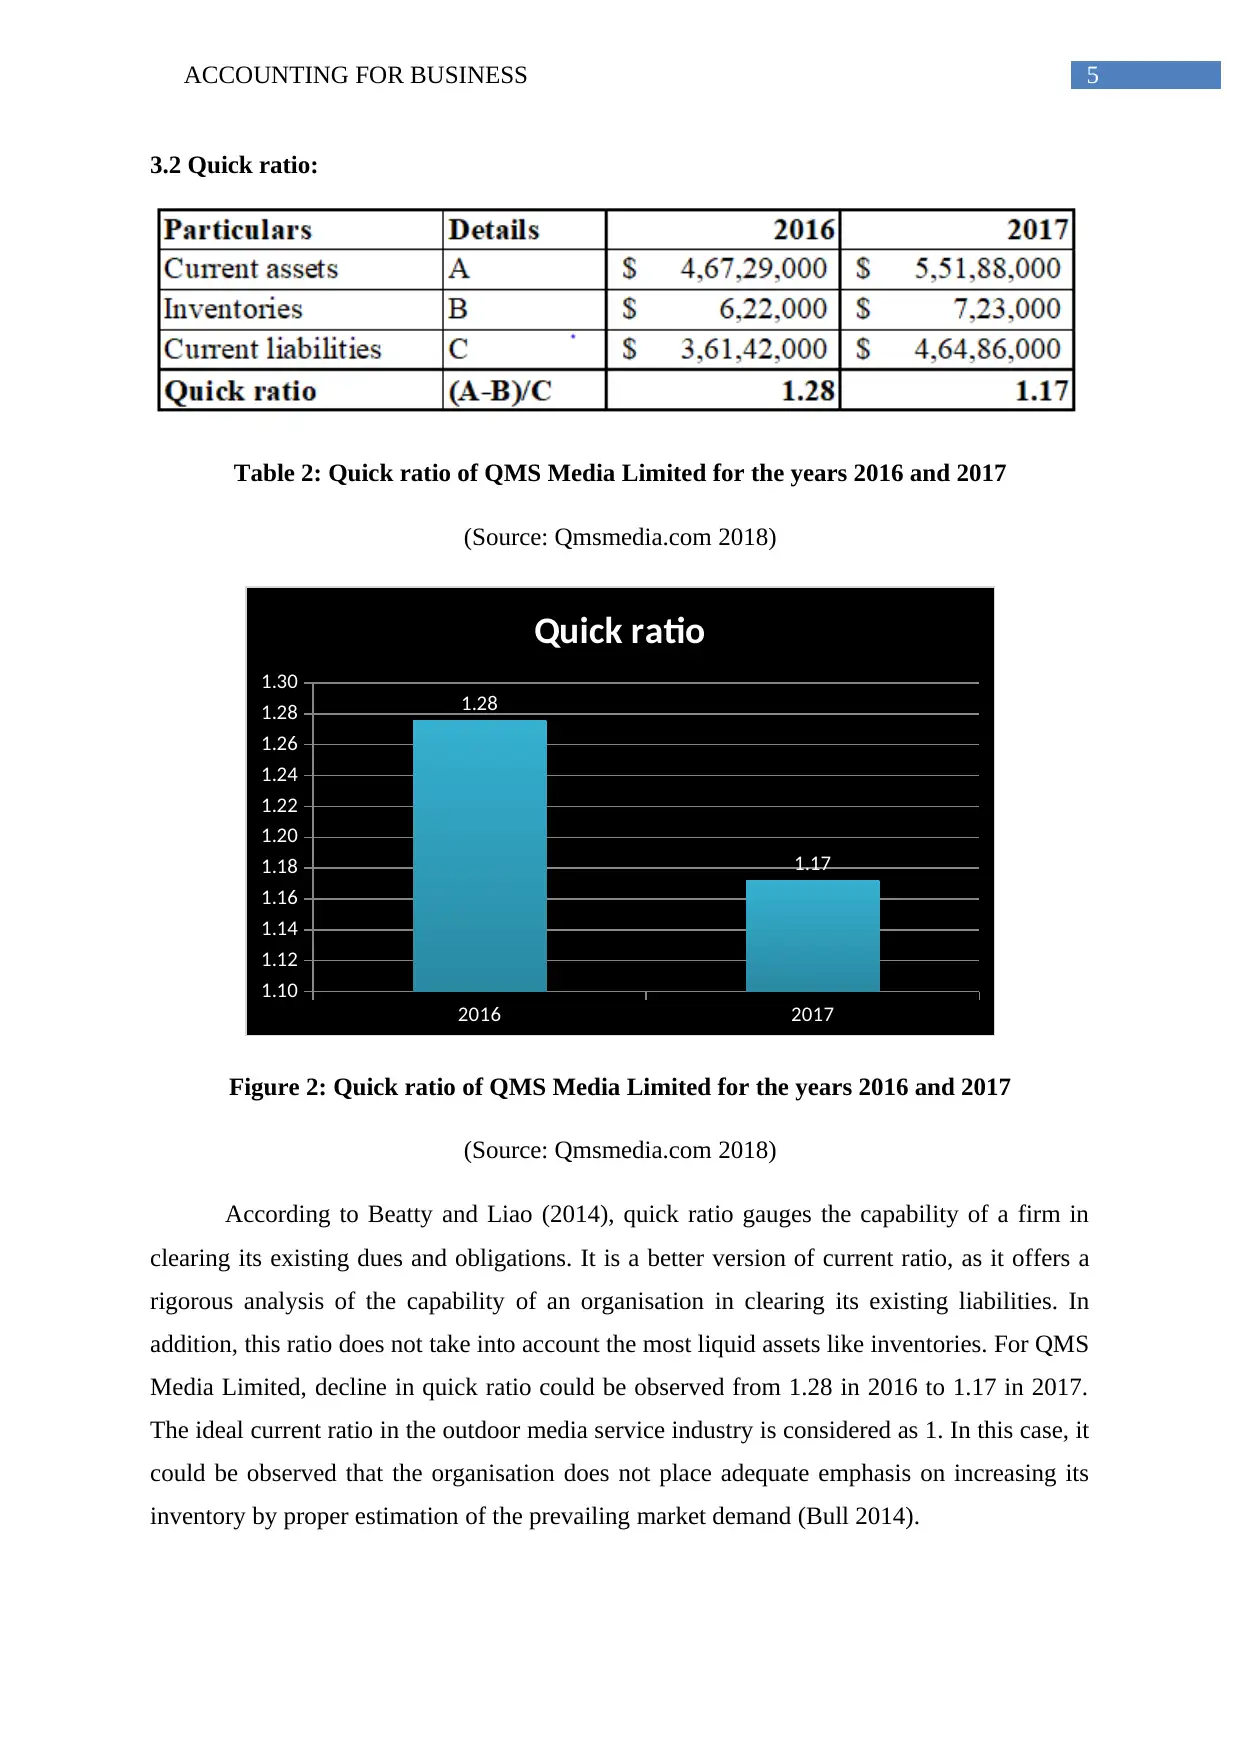
3.2 Quick ratio:
Table 2: Quick ratio of QMS Media Limited for the years 2016 and 2017
(Source: Qmsmedia.com 2018)
2016 2017
1.10
1.12
1.14
1.16
1.18
1.20
1.22
1.24
1.26
1.28
1.30
1.28
1.17
Quick ratio
Figure 2: Quick ratio of QMS Media Limited for the years 2016 and 2017
(Source: Qmsmedia.com 2018)
According to Beatty and Liao (2014), quick ratio gauges the capability of a firm in
clearing its existing dues and obligations. It is a better version of current ratio, as it offers a
rigorous analysis of the capability of an organisation in clearing its existing liabilities. In
addition, this ratio does not take into account the most liquid assets like inventories. For QMS
Media Limited, decline in quick ratio could be observed from 1.28 in 2016 to 1.17 in 2017.
The ideal current ratio in the outdoor media service industry is considered as 1. In this case, it
could be observed that the organisation does not place adequate emphasis on increasing its
inventory by proper estimation of the prevailing market demand (Bull 2014).
⊘ This is a preview!⊘
Do you want full access?
Subscribe today to unlock all pages.
Trusted by 1+ million students worldwide
6ACCOUNTING FOR BUSINESS
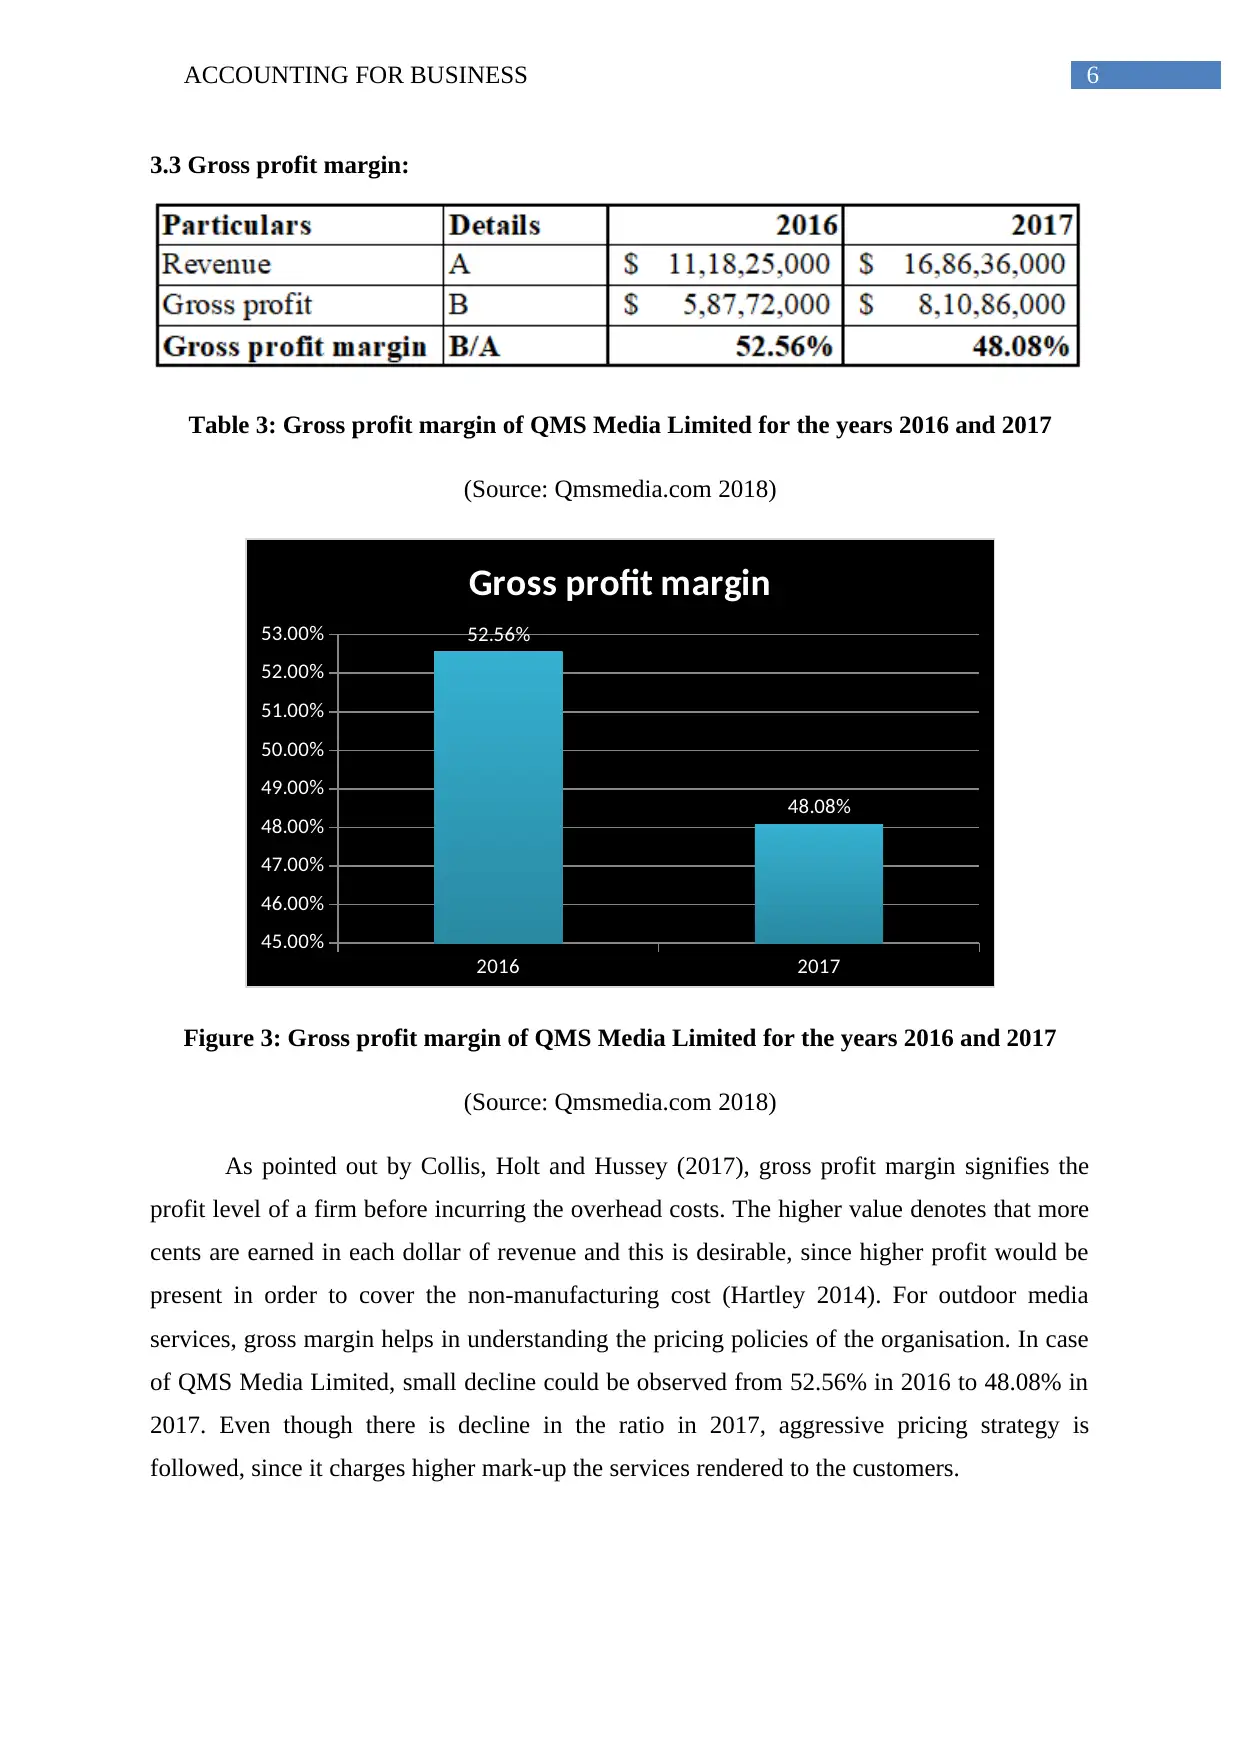
3.3 Gross profit margin:
Table 3: Gross profit margin of QMS Media Limited for the years 2016 and 2017
(Source: Qmsmedia.com 2018)
2016 2017
45.00%
46.00%
47.00%
48.00%
49.00%
50.00%
51.00%
52.00%
53.00% 52.56%
48.08%
Gross profit margin
Figure 3: Gross profit margin of QMS Media Limited for the years 2016 and 2017
(Source: Qmsmedia.com 2018)
As pointed out by Collis, Holt and Hussey (2017), gross profit margin signifies the
profit level of a firm before incurring the overhead costs. The higher value denotes that more
cents are earned in each dollar of revenue and this is desirable, since higher profit would be
present in order to cover the non-manufacturing cost (Hartley 2014). For outdoor media
services, gross margin helps in understanding the pricing policies of the organisation. In case
of QMS Media Limited, small decline could be observed from 52.56% in 2016 to 48.08% in
2017. Even though there is decline in the ratio in 2017, aggressive pricing strategy is
followed, since it charges higher mark-up the services rendered to the customers.
Paraphrase This Document
Need a fresh take? Get an instant paraphrase of this document with our AI Paraphraser
7ACCOUNTING FOR BUSINESS
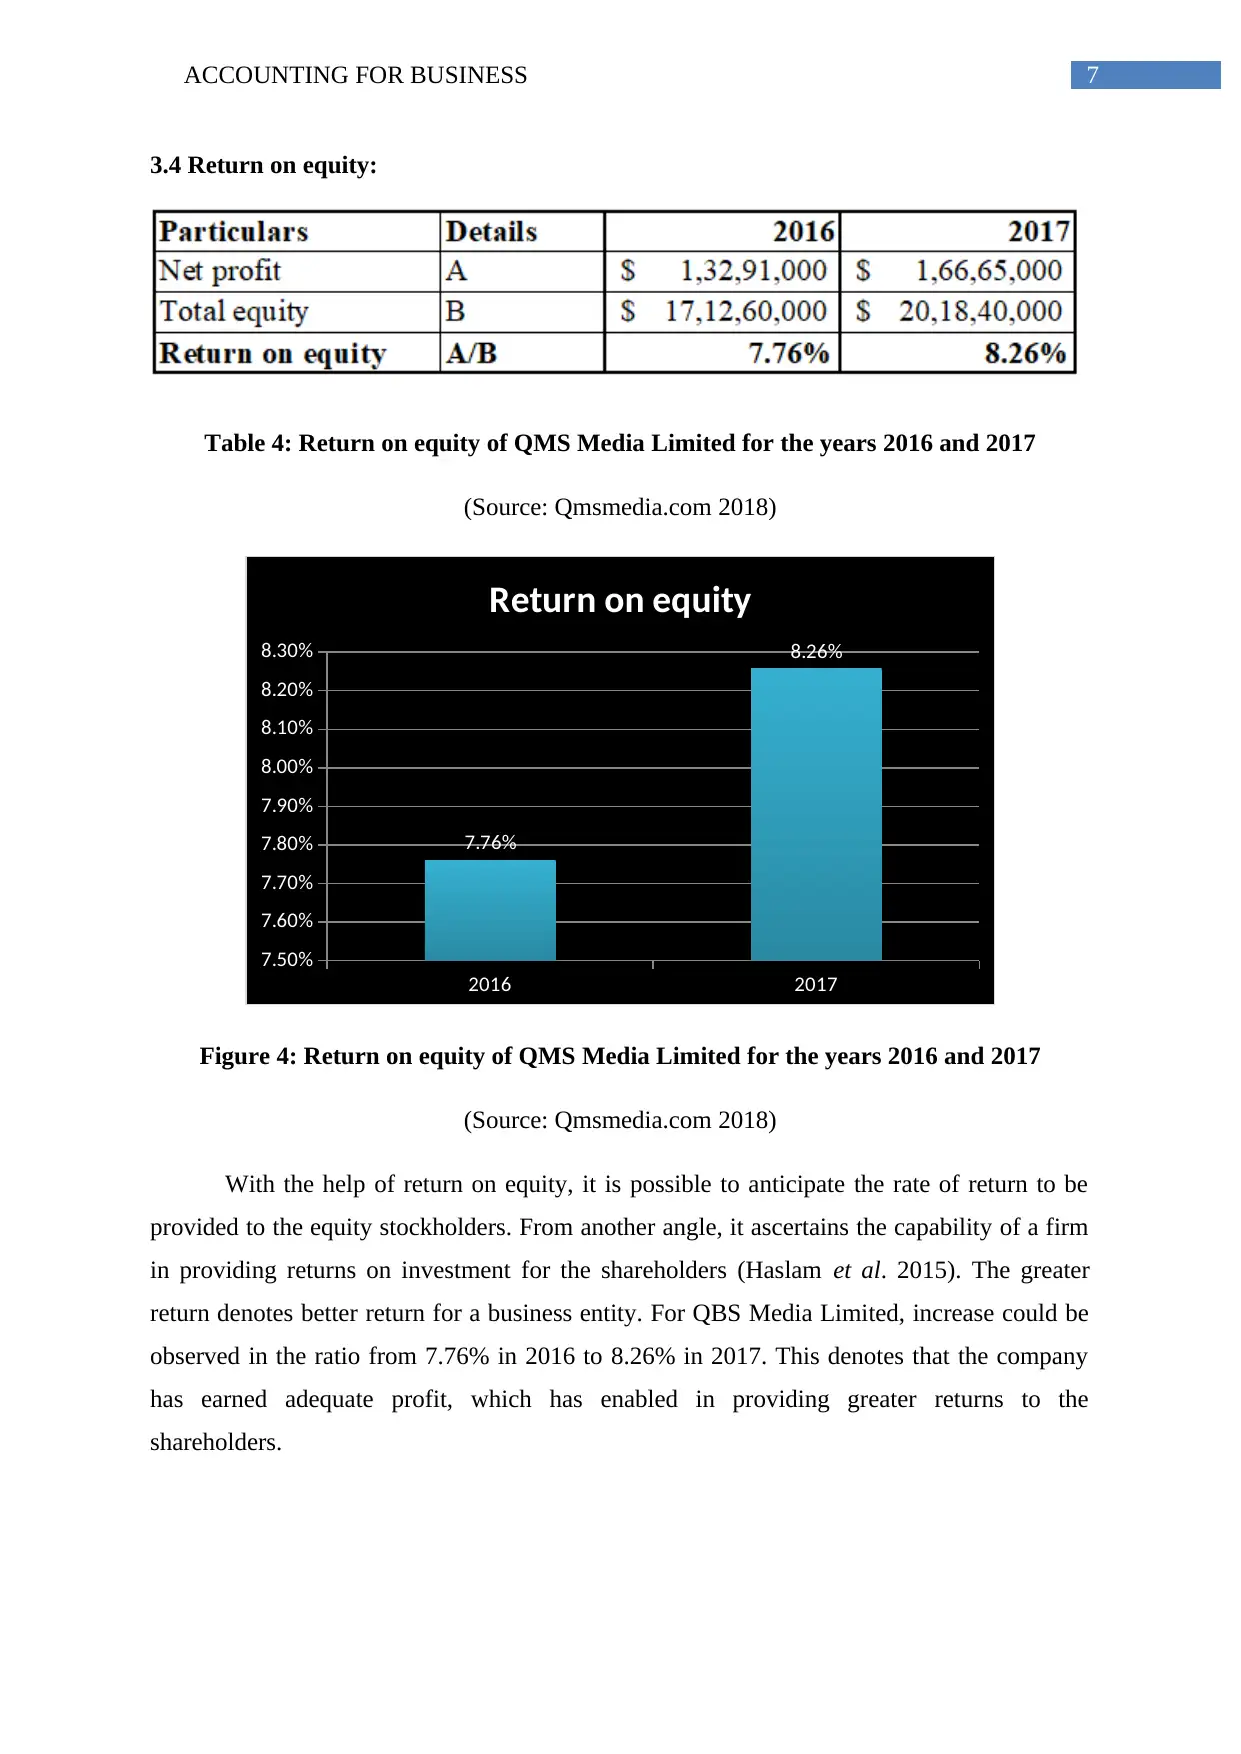
3.4 Return on equity:
Table 4: Return on equity of QMS Media Limited for the years 2016 and 2017
(Source: Qmsmedia.com 2018)
2016 2017
7.50%
7.60%
7.70%
7.80%
7.90%
8.00%
8.10%
8.20%
8.30%
7.76%
8.26%
Return on equity
Figure 4: Return on equity of QMS Media Limited for the years 2016 and 2017
(Source: Qmsmedia.com 2018)
With the help of return on equity, it is possible to anticipate the rate of return to be
provided to the equity stockholders. From another angle, it ascertains the capability of a firm
in providing returns on investment for the shareholders (Haslam et al. 2015). The greater
return denotes better return for a business entity. For QBS Media Limited, increase could be
observed in the ratio from 7.76% in 2016 to 8.26% in 2017. This denotes that the company
has earned adequate profit, which has enabled in providing greater returns to the
shareholders.
8ACCOUNTING FOR BUSINESS
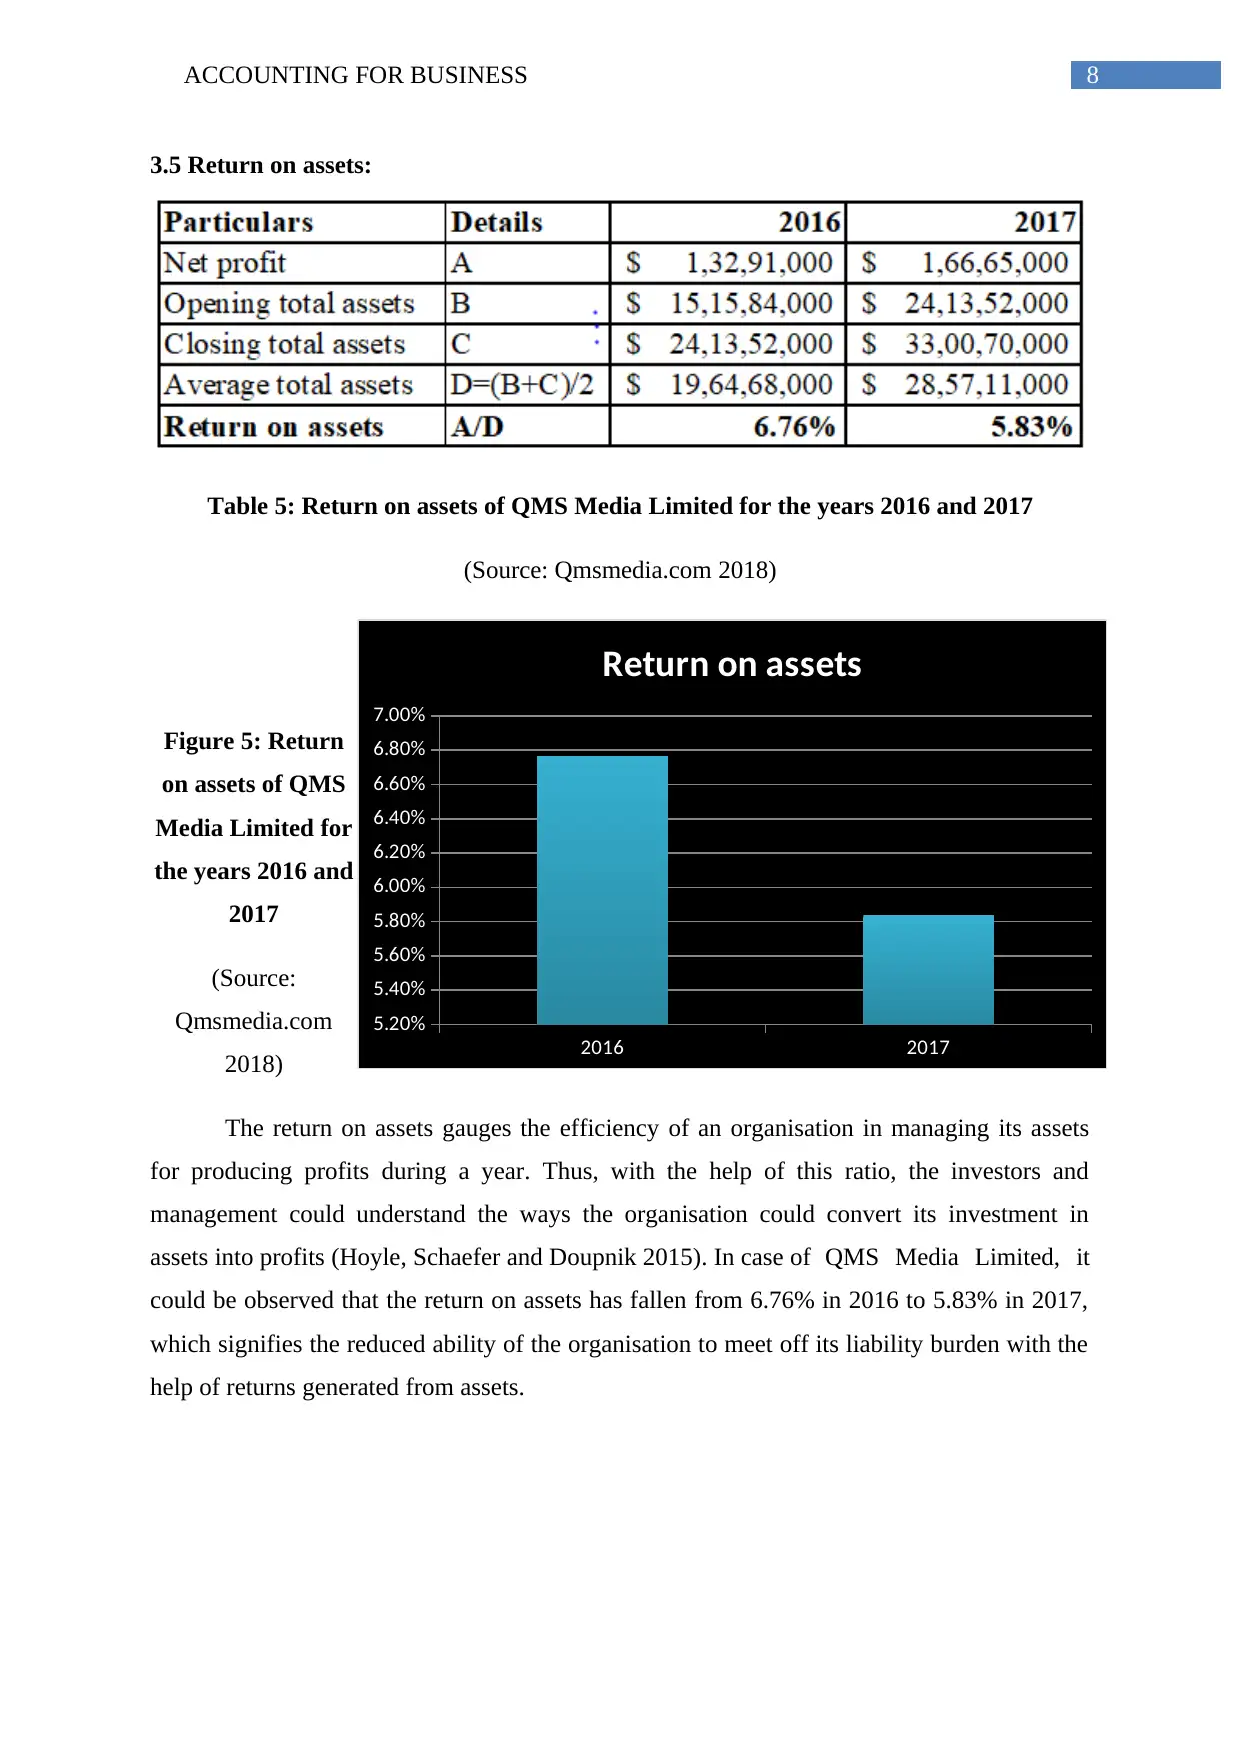
3.5 Return on assets:
Table 5: Return on assets of QMS Media Limited for the years 2016 and 2017
(Source: Qmsmedia.com 2018)
Figure 5: Return
on assets of QMS
Media Limited for
the years 2016 and
2017
(Source:
Qmsmedia.com
2018)
The return on assets gauges the efficiency of an organisation in managing its assets
for producing profits during a year. Thus, with the help of this ratio, the investors and
management could understand the ways the organisation could convert its investment in
assets into profits (Hoyle, Schaefer and Doupnik 2015). In case of QMS Media Limited, it
could be observed that the return on assets has fallen from 6.76% in 2016 to 5.83% in 2017,
which signifies the reduced ability of the organisation to meet off its liability burden with the
help of returns generated from assets.
2016 2017
5.20%
5.40%
5.60%
5.80%
6.00%
6.20%
6.40%
6.60%
6.80%
7.00%
6.76%
5.83%
Return on assets
⊘ This is a preview!⊘
Do you want full access?
Subscribe today to unlock all pages.
Trusted by 1+ million students worldwide
9ACCOUNTING FOR BUSINESS
4.0 Analysis and comparison of QMS Media Limited with Ooh Media Limited and APN
Outdoor Group:
For assessing the financial performance of QMS Media Limited, the results obtained
in the above section are compared with those of Ooh Media Limited and APN Outdoor
Group, which are the key competitors of the organisation in the Australian market. Both these
organisation provide outdoor media services and the following ratios are considered, which
are demonstrated as follows:
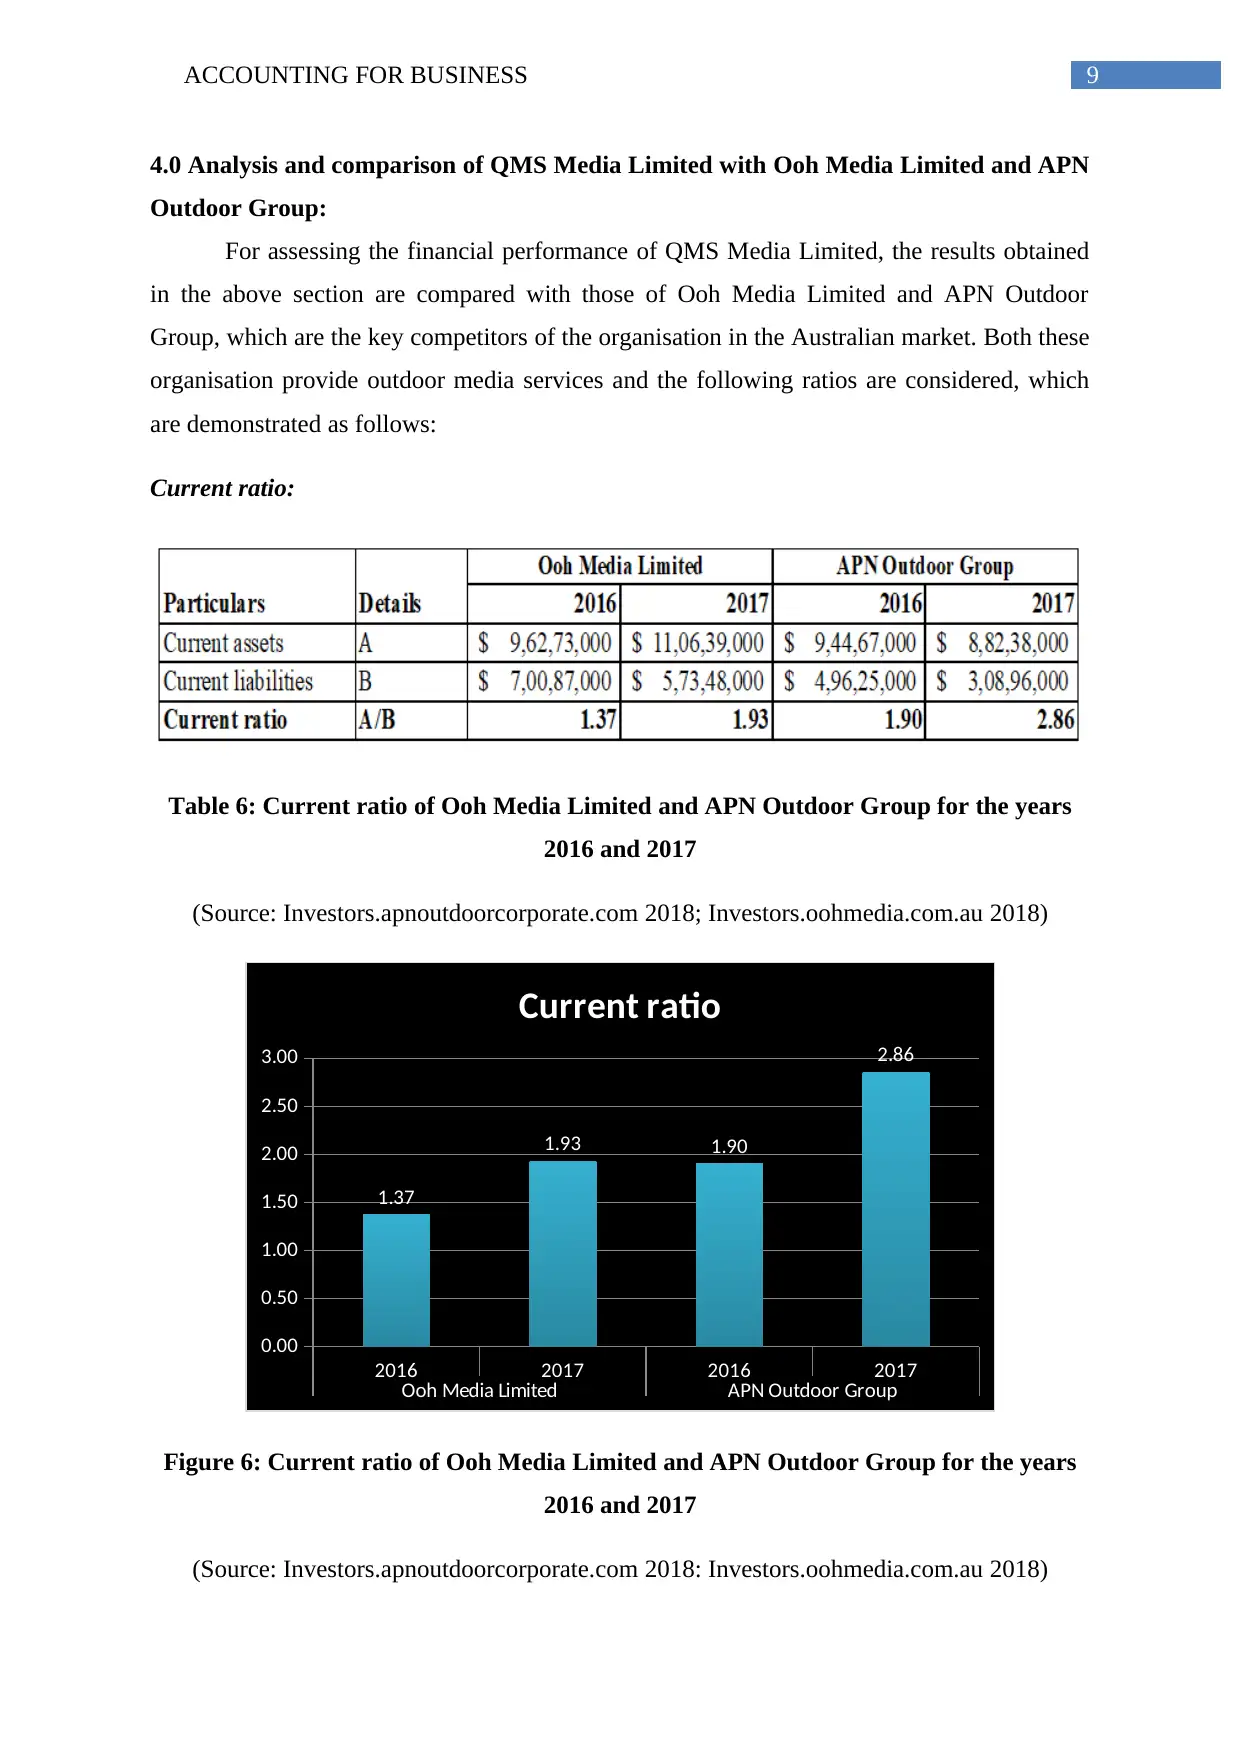
Current ratio:
Table 6: Current ratio of Ooh Media Limited and APN Outdoor Group for the years
2016 and 2017
(Source: Investors.apnoutdoorcorporate.com 2018; Investors.oohmedia.com.au 2018)
2016 2017 2016 2017
Ooh Media Limited APN Outdoor Group
0.00
0.50
1.00
1.50
2.00
2.50
3.00
1.37
1.93 1.90
2.86
Current ratio
Figure 6: Current ratio of Ooh Media Limited and APN Outdoor Group for the years
2016 and 2017
(Source: Investors.apnoutdoorcorporate.com 2018: Investors.oohmedia.com.au 2018)
4.0 Analysis and comparison of QMS Media Limited with Ooh Media Limited and APN
Outdoor Group:
For assessing the financial performance of QMS Media Limited, the results obtained
in the above section are compared with those of Ooh Media Limited and APN Outdoor
Group, which are the key competitors of the organisation in the Australian market. Both these
organisation provide outdoor media services and the following ratios are considered, which
are demonstrated as follows:
Current ratio:
Table 6: Current ratio of Ooh Media Limited and APN Outdoor Group for the years
2016 and 2017
(Source: Investors.apnoutdoorcorporate.com 2018; Investors.oohmedia.com.au 2018)
2016 2017 2016 2017
Ooh Media Limited APN Outdoor Group
0.00
0.50
1.00
1.50
2.00
2.50
3.00
1.37
1.93 1.90
2.86
Current ratio
Figure 6: Current ratio of Ooh Media Limited and APN Outdoor Group for the years
2016 and 2017
(Source: Investors.apnoutdoorcorporate.com 2018: Investors.oohmedia.com.au 2018)
Paraphrase This Document
Need a fresh take? Get an instant paraphrase of this document with our AI Paraphraser
10ACCOUNTING FOR BUSINESS
The above figure clearly inherits the fact that the current ratio for both the
organisations have increased significantly for both the organisations A higher ratio above 2
indicates that there is adequate amount of idle working capital and in case of APN Outdoor
Group, it has restricted its ability to reinvest in business operations or expansion of capital
projects., while Ooh Media Limited is enjoying better position in the market (Warren and
Jones 2018).
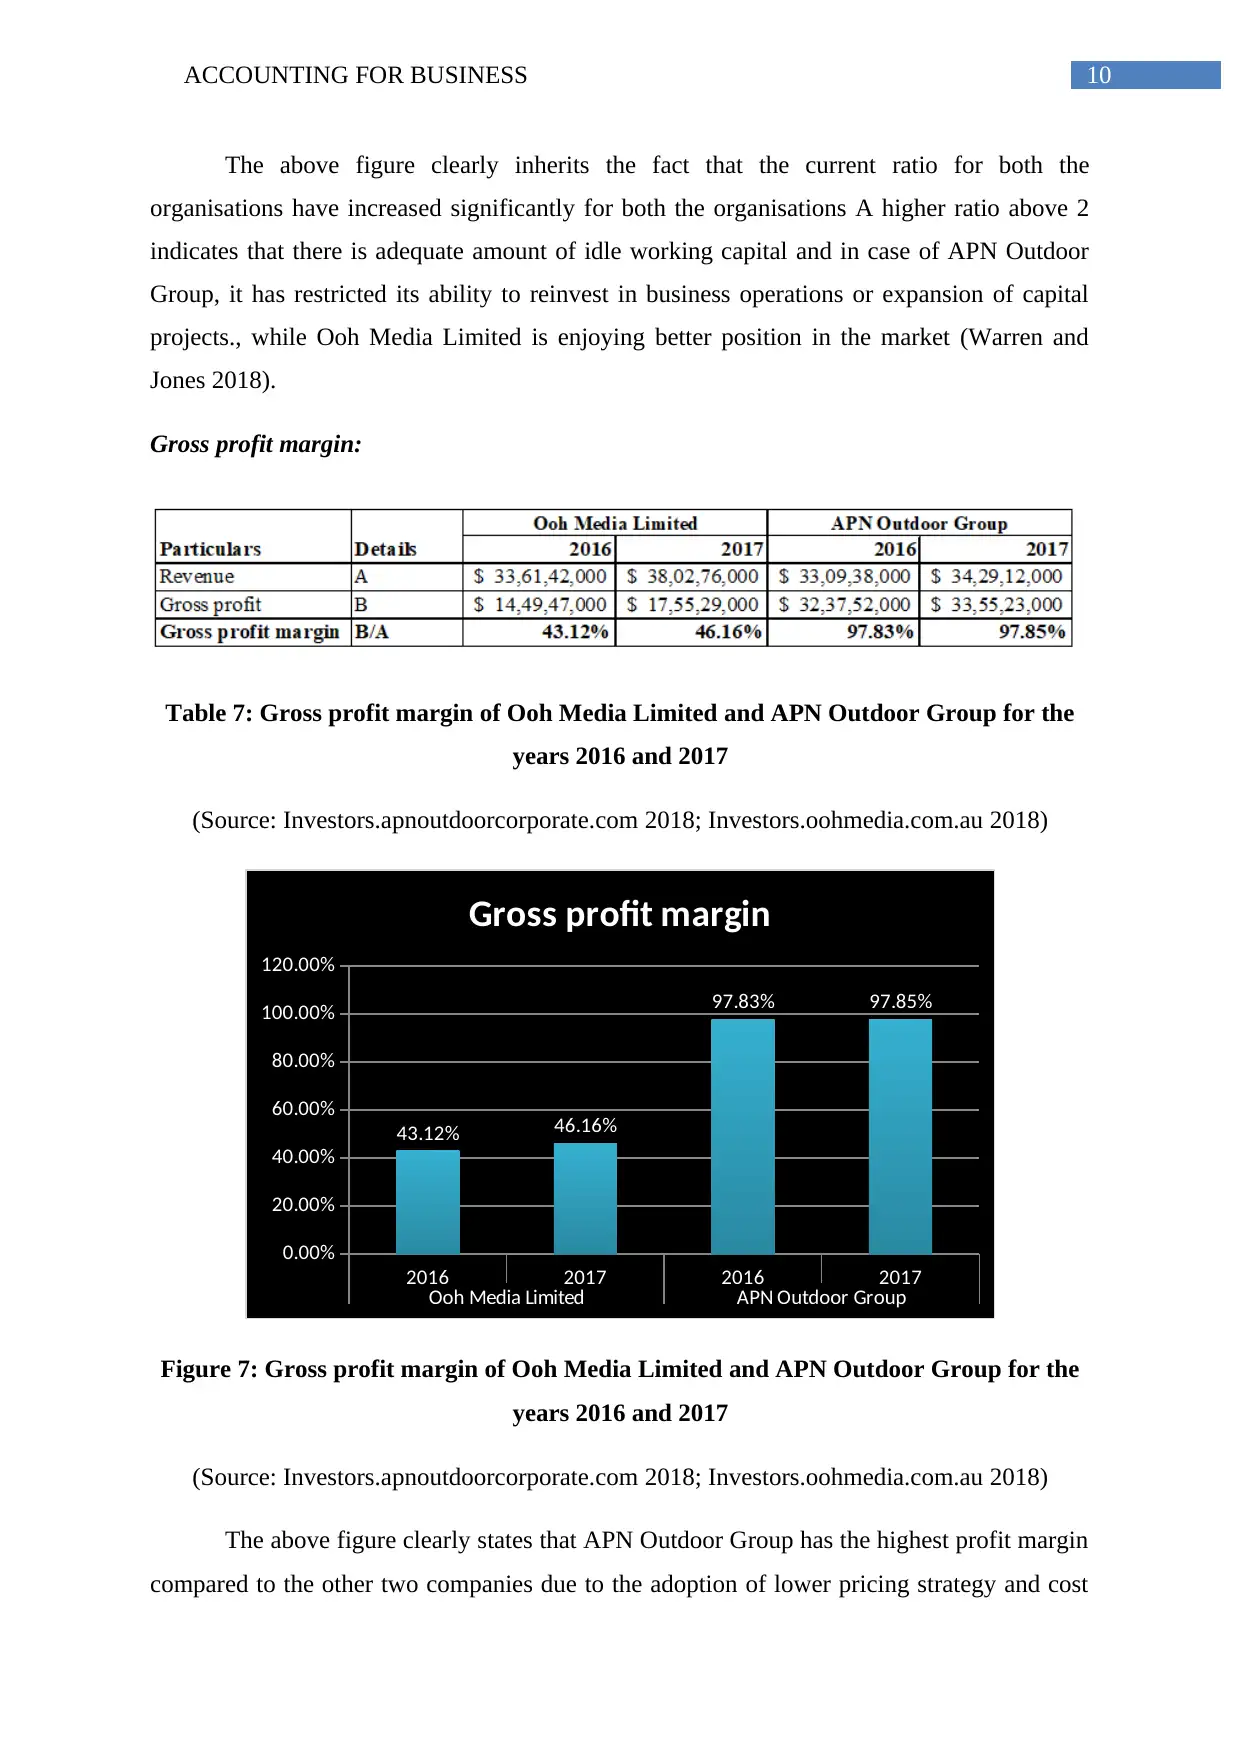
Gross profit margin:
Table 7: Gross profit margin of Ooh Media Limited and APN Outdoor Group for the
years 2016 and 2017
(Source: Investors.apnoutdoorcorporate.com 2018; Investors.oohmedia.com.au 2018)
2016 2017 2016 2017
Ooh Media Limited APN Outdoor Group
0.00%
20.00%
40.00%
60.00%
80.00%
100.00%
120.00%
43.12% 46.16%
97.83% 97.85%
Gross profit margin
Figure 7: Gross profit margin of Ooh Media Limited and APN Outdoor Group for the
years 2016 and 2017
(Source: Investors.apnoutdoorcorporate.com 2018; Investors.oohmedia.com.au 2018)
The above figure clearly states that APN Outdoor Group has the highest profit margin
compared to the other two companies due to the adoption of lower pricing strategy and cost
The above figure clearly inherits the fact that the current ratio for both the
organisations have increased significantly for both the organisations A higher ratio above 2
indicates that there is adequate amount of idle working capital and in case of APN Outdoor
Group, it has restricted its ability to reinvest in business operations or expansion of capital
projects., while Ooh Media Limited is enjoying better position in the market (Warren and
Jones 2018).
Gross profit margin:
Table 7: Gross profit margin of Ooh Media Limited and APN Outdoor Group for the
years 2016 and 2017
(Source: Investors.apnoutdoorcorporate.com 2018; Investors.oohmedia.com.au 2018)
2016 2017 2016 2017
Ooh Media Limited APN Outdoor Group
0.00%
20.00%
40.00%
60.00%
80.00%
100.00%
120.00%
43.12% 46.16%
97.83% 97.85%
Gross profit margin
Figure 7: Gross profit margin of Ooh Media Limited and APN Outdoor Group for the
years 2016 and 2017
(Source: Investors.apnoutdoorcorporate.com 2018; Investors.oohmedia.com.au 2018)
The above figure clearly states that APN Outdoor Group has the highest profit margin
compared to the other two companies due to the adoption of lower pricing strategy and cost
11ACCOUNTING FOR BUSINESS
of revenue. In addition, such higher margin has enabled the organisation in covering up its
overhead expenses effectively.
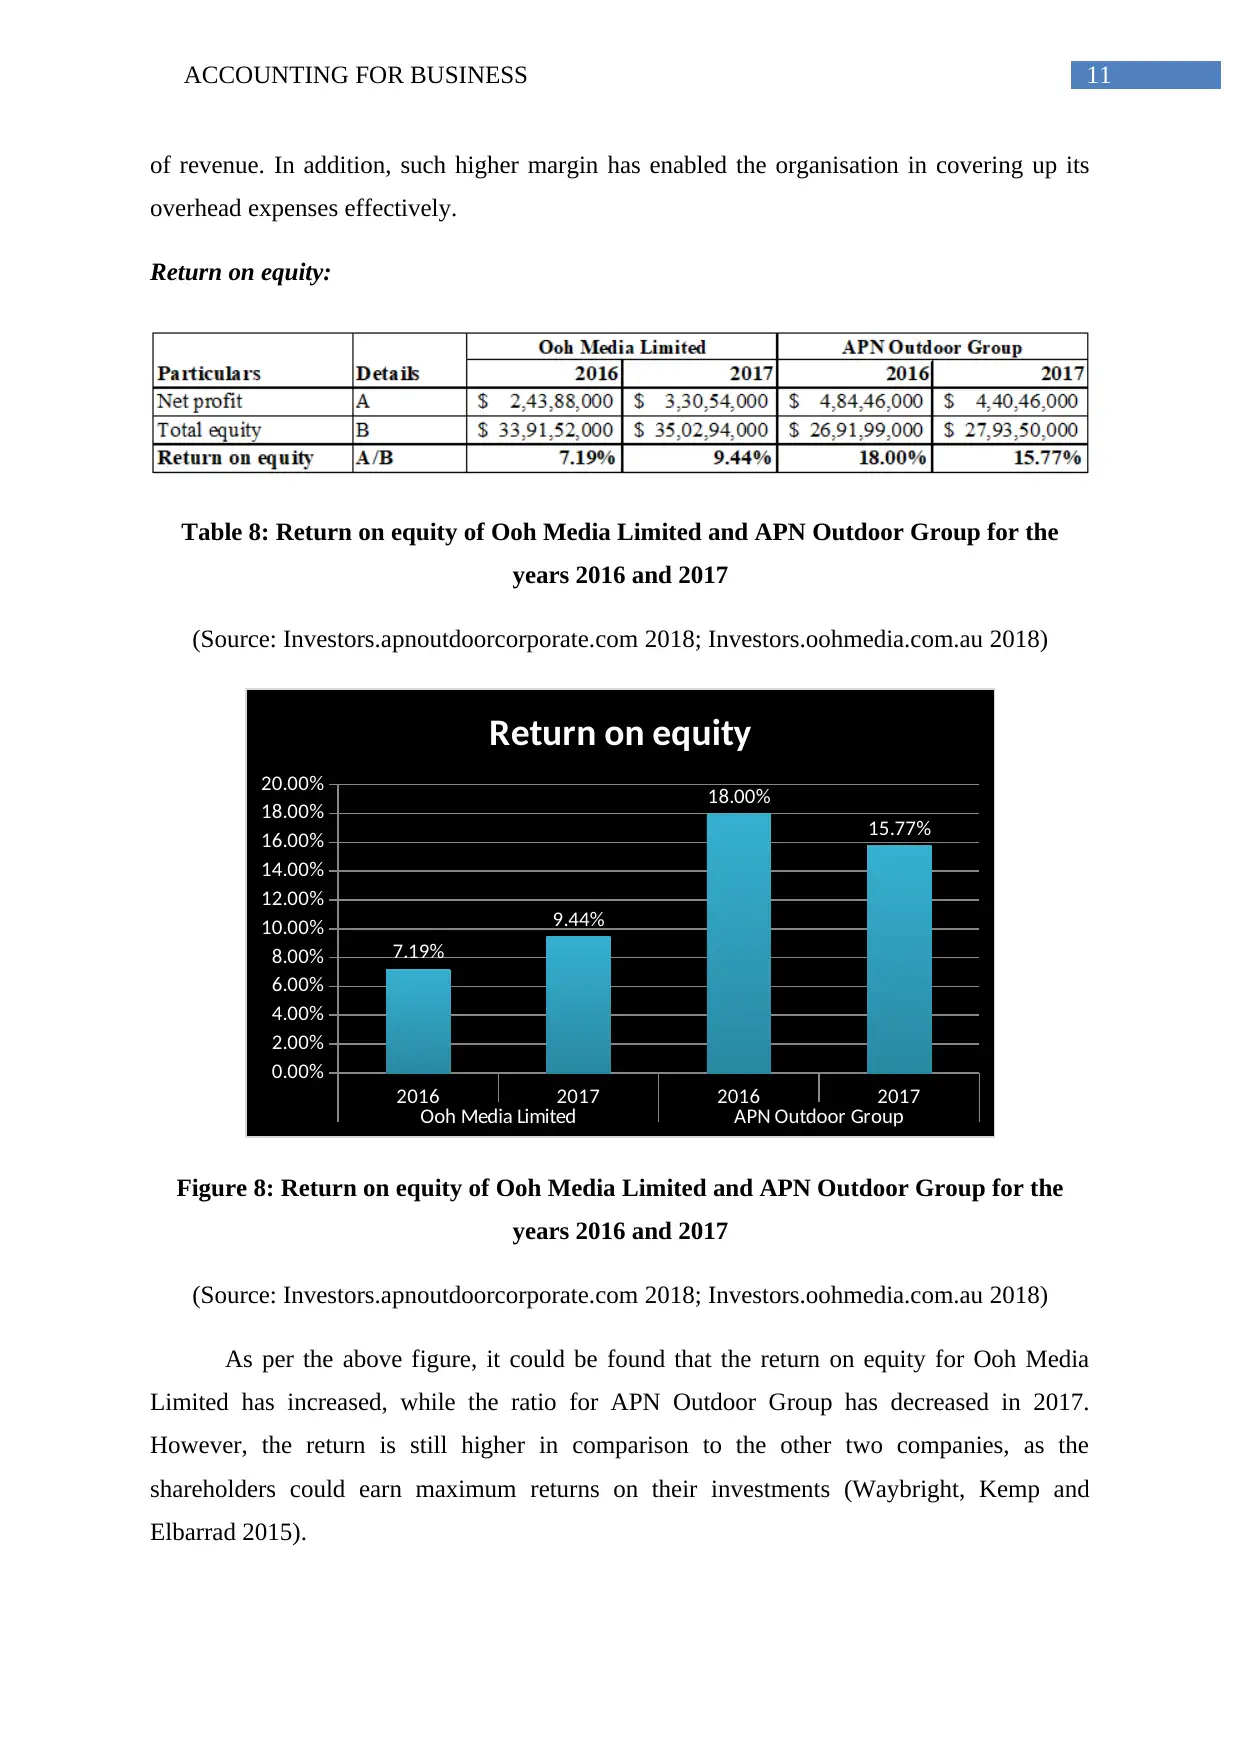
Return on equity:
Table 8: Return on equity of Ooh Media Limited and APN Outdoor Group for the
years 2016 and 2017
(Source: Investors.apnoutdoorcorporate.com 2018; Investors.oohmedia.com.au 2018)
2016 2017 2016 2017
Ooh Media Limited APN Outdoor Group
0.00%
2.00%
4.00%
6.00%
8.00%
10.00%
12.00%
14.00%
16.00%
18.00%
20.00%
7.19%
9.44%
18.00%
15.77%
Return on equity
Figure 8: Return on equity of Ooh Media Limited and APN Outdoor Group for the
years 2016 and 2017
(Source: Investors.apnoutdoorcorporate.com 2018; Investors.oohmedia.com.au 2018)
As per the above figure, it could be found that the return on equity for Ooh Media
Limited has increased, while the ratio for APN Outdoor Group has decreased in 2017.
However, the return is still higher in comparison to the other two companies, as the
shareholders could earn maximum returns on their investments (Waybright, Kemp and
Elbarrad 2015).
of revenue. In addition, such higher margin has enabled the organisation in covering up its
overhead expenses effectively.
Return on equity:
Table 8: Return on equity of Ooh Media Limited and APN Outdoor Group for the
years 2016 and 2017
(Source: Investors.apnoutdoorcorporate.com 2018; Investors.oohmedia.com.au 2018)
2016 2017 2016 2017
Ooh Media Limited APN Outdoor Group
0.00%
2.00%
4.00%
6.00%
8.00%
10.00%
12.00%
14.00%
16.00%
18.00%
20.00%
7.19%
9.44%
18.00%
15.77%
Return on equity
Figure 8: Return on equity of Ooh Media Limited and APN Outdoor Group for the
years 2016 and 2017
(Source: Investors.apnoutdoorcorporate.com 2018; Investors.oohmedia.com.au 2018)
As per the above figure, it could be found that the return on equity for Ooh Media
Limited has increased, while the ratio for APN Outdoor Group has decreased in 2017.
However, the return is still higher in comparison to the other two companies, as the
shareholders could earn maximum returns on their investments (Waybright, Kemp and
Elbarrad 2015).
⊘ This is a preview!⊘
Do you want full access?
Subscribe today to unlock all pages.
Trusted by 1+ million students worldwide
1 out of 14
Related Documents


Your All-in-One AI-Powered Toolkit for Academic Success.
+13062052269
info@desklib.com
Available 24*7 on WhatsApp / Email
![[object Object]](/_next/static/media/star-bottom.7253800d.svg)
Unlock your academic potential
Copyright © 2020–2026 A2Z Services. All Rights Reserved. Developed and managed by ZUCOL.