QMTH104: Expenditure Patterns of International Students in Australia
VerifiedAdded on 2023/06/11
|16
|3239
|102
Report
AI Summary
This report investigates the expenditure patterns of international students in Australia, focusing on the relationship between monthly income and various expenditures such as rent, internet/phone, and food/beverages. A simple random sample of 20 international students was surveyed. The analysis reveals a significant association between income and basic needs expenditures like rent and food, but no significant association with internet and phone spending. Regression models were developed to predict expenditure based on income, and the findings suggest that increased income correlates with higher spending on essential needs. The report concludes with recommendations based on these findings, providing insights into the financial behaviors of international students in Australia. Desklib offers more solved assignments and past papers.
Expenditure Patterns of International Students in Australia 1
Expenditure Patterns of International Students in Australia
Name
The Name of the Class (Course)
Professor (Tutor)
The Name of the School (University)
The City and State where it is located
Date
Expenditure Patterns of International Students in Australia
Name
The Name of the Class (Course)
Professor (Tutor)
The Name of the School (University)
The City and State where it is located
Date
Paraphrase This Document
Need a fresh take? Get an instant paraphrase of this document with our AI Paraphraser
Expenditure Patterns of International Students in Australia 2
Executive summary
The research was basically aimed at determining whether different monthly expenditures
are significantly associated with monthly income among the international students in Australia.
Simple random sample was used to collect the data from a pool of all the international students
within a campus. The analysis was carried out at the 95% level of significance. The research
pointed interesting factors in which it indicated that there was a significant association between
basic human needs (rent expenditure and food and beverages) but it was not significantly
associated with luxurious expenditure such as internet and phones monthly spending.
Table of contents
Executive summary.......................................................................................................................2
Introduction....................................................................................................................................3
Method of data collection..............................................................................................................3
Summary of the data set................................................................................................................3
Descriptive data analysis...............................................................................................................5
Simple linear regression analysis.................................................................................................6
Model 1: rent expenditure and monthly income........................................................................6
Model 2: Internet and phone expenditure against monthly income.........................................8
Model 3: Food and beverages Expenditure against monthly income....................................10
Conclusion and recommendations.............................................................................................12
References......................................................................................................................................13
Expenditure Patterns of International Students in Australia 3
Introduction
Expenditure among students is fundamental and determinants of life satisfaction
(Kotakorpi, and Laamanen, 2010). Thus, it is important to assess the expenditure of international
students taking their studies in Australia. In this case, we will be able to assess whether there is a
strong association between different expenditures, Year of study, and income. Through this
assessment, it will in determining whether there exists a pattern in the students spending.
Method of data collection
A simple random sampling technique will be used in collecting the data. That is, first the
target population is identified (international students), then at random, a sample of 20 students is
selected. These students are given a questionnaire which contains 10 questions. The questions
were simple and easy to understand. The questionnaire collected demographic information about
the students; which included, gender, type of study, country of origin, general expenditure and
the monthly income. After the questionnaire was filled, they were returned and the data filtering
was carried out.
Summary of the data set
As earlier indicated, the primary objective of this research is to determine the patterns in
the student expenditure, through which we can be able to predict the expenditure of an
individual. Therefore, the research focused on developing a model that can be used to predict
different models. The data targeted four basic expenditures of a student, monthly rent,
commuting expenditure, internet, and phone expenditure and food and beverages. The other
important factors that would be investigated on whether they affect expenditure include the year
⊘ This is a preview!⊘
Do you want full access?
Subscribe today to unlock all pages.
Trusted by 1+ million students worldwide
Expenditure Patterns of International Students in Australia 4
of study, and gender. In this study, the expenditure variables and income were reported in
Australian dollars and they are estimated monthly values.
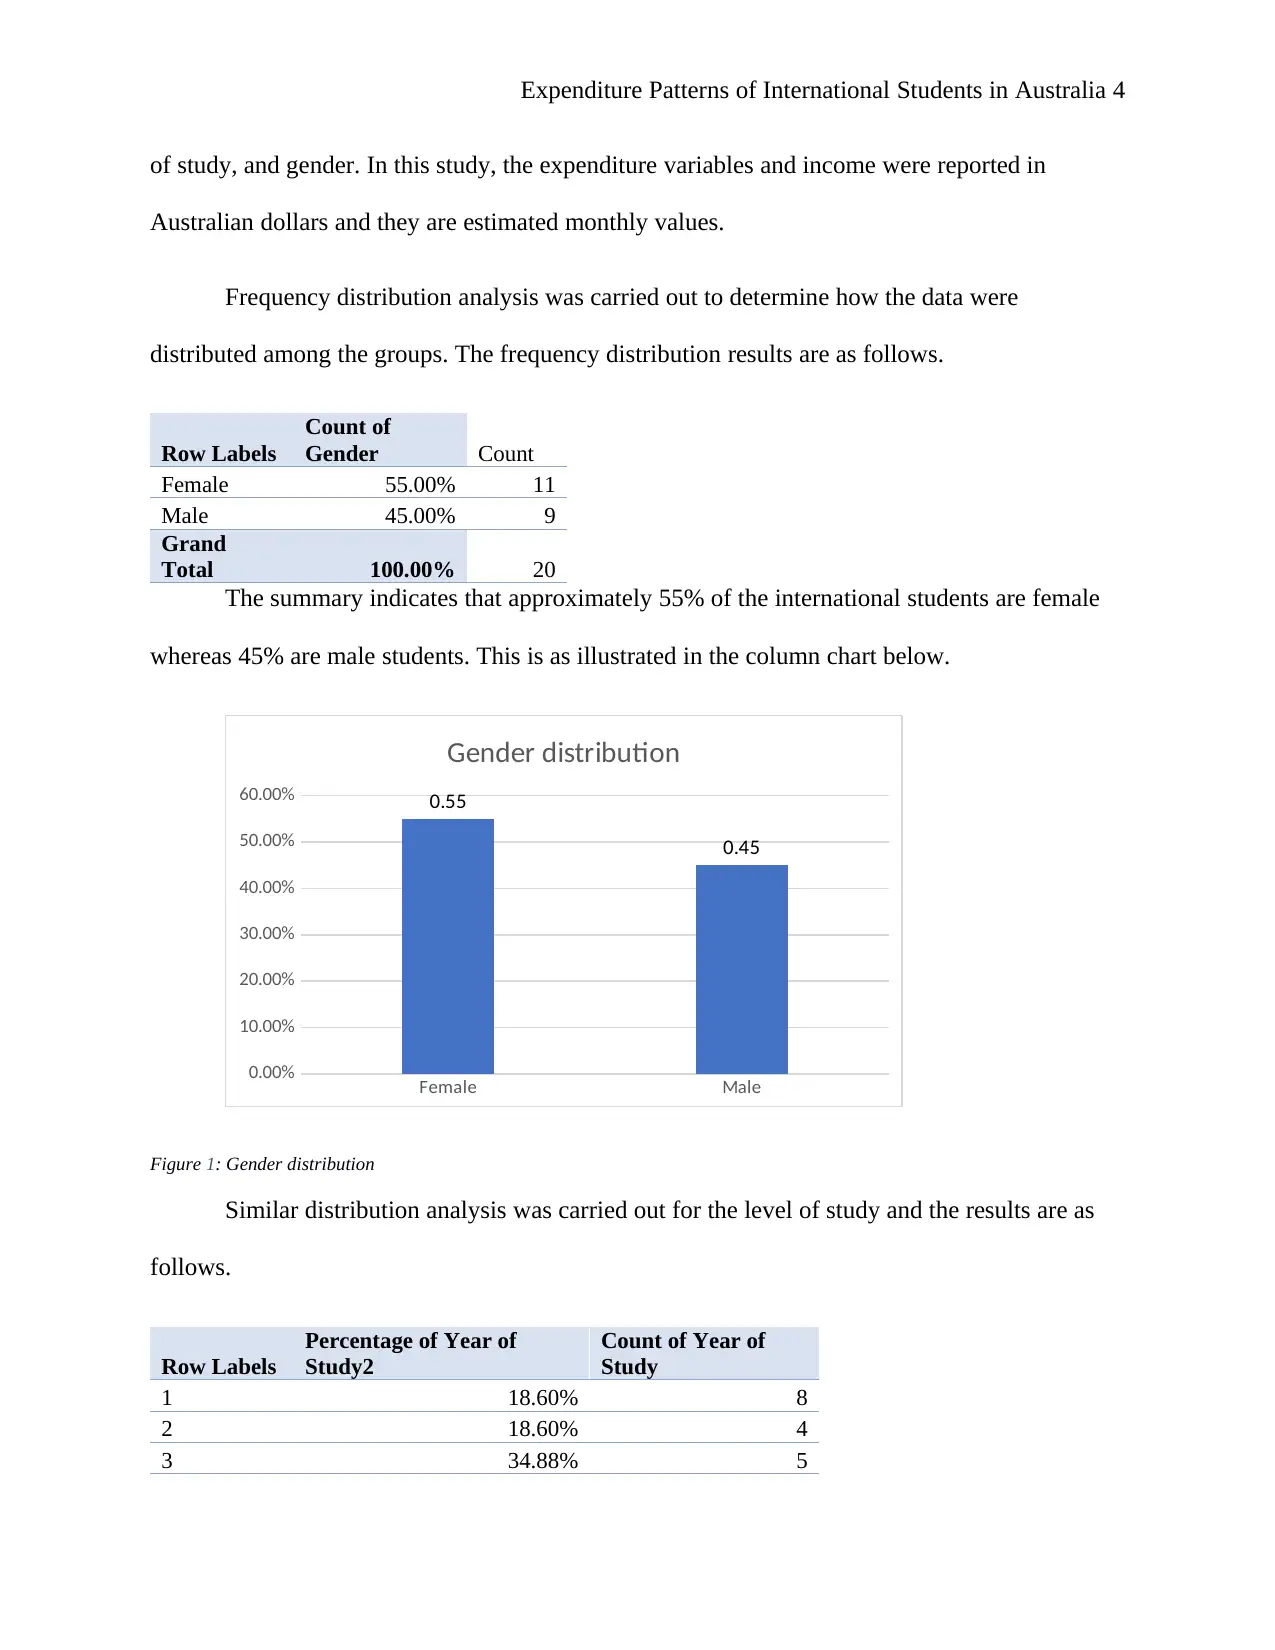
Frequency distribution analysis was carried out to determine how the data were
distributed among the groups. The frequency distribution results are as follows.
Row Labels
Count of
Gender Count
Female 55.00% 11
Male 45.00% 9
Grand
Total 100.00% 20
The summary indicates that approximately 55% of the international students are female
whereas 45% are male students. This is as illustrated in the column chart below.
Female Male
0.00%
10.00%
20.00%
30.00%
40.00%
50.00%
60.00% 0.55
0.45
Gender distribution
Figure 1: Gender distribution
Similar distribution analysis was carried out for the level of study and the results are as
follows.
Row Labels
Percentage of Year of
Study2
Count of Year of
Study
1 18.60% 8
2 18.60% 4
3 34.88% 5
of study, and gender. In this study, the expenditure variables and income were reported in
Australian dollars and they are estimated monthly values.
Frequency distribution analysis was carried out to determine how the data were
distributed among the groups. The frequency distribution results are as follows.
Row Labels
Count of
Gender Count
Female 55.00% 11
Male 45.00% 9
Grand
Total 100.00% 20
The summary indicates that approximately 55% of the international students are female
whereas 45% are male students. This is as illustrated in the column chart below.
Female Male
0.00%
10.00%
20.00%
30.00%
40.00%
50.00%
60.00% 0.55
0.45
Gender distribution
Figure 1: Gender distribution
Similar distribution analysis was carried out for the level of study and the results are as
follows.
Row Labels
Percentage of Year of
Study2
Count of Year of
Study
1 18.60% 8
2 18.60% 4
3 34.88% 5
Paraphrase This Document
Need a fresh take? Get an instant paraphrase of this document with our AI Paraphraser
Expenditure Patterns of International Students in Australia 5
4 27.91% 3
Grand
Total 100.00% 20
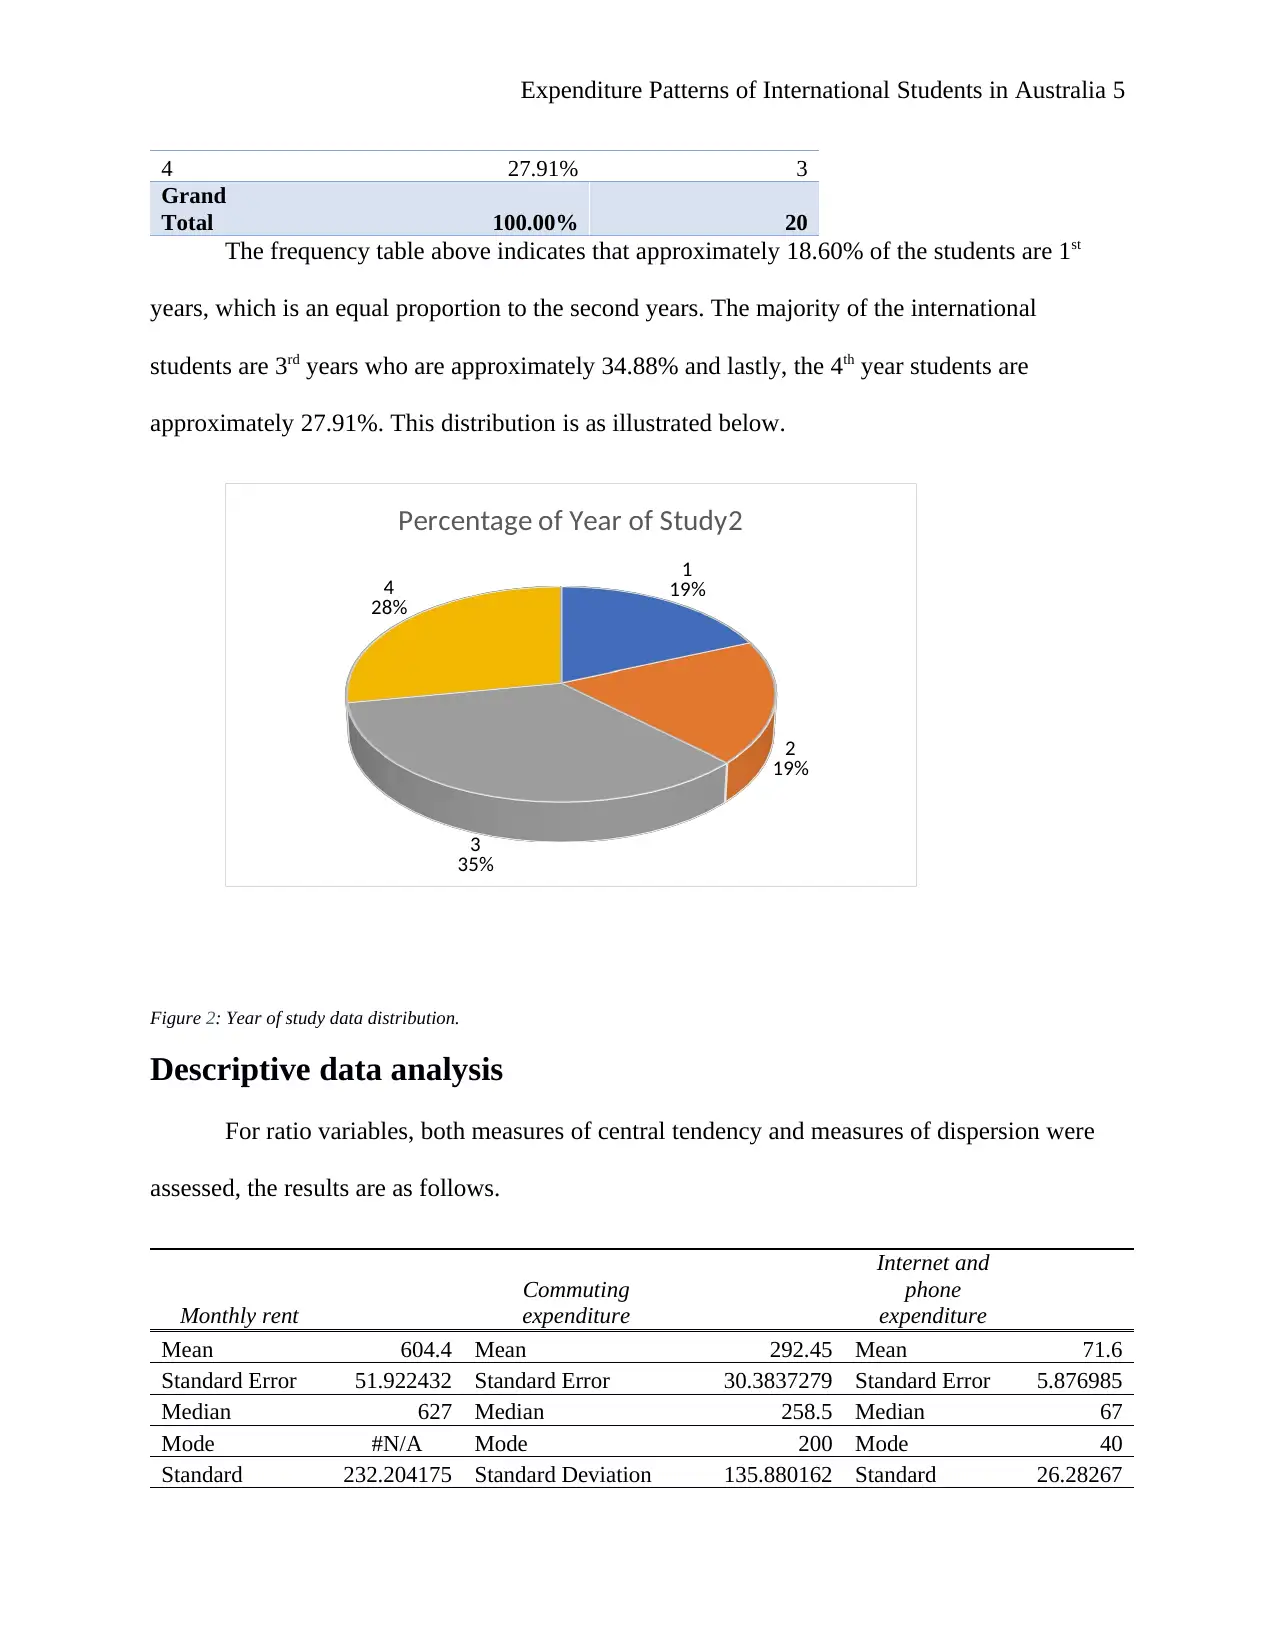
The frequency table above indicates that approximately 18.60% of the students are 1st
years, which is an equal proportion to the second years. The majority of the international
students are 3rd years who are approximately 34.88% and lastly, the 4th year students are
approximately 27.91%. This distribution is as illustrated below.
1
19%
2
19%
3
35%
4
28%
Percentage of Year of Study2
Figure 2: Year of study data distribution.
Descriptive data analysis
For ratio variables, both measures of central tendency and measures of dispersion were
assessed, the results are as follows.
Monthly rent
Commuting
expenditure
Internet and
phone
expenditure
Mean 604.4 Mean 292.45 Mean 71.6
Standard Error 51.922432 Standard Error 30.3837279 Standard Error 5.876985
Median 627 Median 258.5 Median 67
Mode #N/A Mode 200 Mode 40
Standard 232.204175 Standard Deviation 135.880162 Standard 26.28267
4 27.91% 3
Grand
Total 100.00% 20
The frequency table above indicates that approximately 18.60% of the students are 1st
years, which is an equal proportion to the second years. The majority of the international
students are 3rd years who are approximately 34.88% and lastly, the 4th year students are
approximately 27.91%. This distribution is as illustrated below.
1
19%
2
19%
3
35%
4
28%
Percentage of Year of Study2
Figure 2: Year of study data distribution.
Descriptive data analysis
For ratio variables, both measures of central tendency and measures of dispersion were
assessed, the results are as follows.
Monthly rent
Commuting
expenditure
Internet and
phone
expenditure
Mean 604.4 Mean 292.45 Mean 71.6
Standard Error 51.922432 Standard Error 30.3837279 Standard Error 5.876985
Median 627 Median 258.5 Median 67
Mode #N/A Mode 200 Mode 40
Standard 232.204175 Standard Deviation 135.880162 Standard 26.28267
Expenditure Patterns of International Students in Australia 6
Deviation Deviation
Sample Variance 53918.7789 Sample Variance 18463.41842 Sample Variance 690.7789
Kurtosis -0.7762152 Kurtosis -0.626489484 Kurtosis -1.20226
Skewness -0.0172952 Skewness 0.761786778 Skewness 0.347134
Range 790 Range 430 Range 80
Minimum 210 Minimum 120 Minimum 40
Maximum 1000 Maximum 550 Maximum 120
Sum 12088 Sum 5849 Sum 1432
Count 20 Count 20 Count 20
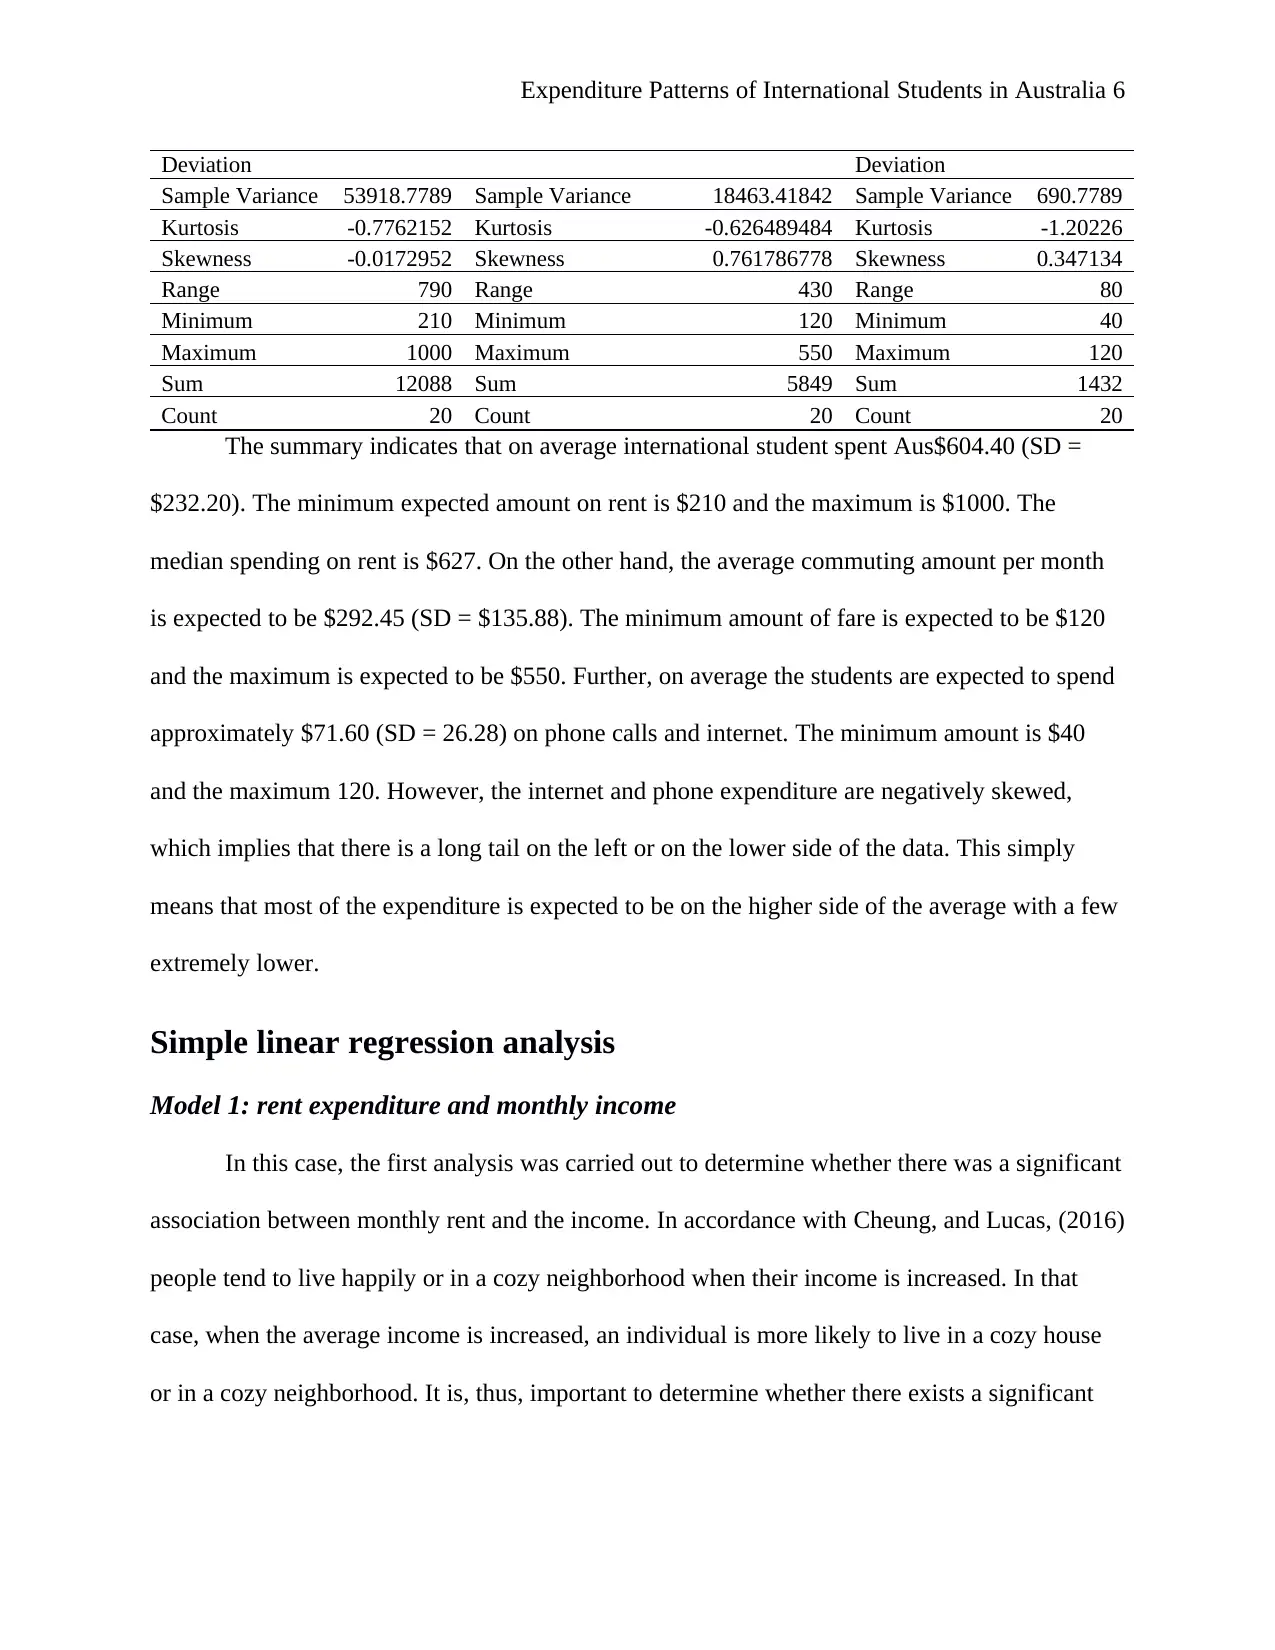
The summary indicates that on average international student spent Aus$604.40 (SD =
$232.20). The minimum expected amount on rent is $210 and the maximum is $1000. The
median spending on rent is $627. On the other hand, the average commuting amount per month
is expected to be $292.45 (SD = $135.88). The minimum amount of fare is expected to be $120
and the maximum is expected to be $550. Further, on average the students are expected to spend
approximately $71.60 (SD = 26.28) on phone calls and internet. The minimum amount is $40
and the maximum 120. However, the internet and phone expenditure are negatively skewed,
which implies that there is a long tail on the left or on the lower side of the data. This simply
means that most of the expenditure is expected to be on the higher side of the average with a few
extremely lower.
Simple linear regression analysis
Model 1: rent expenditure and monthly income
In this case, the first analysis was carried out to determine whether there was a significant
association between monthly rent and the income. In accordance with Cheung, and Lucas, (2016)
people tend to live happily or in a cozy neighborhood when their income is increased. In that
case, when the average income is increased, an individual is more likely to live in a cozy house
or in a cozy neighborhood. It is, thus, important to determine whether there exists a significant
Deviation Deviation
Sample Variance 53918.7789 Sample Variance 18463.41842 Sample Variance 690.7789
Kurtosis -0.7762152 Kurtosis -0.626489484 Kurtosis -1.20226
Skewness -0.0172952 Skewness 0.761786778 Skewness 0.347134
Range 790 Range 430 Range 80
Minimum 210 Minimum 120 Minimum 40
Maximum 1000 Maximum 550 Maximum 120
Sum 12088 Sum 5849 Sum 1432
Count 20 Count 20 Count 20
The summary indicates that on average international student spent Aus$604.40 (SD =
$232.20). The minimum expected amount on rent is $210 and the maximum is $1000. The
median spending on rent is $627. On the other hand, the average commuting amount per month
is expected to be $292.45 (SD = $135.88). The minimum amount of fare is expected to be $120
and the maximum is expected to be $550. Further, on average the students are expected to spend
approximately $71.60 (SD = 26.28) on phone calls and internet. The minimum amount is $40
and the maximum 120. However, the internet and phone expenditure are negatively skewed,
which implies that there is a long tail on the left or on the lower side of the data. This simply
means that most of the expenditure is expected to be on the higher side of the average with a few
extremely lower.
Simple linear regression analysis
Model 1: rent expenditure and monthly income
In this case, the first analysis was carried out to determine whether there was a significant
association between monthly rent and the income. In accordance with Cheung, and Lucas, (2016)
people tend to live happily or in a cozy neighborhood when their income is increased. In that
case, when the average income is increased, an individual is more likely to live in a cozy house
or in a cozy neighborhood. It is, thus, important to determine whether there exists a significant
⊘ This is a preview!⊘
Do you want full access?
Subscribe today to unlock all pages.
Trusted by 1+ million students worldwide
Expenditure Patterns of International Students in Australia 7
association between monthly rent paid and the monthly income. All analyses are carried out at
the level. 05.
The model will test the hypothesis:
H0: there is no relationship between monthly rent and monthly income.
H0: there is a significant relationship between monthly rent and monthly income.
The test results are as summarized below.
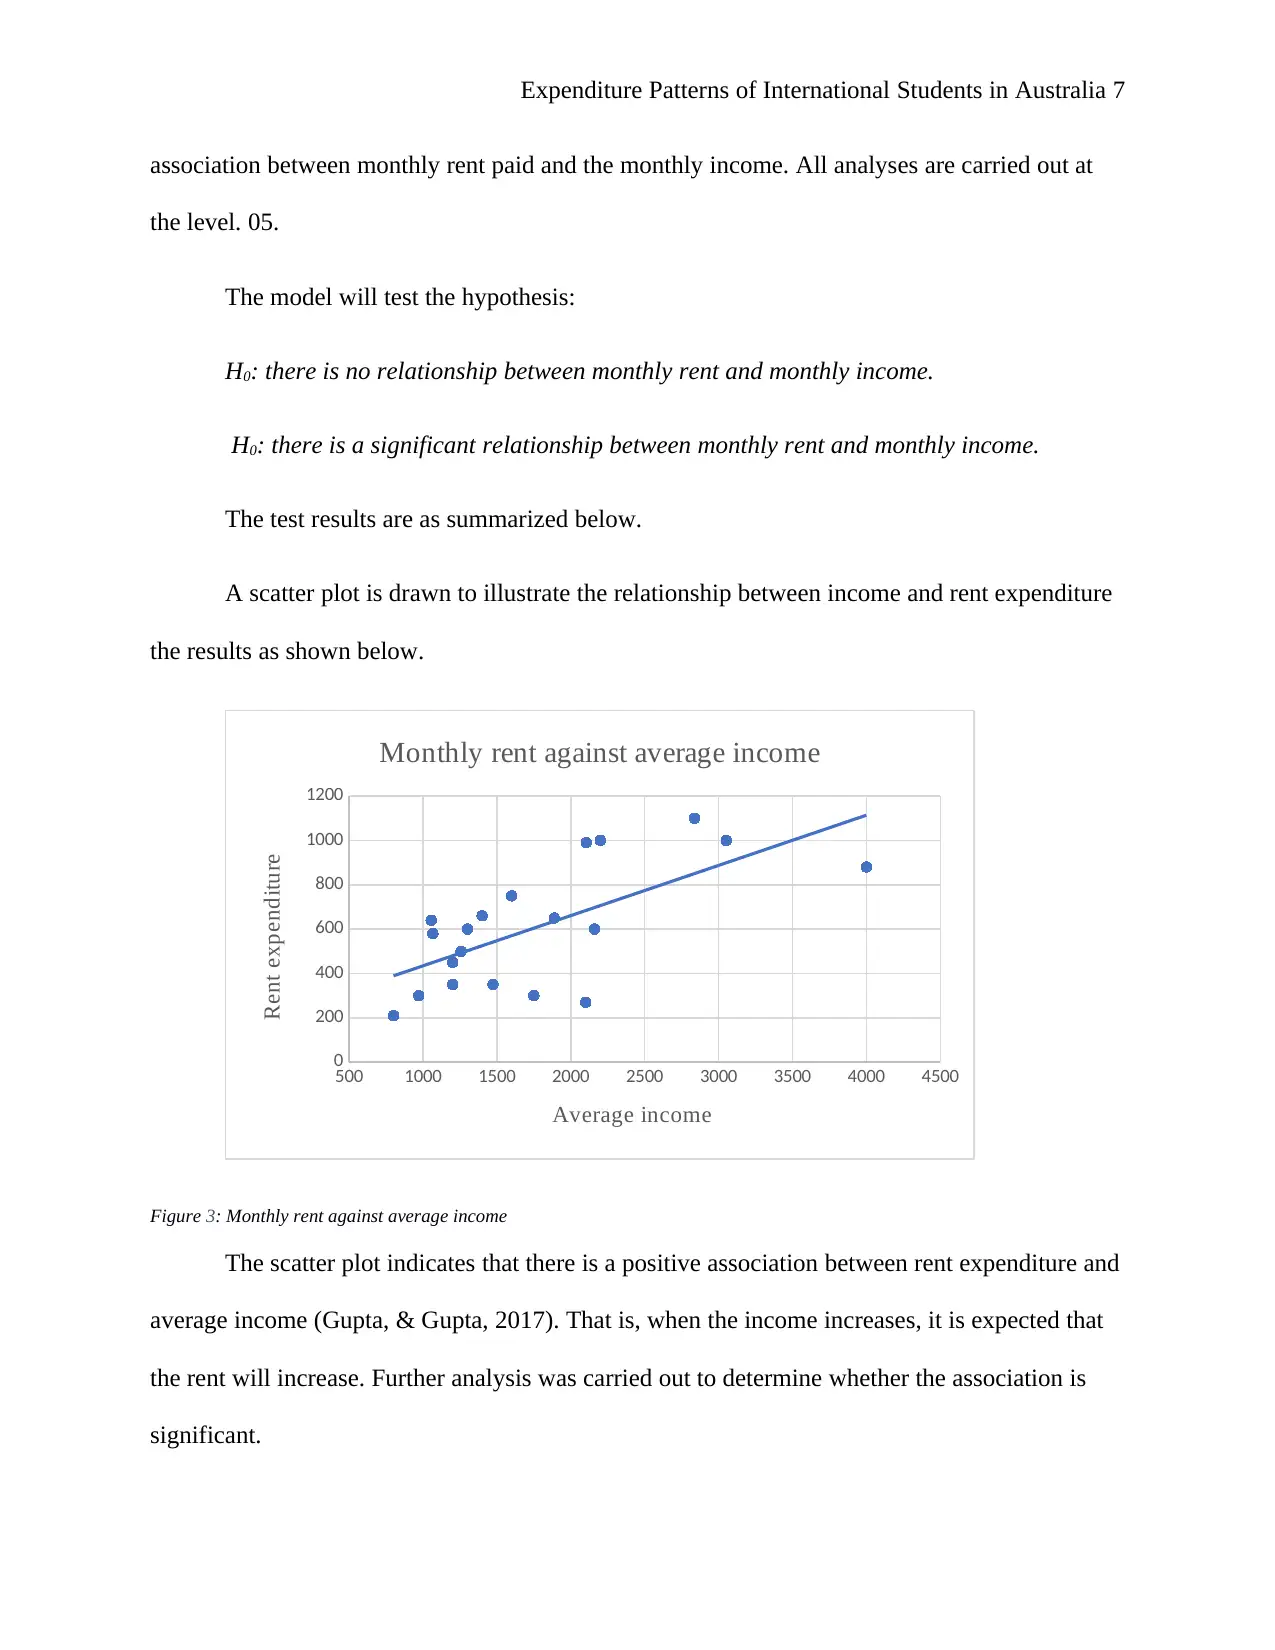
A scatter plot is drawn to illustrate the relationship between income and rent expenditure
the results as shown below.
500 1000 1500 2000 2500 3000 3500 4000 4500
0
200
400
600
800
1000
1200
Monthly rent against average income
Average income
Rent expenditure
Figure 3: Monthly rent against average income
The scatter plot indicates that there is a positive association between rent expenditure and
average income (Gupta, & Gupta, 2017). That is, when the income increases, it is expected that
the rent will increase. Further analysis was carried out to determine whether the association is
significant.
association between monthly rent paid and the monthly income. All analyses are carried out at
the level. 05.
The model will test the hypothesis:
H0: there is no relationship between monthly rent and monthly income.
H0: there is a significant relationship between monthly rent and monthly income.
The test results are as summarized below.
A scatter plot is drawn to illustrate the relationship between income and rent expenditure
the results as shown below.
500 1000 1500 2000 2500 3000 3500 4000 4500
0
200
400
600
800
1000
1200
Monthly rent against average income
Average income
Rent expenditure
Figure 3: Monthly rent against average income
The scatter plot indicates that there is a positive association between rent expenditure and
average income (Gupta, & Gupta, 2017). That is, when the income increases, it is expected that
the rent will increase. Further analysis was carried out to determine whether the association is
significant.
Paraphrase This Document
Need a fresh take? Get an instant paraphrase of this document with our AI Paraphraser
Expenditure Patterns of International Students in Australia 8
SUMMARY OUTPUT
Regression Statistics
Multiple R 0.664578
R Square 0.441664
Adjusted R Square 0.410645
Standard Error 210.4615
Observations 20
ANOVA
df SS MS F
Significanc
e F
Regression 1 630687.5 630687.5 14.23866 0.001391
Residual 18 797292.5 44294.03
Total 19 1427980
Coefficient
s
Standard
Error t Stat P-value Lower 95%
Upper
95%
Intercept 208.1016 116.1992 1.790904 0.090141 -36.0238 452.227
Average income 0.22642 0.060004 3.773415 0.001391 0.100356 0.352483
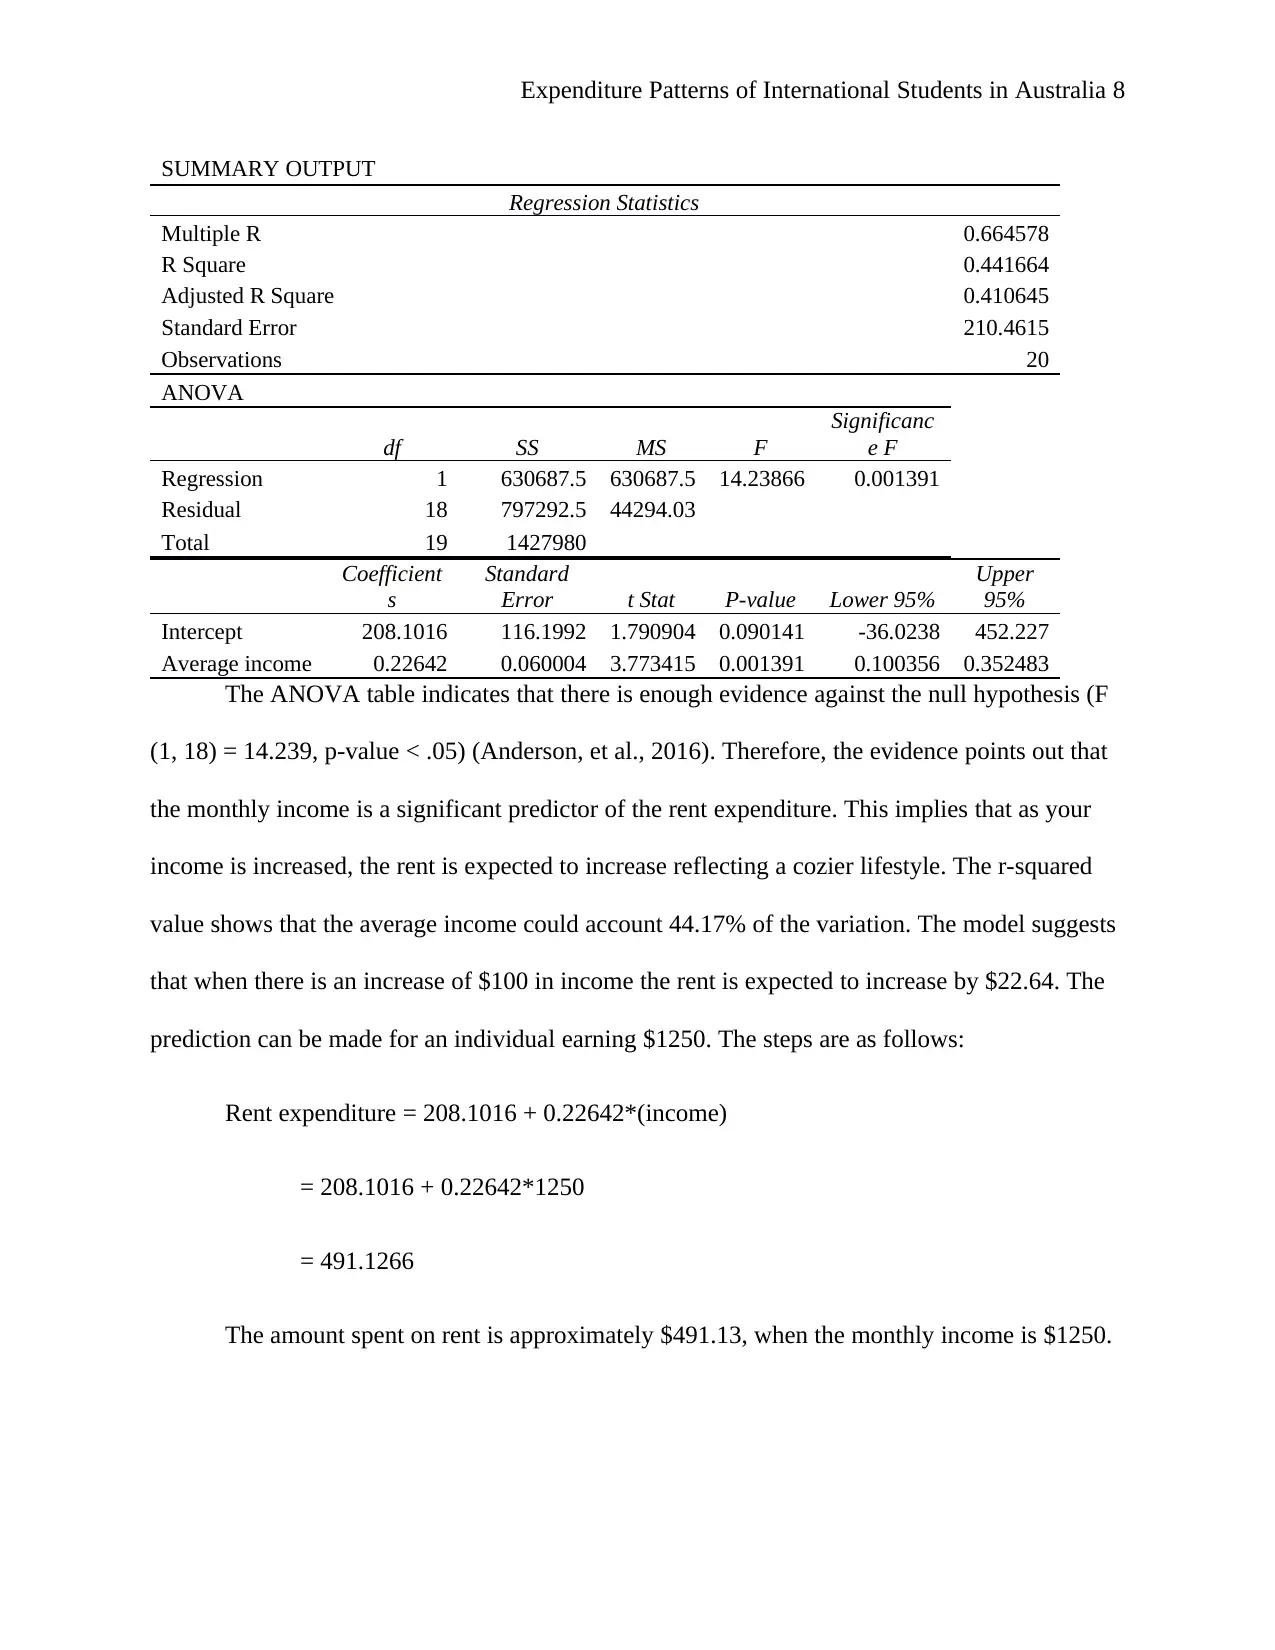
The ANOVA table indicates that there is enough evidence against the null hypothesis (F
(1, 18) = 14.239, p-value < .05) (Anderson, et al., 2016). Therefore, the evidence points out that
the monthly income is a significant predictor of the rent expenditure. This implies that as your
income is increased, the rent is expected to increase reflecting a cozier lifestyle. The r-squared
value shows that the average income could account 44.17% of the variation. The model suggests
that when there is an increase of $100 in income the rent is expected to increase by $22.64. The
prediction can be made for an individual earning $1250. The steps are as follows:
Rent expenditure = 208.1016 + 0.22642*(income)
= 208.1016 + 0.22642*1250
= 491.1266
The amount spent on rent is approximately $491.13, when the monthly income is $1250.
SUMMARY OUTPUT
Regression Statistics
Multiple R 0.664578
R Square 0.441664
Adjusted R Square 0.410645
Standard Error 210.4615
Observations 20
ANOVA
df SS MS F
Significanc
e F
Regression 1 630687.5 630687.5 14.23866 0.001391
Residual 18 797292.5 44294.03
Total 19 1427980
Coefficient
s
Standard
Error t Stat P-value Lower 95%
Upper
95%
Intercept 208.1016 116.1992 1.790904 0.090141 -36.0238 452.227
Average income 0.22642 0.060004 3.773415 0.001391 0.100356 0.352483
The ANOVA table indicates that there is enough evidence against the null hypothesis (F
(1, 18) = 14.239, p-value < .05) (Anderson, et al., 2016). Therefore, the evidence points out that
the monthly income is a significant predictor of the rent expenditure. This implies that as your
income is increased, the rent is expected to increase reflecting a cozier lifestyle. The r-squared
value shows that the average income could account 44.17% of the variation. The model suggests
that when there is an increase of $100 in income the rent is expected to increase by $22.64. The
prediction can be made for an individual earning $1250. The steps are as follows:
Rent expenditure = 208.1016 + 0.22642*(income)
= 208.1016 + 0.22642*1250
= 491.1266
The amount spent on rent is approximately $491.13, when the monthly income is $1250.
Expenditure Patterns of International Students in Australia 9
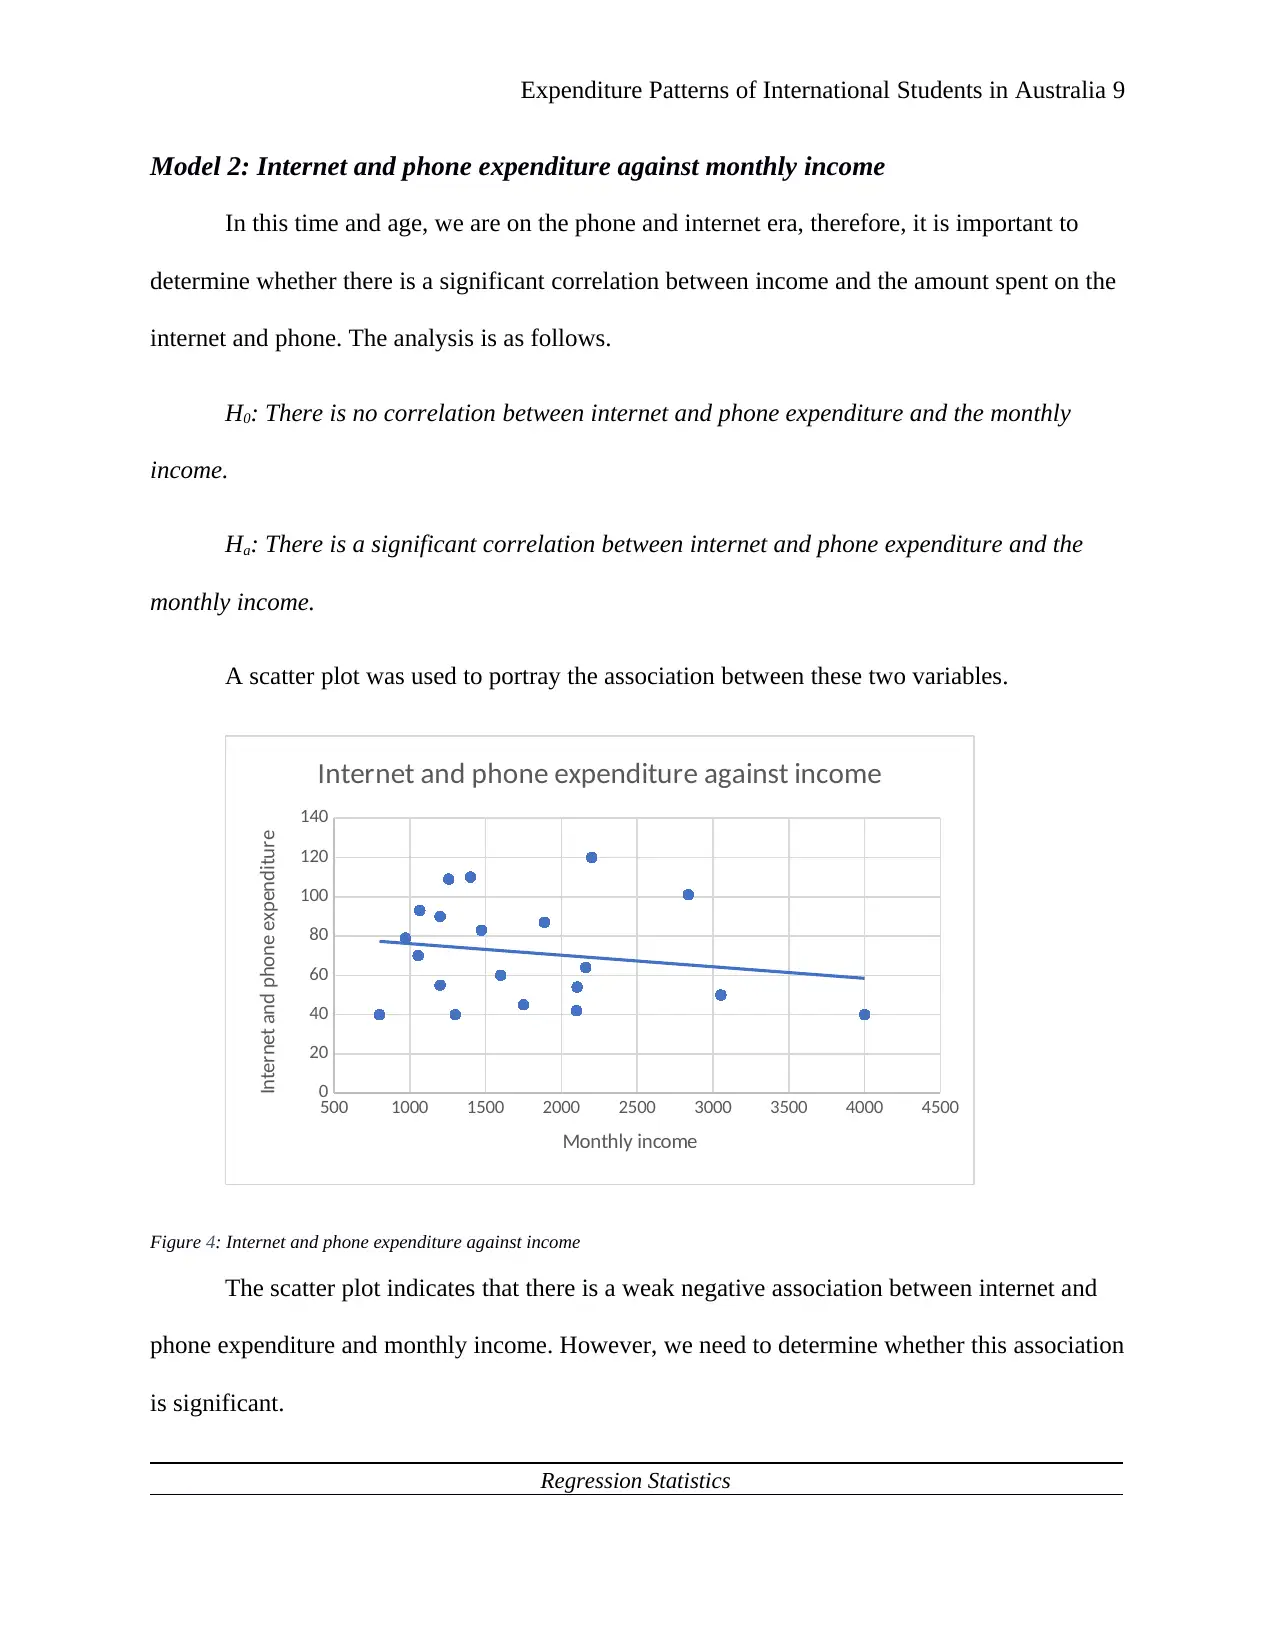
Model 2: Internet and phone expenditure against monthly income
In this time and age, we are on the phone and internet era, therefore, it is important to
determine whether there is a significant correlation between income and the amount spent on the
internet and phone. The analysis is as follows.
H0: There is no correlation between internet and phone expenditure and the monthly
income.
Ha: There is a significant correlation between internet and phone expenditure and the
monthly income.
A scatter plot was used to portray the association between these two variables.
500 1000 1500 2000 2500 3000 3500 4000 4500
0
20
40
60
80
100
120
140
Internet and phone expenditure against income
Monthly income
Internet and phone expenditure
Figure 4: Internet and phone expenditure against income
The scatter plot indicates that there is a weak negative association between internet and
phone expenditure and monthly income. However, we need to determine whether this association
is significant.
Regression Statistics
⊘ This is a preview!⊘
Do you want full access?
Subscribe today to unlock all pages.
Trusted by 1+ million students worldwide
Expenditure Patterns of International Students in Australia 10
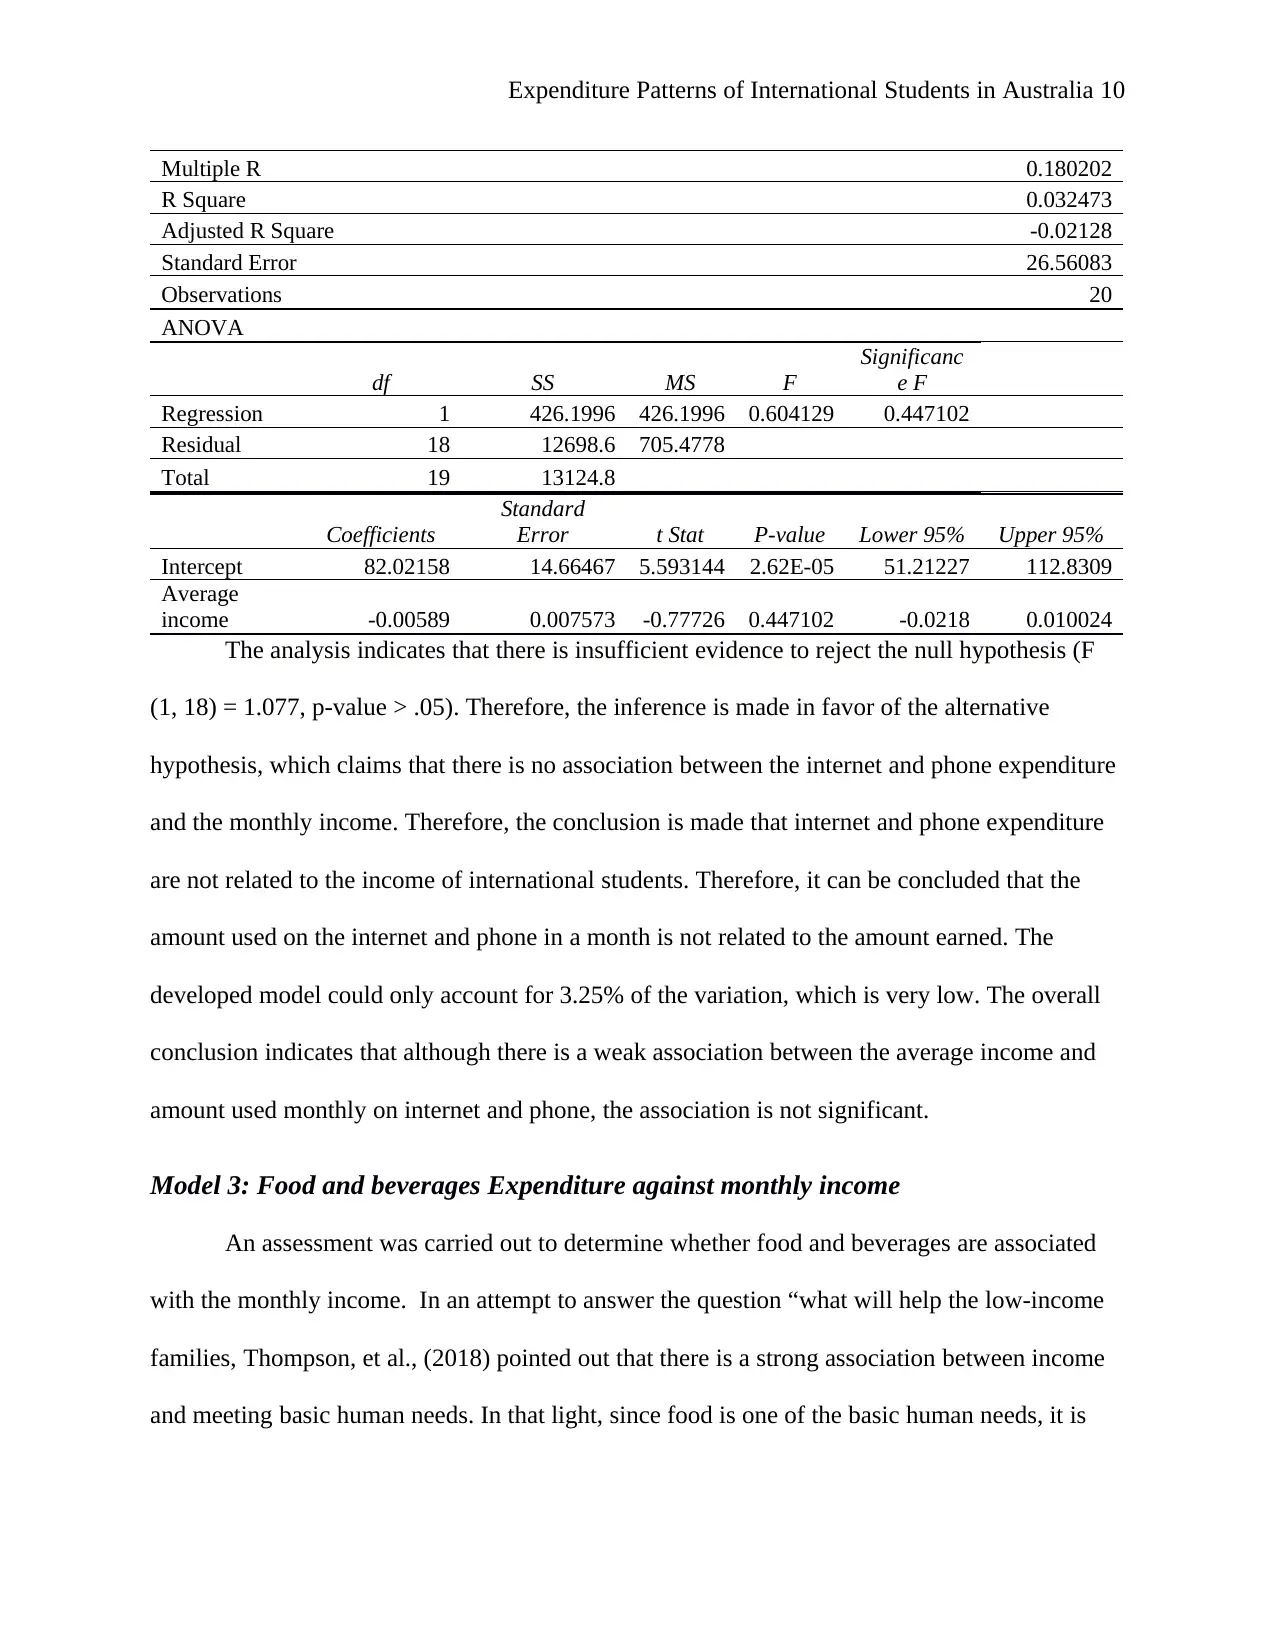
Multiple R 0.180202
R Square 0.032473
Adjusted R Square -0.02128
Standard Error 26.56083
Observations 20
ANOVA
df SS MS F
Significanc
e F
Regression 1 426.1996 426.1996 0.604129 0.447102
Residual 18 12698.6 705.4778
Total 19 13124.8
Coefficients
Standard
Error t Stat P-value Lower 95% Upper 95%
Intercept 82.02158 14.66467 5.593144 2.62E-05 51.21227 112.8309
Average
income -0.00589 0.007573 -0.77726 0.447102 -0.0218 0.010024
The analysis indicates that there is insufficient evidence to reject the null hypothesis (F
(1, 18) = 1.077, p-value > .05). Therefore, the inference is made in favor of the alternative
hypothesis, which claims that there is no association between the internet and phone expenditure
and the monthly income. Therefore, the conclusion is made that internet and phone expenditure
are not related to the income of international students. Therefore, it can be concluded that the
amount used on the internet and phone in a month is not related to the amount earned. The
developed model could only account for 3.25% of the variation, which is very low. The overall
conclusion indicates that although there is a weak association between the average income and
amount used monthly on internet and phone, the association is not significant.
Model 3: Food and beverages Expenditure against monthly income
An assessment was carried out to determine whether food and beverages are associated
with the monthly income. In an attempt to answer the question “what will help the low-income
families, Thompson, et al., (2018) pointed out that there is a strong association between income
and meeting basic human needs. In that light, since food is one of the basic human needs, it is
Paraphrase This Document
Need a fresh take? Get an instant paraphrase of this document with our AI Paraphraser
Expenditure Patterns of International Students in Australia 11
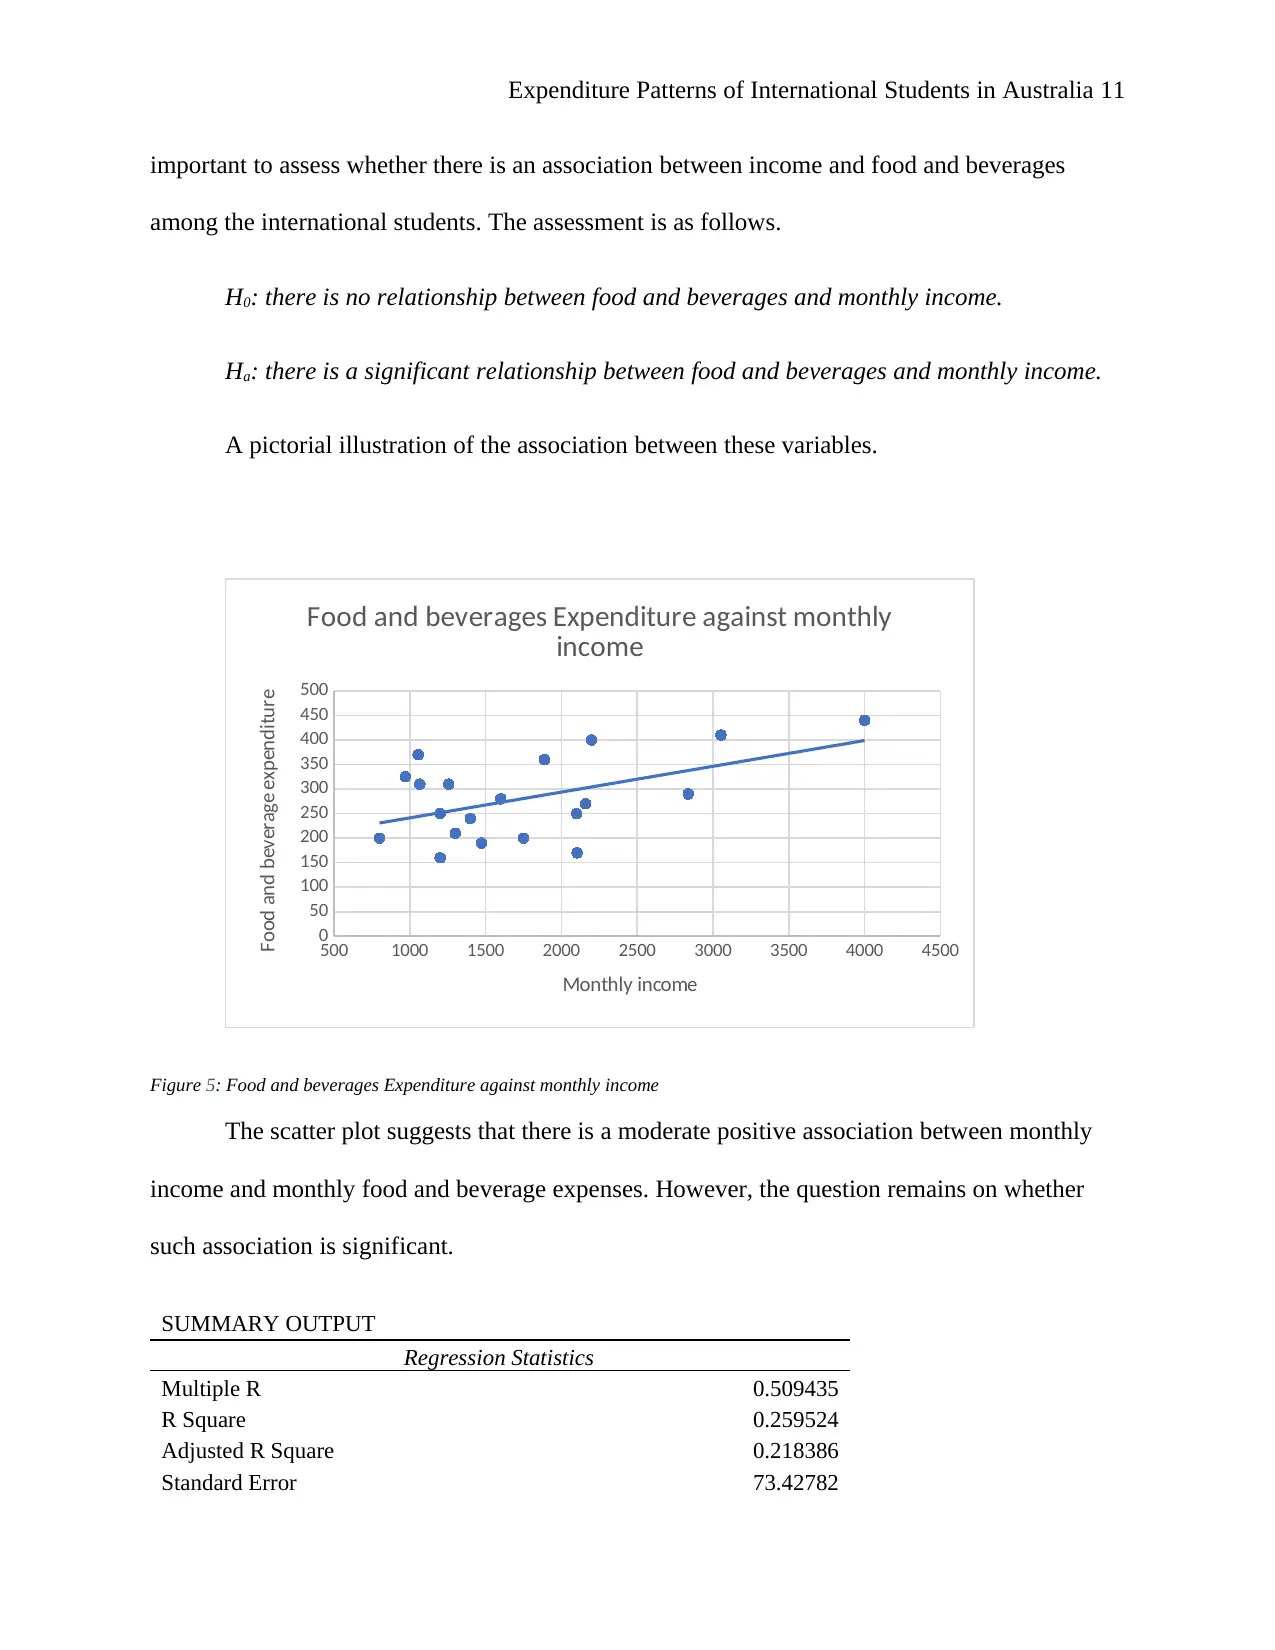
important to assess whether there is an association between income and food and beverages
among the international students. The assessment is as follows.
H0: there is no relationship between food and beverages and monthly income.
Ha: there is a significant relationship between food and beverages and monthly income.
A pictorial illustration of the association between these variables.
500 1000 1500 2000 2500 3000 3500 4000 4500
0
50
100
150
200
250
300
350
400
450
500
Food and beverages Expenditure against monthly
income
Monthly income
Food and beverage expenditure
Figure 5: Food and beverages Expenditure against monthly income
The scatter plot suggests that there is a moderate positive association between monthly
income and monthly food and beverage expenses. However, the question remains on whether
such association is significant.
SUMMARY OUTPUT
Regression Statistics
Multiple R 0.509435
R Square 0.259524
Adjusted R Square 0.218386
Standard Error 73.42782
Expenditure Patterns of International Students in Australia 12
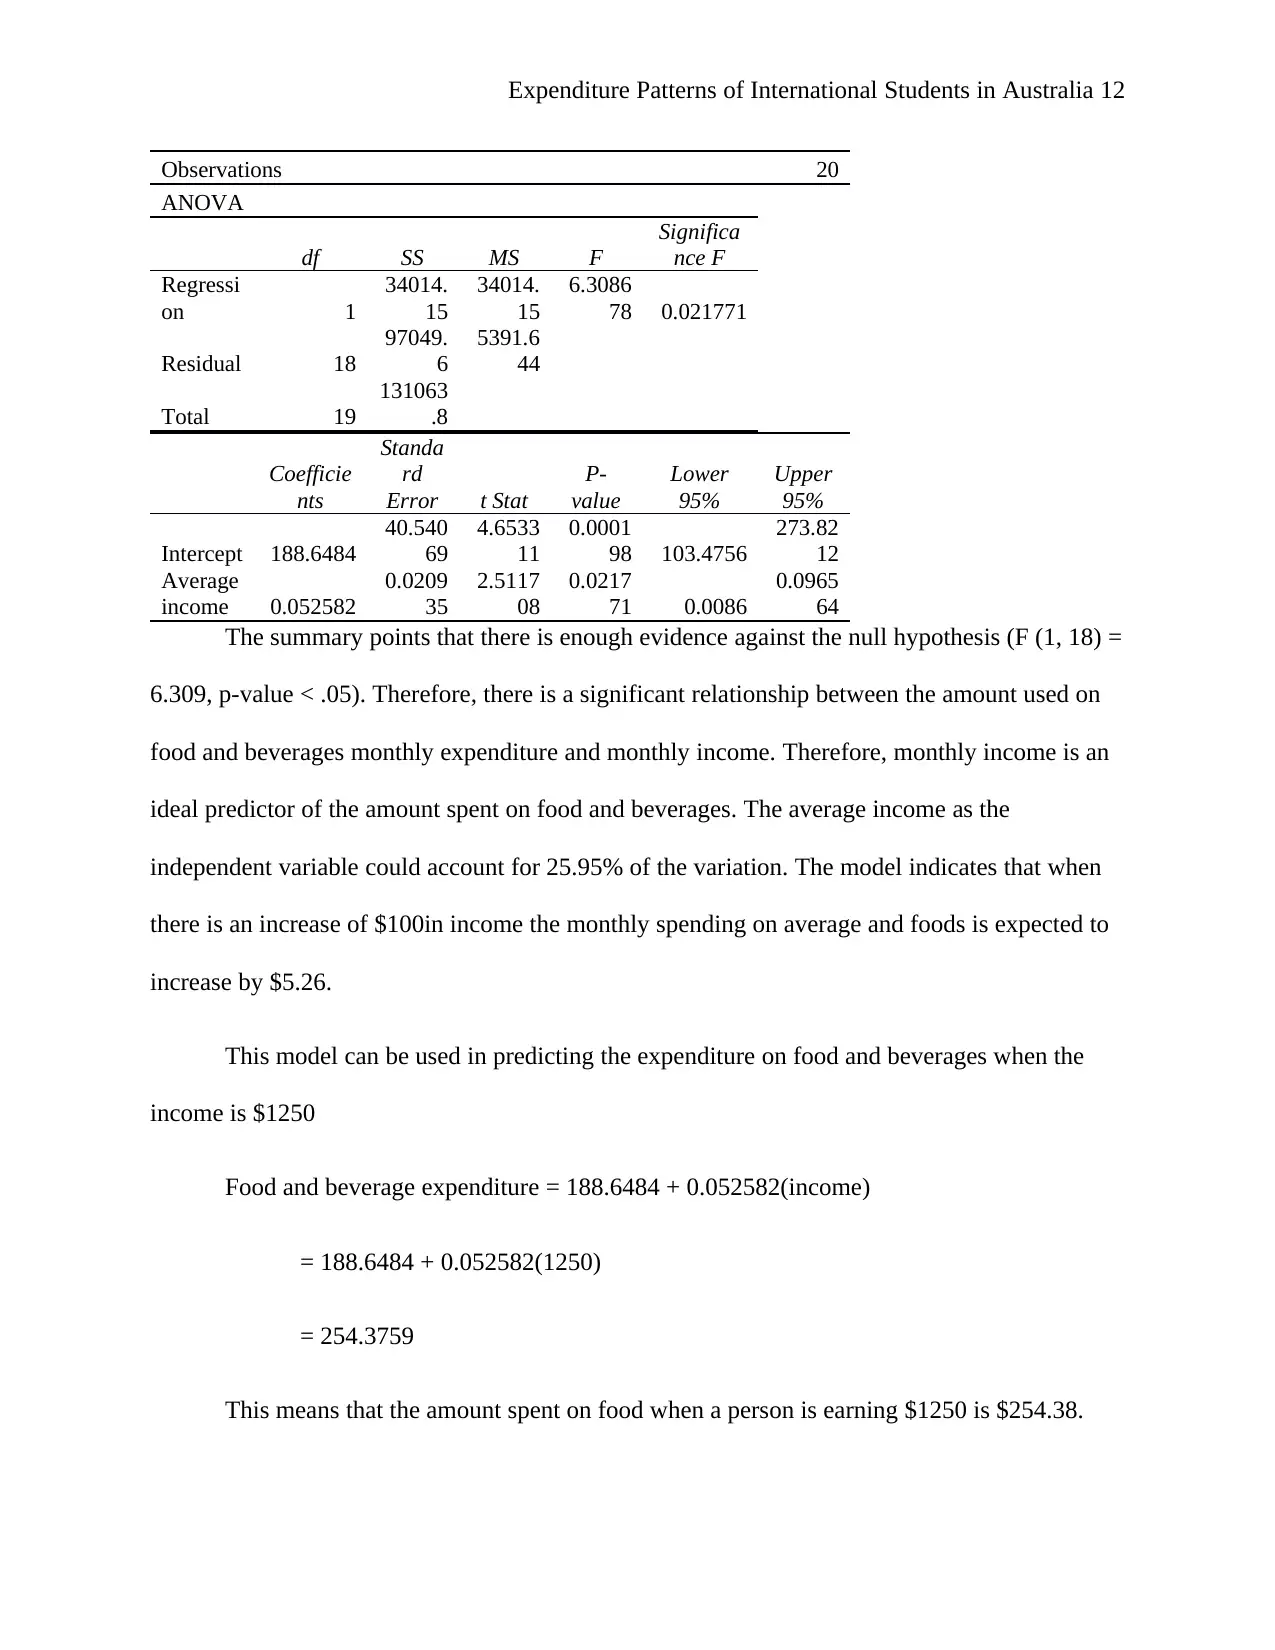
Observations 20
ANOVA
df SS MS F
Significa
nce F
Regressi
on 1
34014.
15
34014.
15
6.3086
78 0.021771
Residual 18
97049.
6
5391.6
44
Total 19
131063
.8
Coefficie
nts
Standa
rd
Error t Stat
P-
value
Lower
95%
Upper
95%
Intercept 188.6484
40.540
69
4.6533
11
0.0001
98 103.4756
273.82
12
Average
income 0.052582
0.0209
35
2.5117
08
0.0217
71 0.0086
0.0965
64
The summary points that there is enough evidence against the null hypothesis (F (1, 18) =
6.309, p-value < .05). Therefore, there is a significant relationship between the amount used on
food and beverages monthly expenditure and monthly income. Therefore, monthly income is an
ideal predictor of the amount spent on food and beverages. The average income as the
independent variable could account for 25.95% of the variation. The model indicates that when
there is an increase of $100in income the monthly spending on average and foods is expected to
increase by $5.26.
This model can be used in predicting the expenditure on food and beverages when the
income is $1250
Food and beverage expenditure = 188.6484 + 0.052582(income)
= 188.6484 + 0.052582(1250)
= 254.3759
This means that the amount spent on food when a person is earning $1250 is $254.38.
⊘ This is a preview!⊘
Do you want full access?
Subscribe today to unlock all pages.
Trusted by 1+ million students worldwide
1 out of 16
Related Documents


Your All-in-One AI-Powered Toolkit for Academic Success.
+13062052269
info@desklib.com
Available 24*7 on WhatsApp / Email
![[object Object]](/_next/static/media/star-bottom.7253800d.svg)
Unlock your academic potential
Copyright © 2020–2026 A2Z Services. All Rights Reserved. Developed and managed by ZUCOL.