QMTH104 Quantitative Methods: Business Report on Statistical Analysis
VerifiedAdded on 2023/06/11
|14
|2831
|429
Report
AI Summary
This business report presents a statistical analysis of primary data collected through a survey on household income and expenditure. The report focuses on point and interval estimation of population parameters for three quantitative variables: income, grocery expenses, and utilities expenses. Descriptive statistics, including mean, standard deviation, and variance, are calculated and interpreted using Microsoft Excel. The report details the data collection method, sample questionnaire, and data summary, followed by a thorough descriptive analysis and interval estimation, including the calculation of 95% confidence intervals for the population means of the selected variables. The analysis provides insights into the distribution and variability of the data, with conclusions and recommendations for improving the survey and enhancing the study's purpose. Desklib provides access to this and many other solved assignments.
Running head: BUSINESS REPORT ON QUANTITATIVE METHODS
Business Report On Quantitative Methods
Name of the Student:
Name of the University:
Author Note:
Business Report On Quantitative Methods
Name of the Student:
Name of the University:
Author Note:
Paraphrase This Document
Need a fresh take? Get an instant paraphrase of this document with our AI Paraphraser
1BUSINESS REPORT ON QUANTITATIVE METHODS
Executive Summary
The aim of this paper is to perform statistical analysis on a primary dataset collected by
conducting survey using questionnaire and personal interview method. The required task on
this paper is to perform interval estimation and point estimation of the population parameters
of randomly selected three quantitative variables from the dataset. Moreover, the parameter
estimation is done on a random sample drawn from the dataset. The field from where the
dataset has been collected is a house-hold data and the analysis has been done on the income
and expenditure data. The purpose of this paper is to provide an extensive statistical analysis
using Microsoft Excel Tool. The strength of this paper is to emphasis on the estimation of the
population parameters. The requirement of this paper includes several important steps, from
data collection to interpretation of the data by performing statistical analysis.
2BUSINESS REPORT ON QUANTITATIVE METHODS
Table of Contents
Introduction................................................................................................................................3
Method of Data Collection.........................................................................................................3
Sample Questionnaire............................................................................................................4
Data Summary............................................................................................................................5
Descriptive Data Analysis..........................................................................................................6
i. Summary statistics table and interpretations for Income variable..................................6
ii. Summary statistics table and interpretations for Grocery variable.................................7
iii. Summary statistics table and interpretations for Utilities variable.................................8
Interval Estimation.....................................................................................................................9
i. Confidence interval for Income variable.......................................................................10
ii. Confidence interval for Grocery variable.....................................................................10
iii. Confidence interval for Utilities variable.....................................................................11
Conclusion................................................................................................................................11
Recommendation......................................................................................................................11
References................................................................................................................................13
⊘ This is a preview!⊘
Do you want full access?
Subscribe today to unlock all pages.
Trusted by 1+ million students worldwide
3BUSINESS REPORT ON QUANTITATIVE METHODS
Introduction
The report is prepared on the basis of a primary data collected by conducting a mini
survey using Questionnaire to collect the required data. The purpose of this survey was to
collect data on House-hold income expenditure by asking questions to the members of 250
families of a selected urban locality. After collecting the data, a sample of size 20 is drawn by
generating random numbers. Then, the required data analysis has been performed to analyse
the data based on some selected descriptive statistical measures. This report will help to
understand the method of collecting any primary data in practice by preparing statistical
questionnaire. It will also ensure to acknowledge a dataset using statistical measures. The
statistical measures which have been performed here are the mean, variance, and standard
deviation. After that, the confidence intervals are calculated of these estimated parameters at
a desired confidence level. Then, the required interpretations of these measurements are
discussed in the course of this study. All the required calculation has been performed using
MS Excel tool. At the end of this report, it recommends how these entire survey could be
better and the purpose of the study can be improved (Carlberg 2014).
Method of Data Collection
The study and all the analysis has been done on a primary data. Primary data can be
defined as the type of data which is not existing and not readily available on the internet or
any journals. To collect this primary data, the personal interview using questionnaire method
has been followed. The questionnaire is a list of some questions which are prepared to collect
the data for a particular study. The purpose of choosing questionnaire for data collection as
the method is quite cheap. Another reason for selecting questionnaire method is to maintain
Paraphrase This Document
Need a fresh take? Get an instant paraphrase of this document with our AI Paraphraser
4BUSINESS REPORT ON QUANTITATIVE METHODS
the privacy. Instead of asking the respondents verbally about their incomes, educational
qualifications, and expenses, the questionnaire will help to collect the sensitive information
without hesitation of the respondents and also to avoid the ignorance of the respondents to
answer certain private questions. The questionnaire has been prepared with a combination of
eight to ten open-ended and close-ended questions (Pietkiewicz and Smith 2014). In this
survey, the researcher personally visited every household, then the questionnaire was given to
the member of each household, preferably to the head of the household. The respondents
were asked to fill the questionnaire within a stipulated time. Then, the filled questionnaires
were collected. The data was collected for the following fields from 250 households-
Household id, Income, Expense for groceries, Expense for Alcohol consumption,
Expense for Meals, Cost incurred for Fuel, Cloth, Phone bills, and Utilities, Number of
children and adults in the family, Whether the family own a house or not (if “Yes” then it is
mentioned by 1; if “No” then it is mentioned by 0), The education level of the head member
of the family (“P” stands for Primary, “S” stands for Secondary, “I” for Intermediate, “B”
indicates Bachelors, and “M” shows Masters), and lastly, the gender of the head of the
household ( “M” for Male, and “F” for Female).
Thus, the size of the population data is 250.
The set of questions, arranged in the Questionnaire are described below:
Sample Questionnaire
Q.1. What is the household ID number?
Q.2. What is the total monthly income?
Q.3. What is are expenses incurred for Grocery, Alcohol, Meals, Fuel, Cloth, Phone bills, and
Utilities?
5BUSINESS REPORT ON QUANTITATIVE METHODS
Q.4. How many children are there in the family?
Q.5. What is number of adult members in the family?
Q.6. Whether the Family owns a house? (Mention “Yes” or “No”)
Q.7. What is highest educational qualification possessed by the head of the household/ the
earning member of the family? (Indicate “P” for Primary, “S” for Secondary, “I” for
Intermediate, “B” for Bachelors, and “M” for Masters)
Q.8. What is the gender of the head of the household? (Indicate “M” for Male, “F” for
Female)
It was found that, there were no missing data field, all the respondents have answered
all the questions. After the data collection, the random numbers are drawn corresponding to
the dataset on the Excel sheet using the Data Analysis Tool Pak. Then, the random numbers
are sorted in the ascending order and a sample of size 20 is drawn for further calculation.
Data Summary
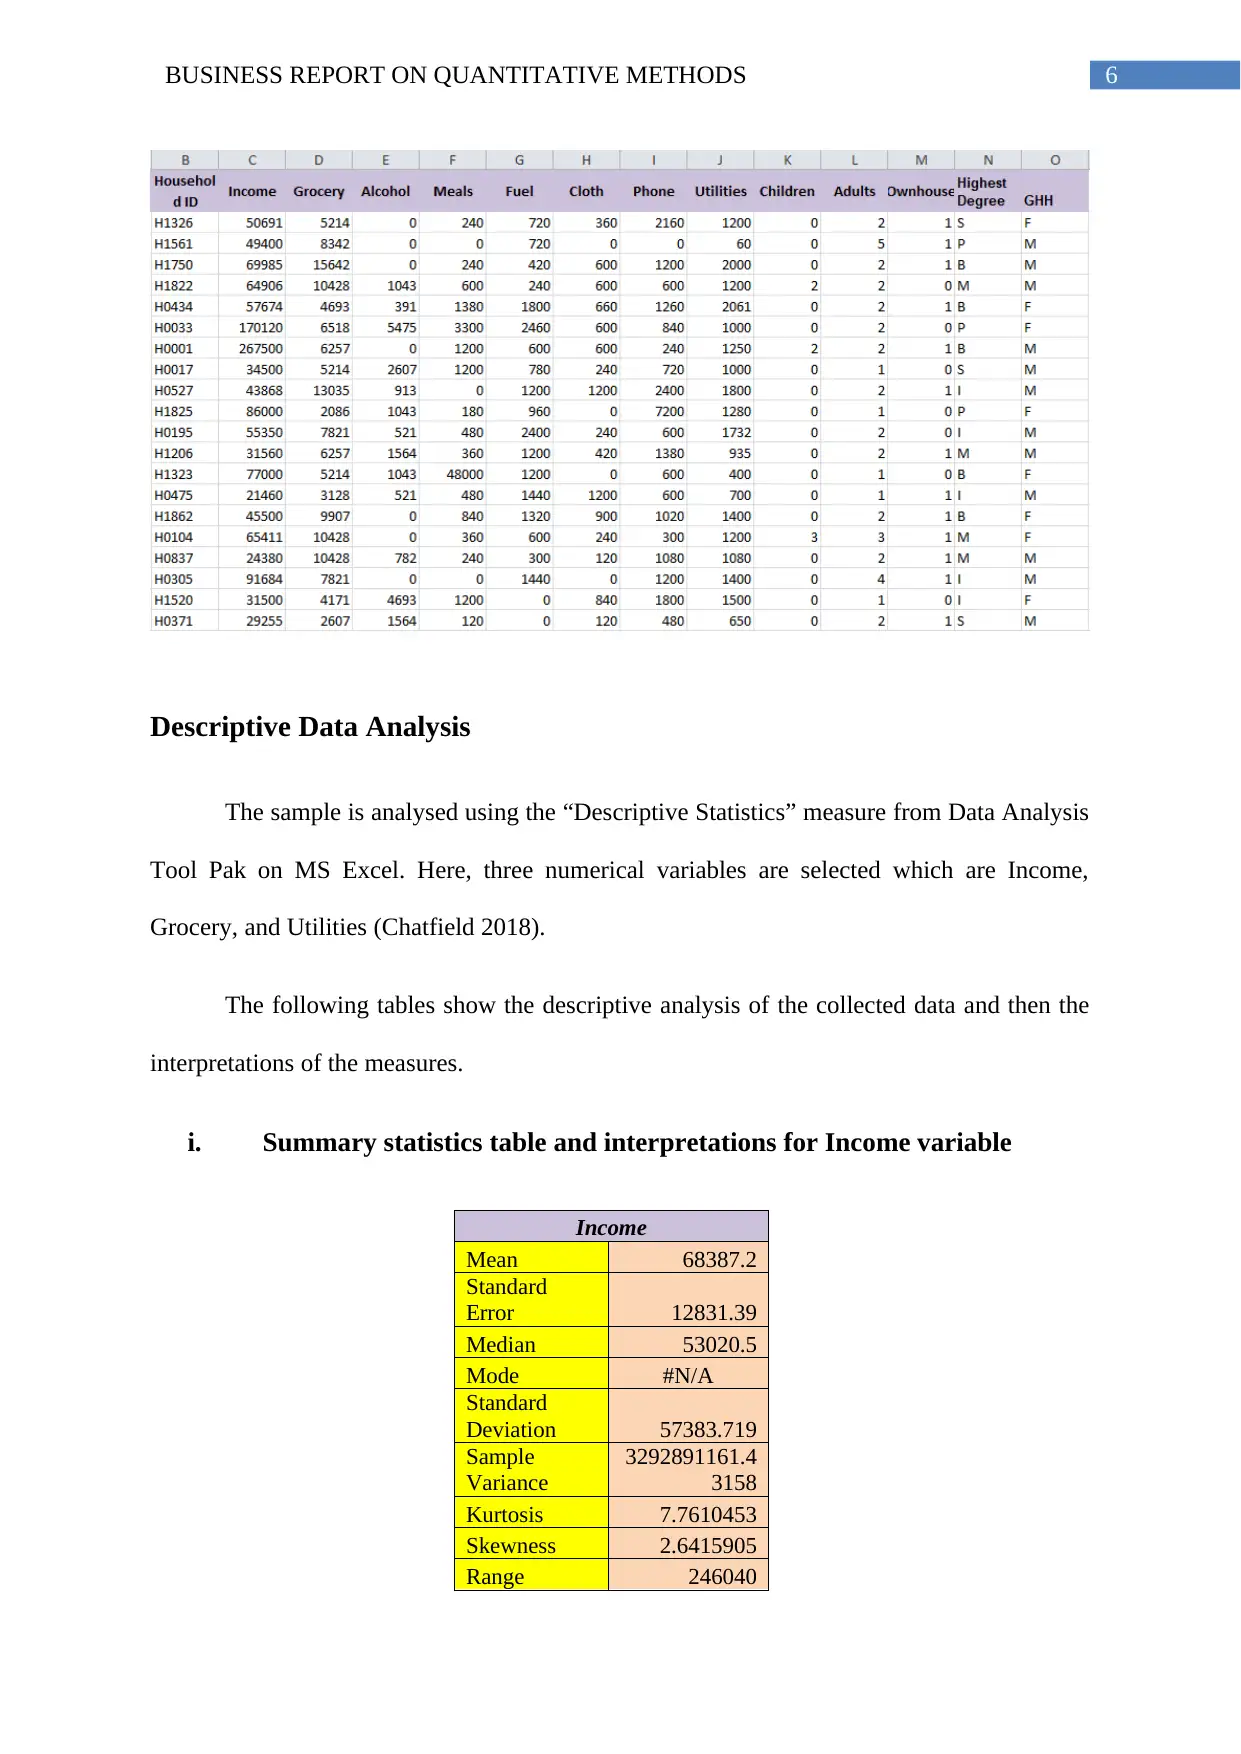
The entire dataset has 250 responses on fourteen variables namely- Household ID,
Income Grocery, Alcohol, Meals, Fuel, Cloth, Phone, Utilities, Children, Adults, Ownhouse,
Highest Degree, and GHH. Among them, there are some categorical or qualitative variables
namely, Ownhouse, Highest Degree, and GHH. Rest of the variables are quantitative. From
this population, a sample of size 20 is drawn using Simple Random Sampling with
Replacement (SRSWR) technique by generating 250 random numbers.
The following image shows the sample of the data.
Q.4. How many children are there in the family?
Q.5. What is number of adult members in the family?
Q.6. Whether the Family owns a house? (Mention “Yes” or “No”)
Q.7. What is highest educational qualification possessed by the head of the household/ the
earning member of the family? (Indicate “P” for Primary, “S” for Secondary, “I” for
Intermediate, “B” for Bachelors, and “M” for Masters)
Q.8. What is the gender of the head of the household? (Indicate “M” for Male, “F” for
Female)
It was found that, there were no missing data field, all the respondents have answered
all the questions. After the data collection, the random numbers are drawn corresponding to
the dataset on the Excel sheet using the Data Analysis Tool Pak. Then, the random numbers
are sorted in the ascending order and a sample of size 20 is drawn for further calculation.
Data Summary
The entire dataset has 250 responses on fourteen variables namely- Household ID,
Income Grocery, Alcohol, Meals, Fuel, Cloth, Phone, Utilities, Children, Adults, Ownhouse,
Highest Degree, and GHH. Among them, there are some categorical or qualitative variables
namely, Ownhouse, Highest Degree, and GHH. Rest of the variables are quantitative. From
this population, a sample of size 20 is drawn using Simple Random Sampling with
Replacement (SRSWR) technique by generating 250 random numbers.
The following image shows the sample of the data.
⊘ This is a preview!⊘
Do you want full access?
Subscribe today to unlock all pages.
Trusted by 1+ million students worldwide
6BUSINESS REPORT ON QUANTITATIVE METHODS
Descriptive Data Analysis
The sample is analysed using the “Descriptive Statistics” measure from Data Analysis
Tool Pak on MS Excel. Here, three numerical variables are selected which are Income,
Grocery, and Utilities (Chatfield 2018).
The following tables show the descriptive analysis of the collected data and then the
interpretations of the measures.
i. Summary statistics table and interpretations for Income variable
Income
Mean 68387.2
Standard
Error 12831.39
Median 53020.5
Mode #N/A
Standard
Deviation 57383.719
Sample
Variance
3292891161.4
3158
Kurtosis 7.7610453
Skewness 2.6415905
Range 246040
Paraphrase This Document
Need a fresh take? Get an instant paraphrase of this document with our AI Paraphraser

7BUSINESS REPORT ON QUANTITATIVE METHODS
Minimum 21460
Maximum 267500
Sum 1367744
Count 20
Largest(1) 267500
Smallest(1) 21460
The mean value is 68387.2 which is the center of the data. The data points are
scattered around this average value. The standard deviation is 57383.719 which indicate
that the values of the Income variable are expanded by this value from the mean value.
The sample variance is holding a very large value which is 3292891161.43158. The
sample variance is a measure of dispersion of the data that is, it is the measurement of the
spread of the values from the mean value. A large variance value suggests that values of
the Income variable are far from the average as well as from each other.
ii. Summary statistics table and interpretations for Grocery variable
Grocery
Mean 7260.55
Standard Error 793.510586
Median 6387.5
Mode 5214
Standard
Deviation 3548.68722
Sample Variance 12593181
Kurtosis 0.13516015
Skewness 0.67045201
Range 13556
Minimum 2086
Maximum 15642
Sum 145211
Count 20
Largest(1) 15642
Smallest(1) 2086
8BUSINESS REPORT ON QUANTITATIVE METHODS
The center of the data lies at the point 7260.55 as the mean value is 7260.55. The
measure of dispersion standard deviation (s.d.) shows the value 3548.687222 and the squared
value of the s.d. is the sample variance which holds the value 12593181. Again, the high
variance value indicates that the values of the cost for purchasing Grocery items are spread
out from one another and they are scattered far away from the mean value.
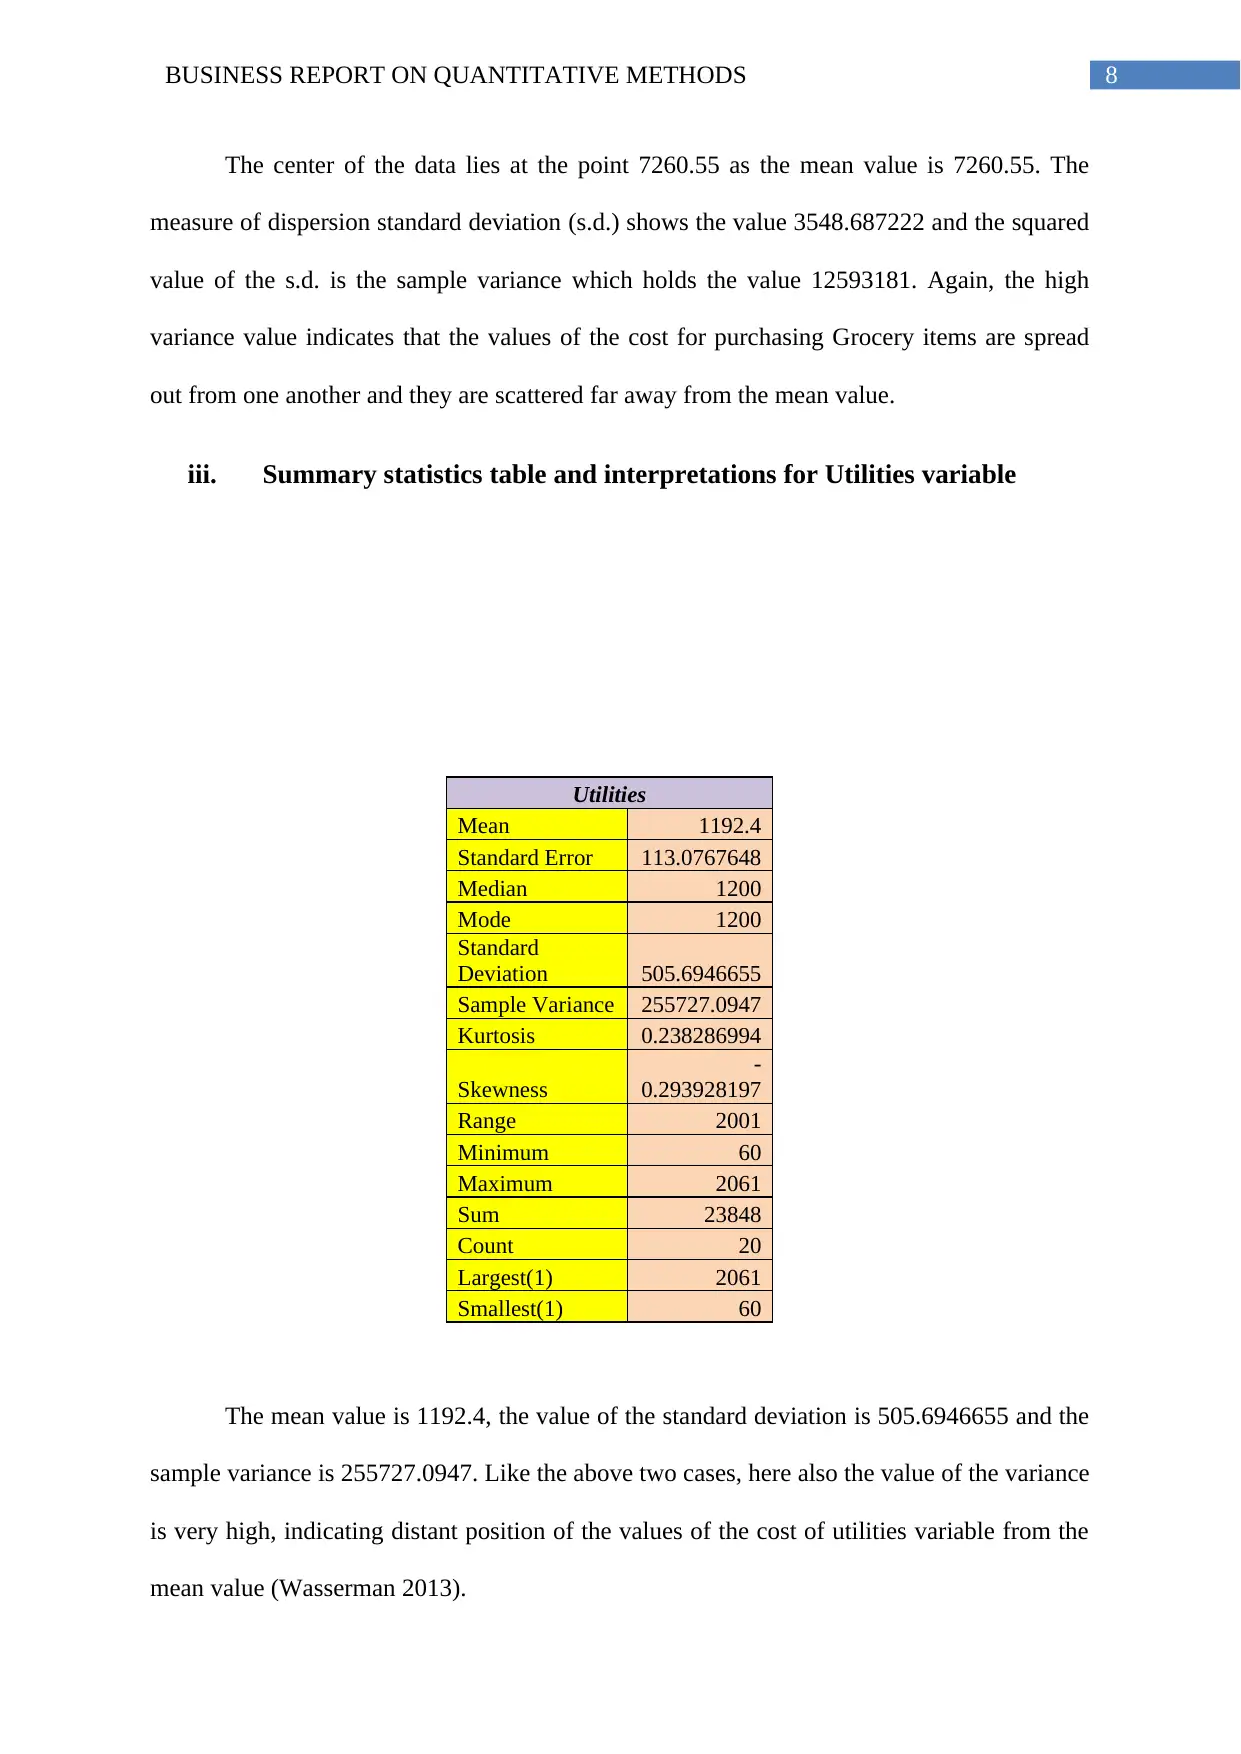
iii. Summary statistics table and interpretations for Utilities variable
Utilities
Mean 1192.4
Standard Error 113.0767648
Median 1200
Mode 1200
Standard
Deviation 505.6946655
Sample Variance 255727.0947
Kurtosis 0.238286994
Skewness
-
0.293928197
Range 2001
Minimum 60
Maximum 2061
Sum 23848
Count 20
Largest(1) 2061
Smallest(1) 60
The mean value is 1192.4, the value of the standard deviation is 505.6946655 and the
sample variance is 255727.0947. Like the above two cases, here also the value of the variance
is very high, indicating distant position of the values of the cost of utilities variable from the
mean value (Wasserman 2013).
The center of the data lies at the point 7260.55 as the mean value is 7260.55. The
measure of dispersion standard deviation (s.d.) shows the value 3548.687222 and the squared
value of the s.d. is the sample variance which holds the value 12593181. Again, the high
variance value indicates that the values of the cost for purchasing Grocery items are spread
out from one another and they are scattered far away from the mean value.
iii. Summary statistics table and interpretations for Utilities variable
Utilities
Mean 1192.4
Standard Error 113.0767648
Median 1200
Mode 1200
Standard
Deviation 505.6946655
Sample Variance 255727.0947
Kurtosis 0.238286994
Skewness
-
0.293928197
Range 2001
Minimum 60
Maximum 2061
Sum 23848
Count 20
Largest(1) 2061
Smallest(1) 60
The mean value is 1192.4, the value of the standard deviation is 505.6946655 and the
sample variance is 255727.0947. Like the above two cases, here also the value of the variance
is very high, indicating distant position of the values of the cost of utilities variable from the
mean value (Wasserman 2013).
⊘ This is a preview!⊘
Do you want full access?
Subscribe today to unlock all pages.
Trusted by 1+ million students worldwide
9BUSINESS REPORT ON QUANTITATIVE METHODS
Interval Estimation
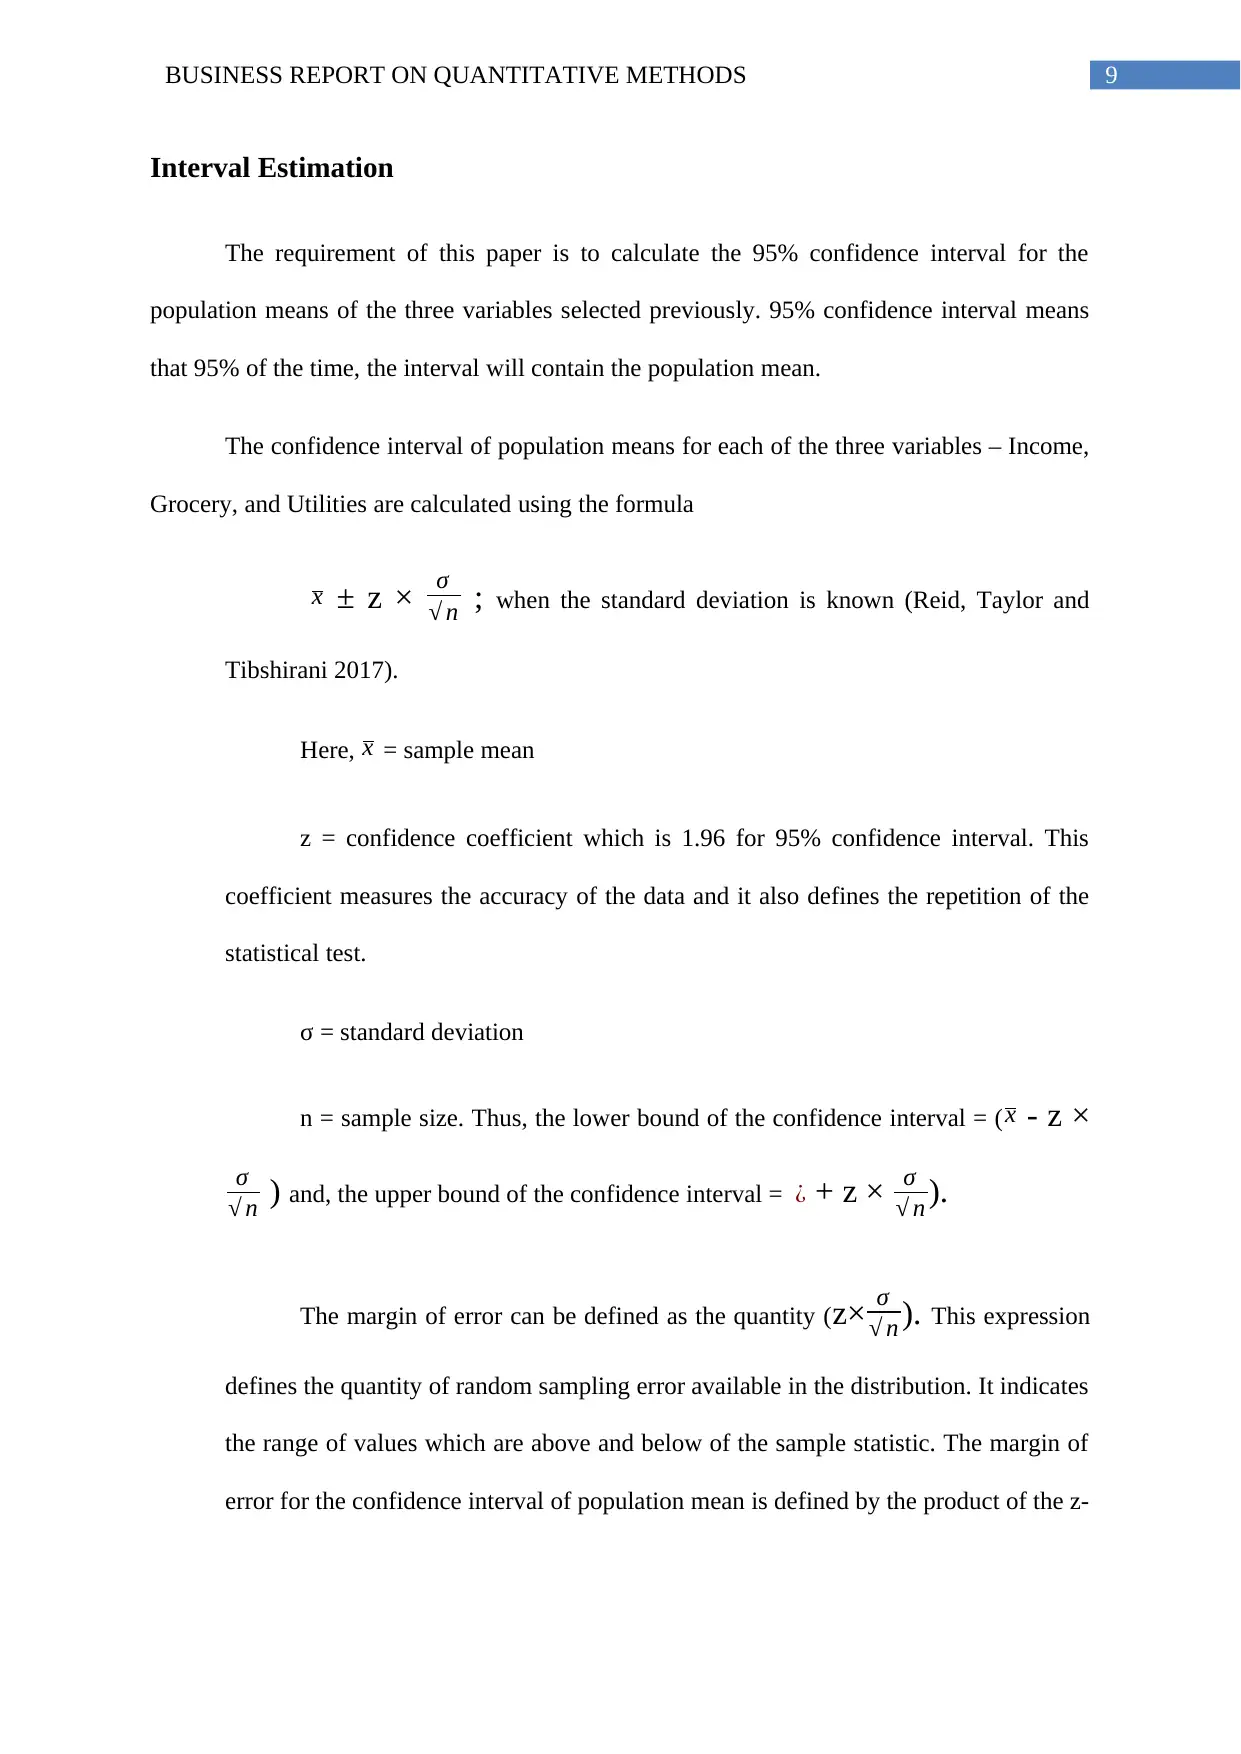
The requirement of this paper is to calculate the 95% confidence interval for the
population means of the three variables selected previously. 95% confidence interval means
that 95% of the time, the interval will contain the population mean.
The confidence interval of population means for each of the three variables – Income,
Grocery, and Utilities are calculated using the formula
x ± z × σ
√ n ; when the standard deviation is known (Reid, Taylor and
Tibshirani 2017).
Here, x = sample mean
z = confidence coefficient which is 1.96 for 95% confidence interval. This
coefficient measures the accuracy of the data and it also defines the repetition of the
statistical test.
σ = standard deviation
n = sample size. Thus, the lower bound of the confidence interval = ( x - z ×
σ
√ n ) and, the upper bound of the confidence interval = ¿ + z × σ
√ n ).
The margin of error can be defined as the quantity (z× σ
√ n ). This expression
defines the quantity of random sampling error available in the distribution. It indicates
the range of values which are above and below of the sample statistic. The margin of
error for the confidence interval of population mean is defined by the product of the z-
Interval Estimation
The requirement of this paper is to calculate the 95% confidence interval for the
population means of the three variables selected previously. 95% confidence interval means
that 95% of the time, the interval will contain the population mean.
The confidence interval of population means for each of the three variables – Income,
Grocery, and Utilities are calculated using the formula
x ± z × σ
√ n ; when the standard deviation is known (Reid, Taylor and
Tibshirani 2017).
Here, x = sample mean
z = confidence coefficient which is 1.96 for 95% confidence interval. This
coefficient measures the accuracy of the data and it also defines the repetition of the
statistical test.
σ = standard deviation
n = sample size. Thus, the lower bound of the confidence interval = ( x - z ×
σ
√ n ) and, the upper bound of the confidence interval = ¿ + z × σ
√ n ).
The margin of error can be defined as the quantity (z× σ
√ n ). This expression
defines the quantity of random sampling error available in the distribution. It indicates
the range of values which are above and below of the sample statistic. The margin of
error for the confidence interval of population mean is defined by the product of the z-
Paraphrase This Document
Need a fresh take? Get an instant paraphrase of this document with our AI Paraphraser
10BUSINESS REPORT ON QUANTITATIVE METHODS
score and ( σ
√ n ). From the standard normal table, the value of z-score at 95%
confidence interval is 1.96.
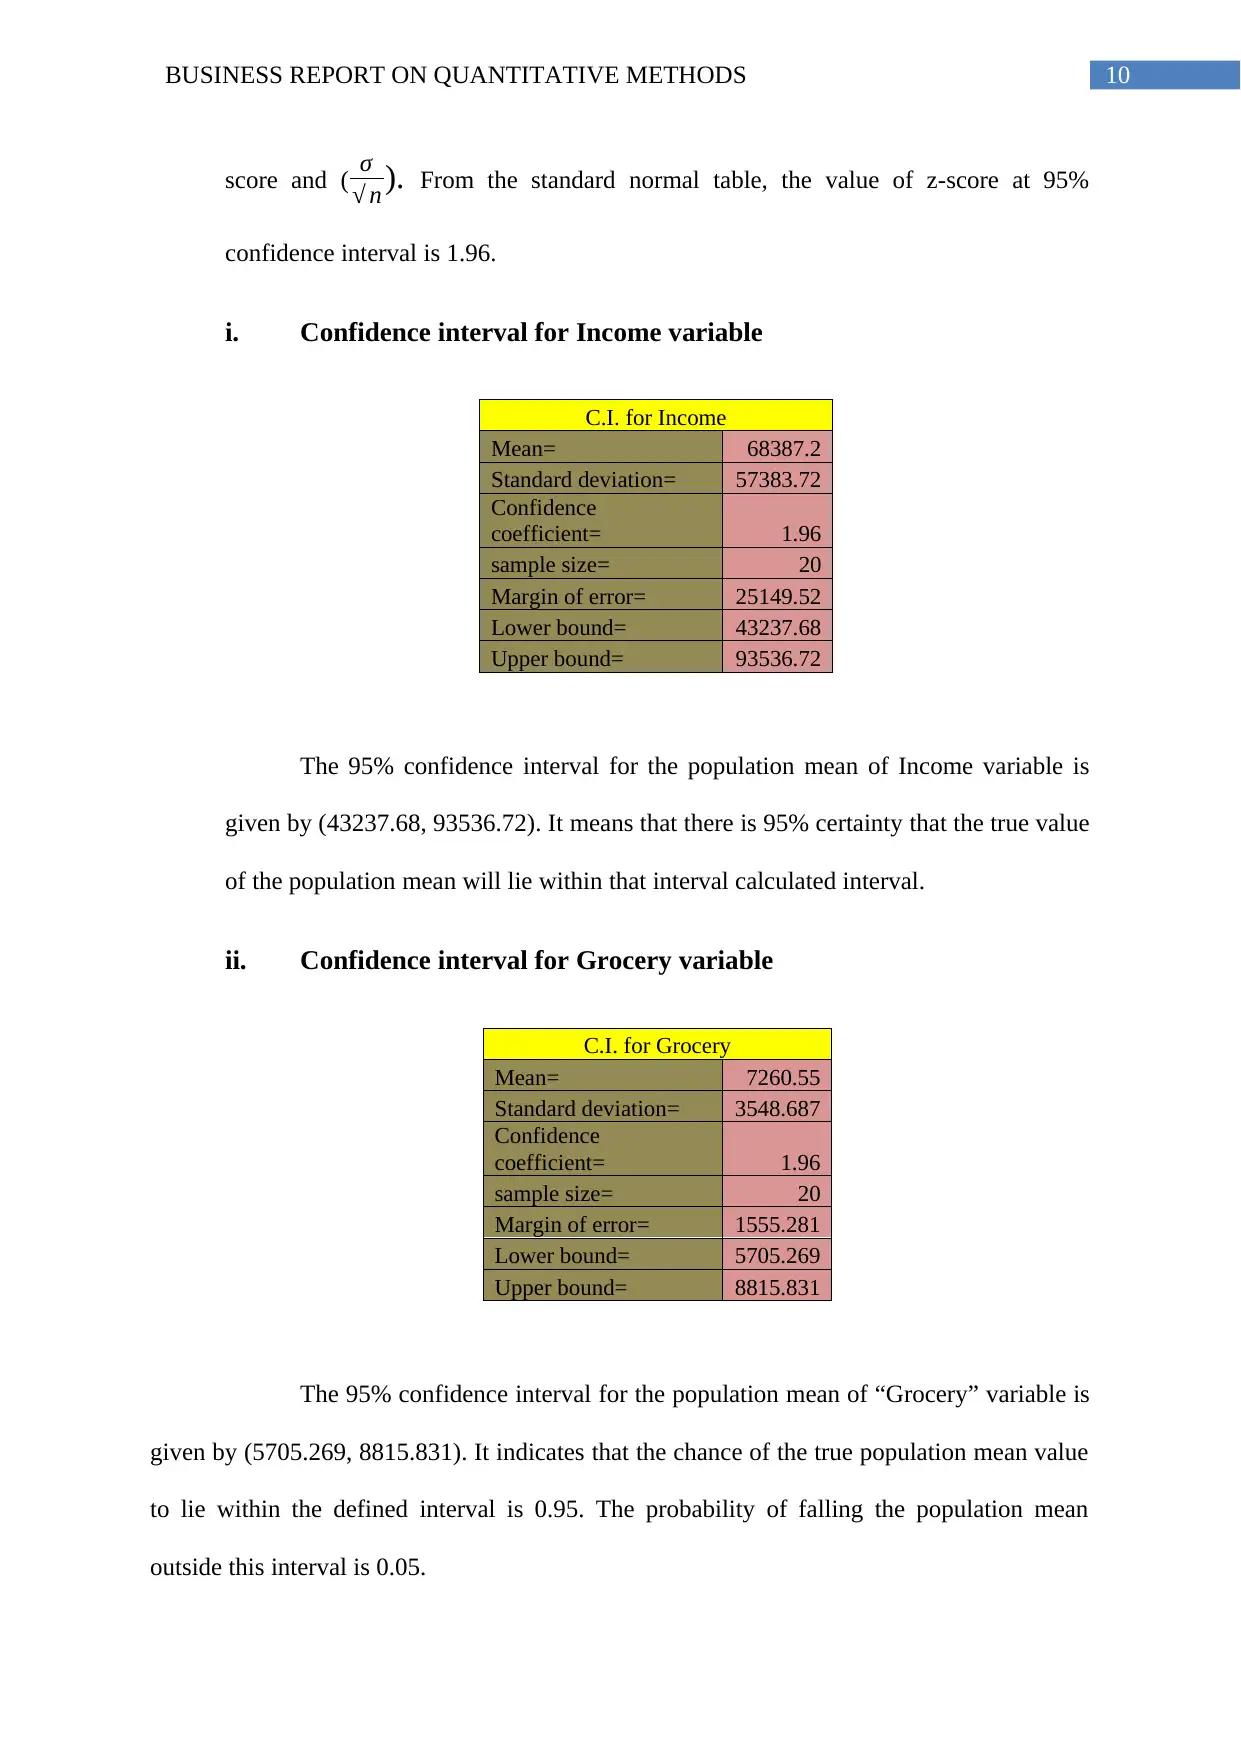
i. Confidence interval for Income variable
C.I. for Income
Mean= 68387.2
Standard deviation= 57383.72
Confidence
coefficient= 1.96
sample size= 20
Margin of error= 25149.52
Lower bound= 43237.68
Upper bound= 93536.72
The 95% confidence interval for the population mean of Income variable is
given by (43237.68, 93536.72). It means that there is 95% certainty that the true value
of the population mean will lie within that interval calculated interval.
ii. Confidence interval for Grocery variable
C.I. for Grocery
Mean= 7260.55
Standard deviation= 3548.687
Confidence
coefficient= 1.96
sample size= 20
Margin of error= 1555.281
Lower bound= 5705.269
Upper bound= 8815.831
The 95% confidence interval for the population mean of “Grocery” variable is
given by (5705.269, 8815.831). It indicates that the chance of the true population mean value
to lie within the defined interval is 0.95. The probability of falling the population mean
outside this interval is 0.05.
score and ( σ
√ n ). From the standard normal table, the value of z-score at 95%
confidence interval is 1.96.
i. Confidence interval for Income variable
C.I. for Income
Mean= 68387.2
Standard deviation= 57383.72
Confidence
coefficient= 1.96
sample size= 20
Margin of error= 25149.52
Lower bound= 43237.68
Upper bound= 93536.72
The 95% confidence interval for the population mean of Income variable is
given by (43237.68, 93536.72). It means that there is 95% certainty that the true value
of the population mean will lie within that interval calculated interval.
ii. Confidence interval for Grocery variable
C.I. for Grocery
Mean= 7260.55
Standard deviation= 3548.687
Confidence
coefficient= 1.96
sample size= 20
Margin of error= 1555.281
Lower bound= 5705.269
Upper bound= 8815.831
The 95% confidence interval for the population mean of “Grocery” variable is
given by (5705.269, 8815.831). It indicates that the chance of the true population mean value
to lie within the defined interval is 0.95. The probability of falling the population mean
outside this interval is 0.05.
11BUSINESS REPORT ON QUANTITATIVE METHODS
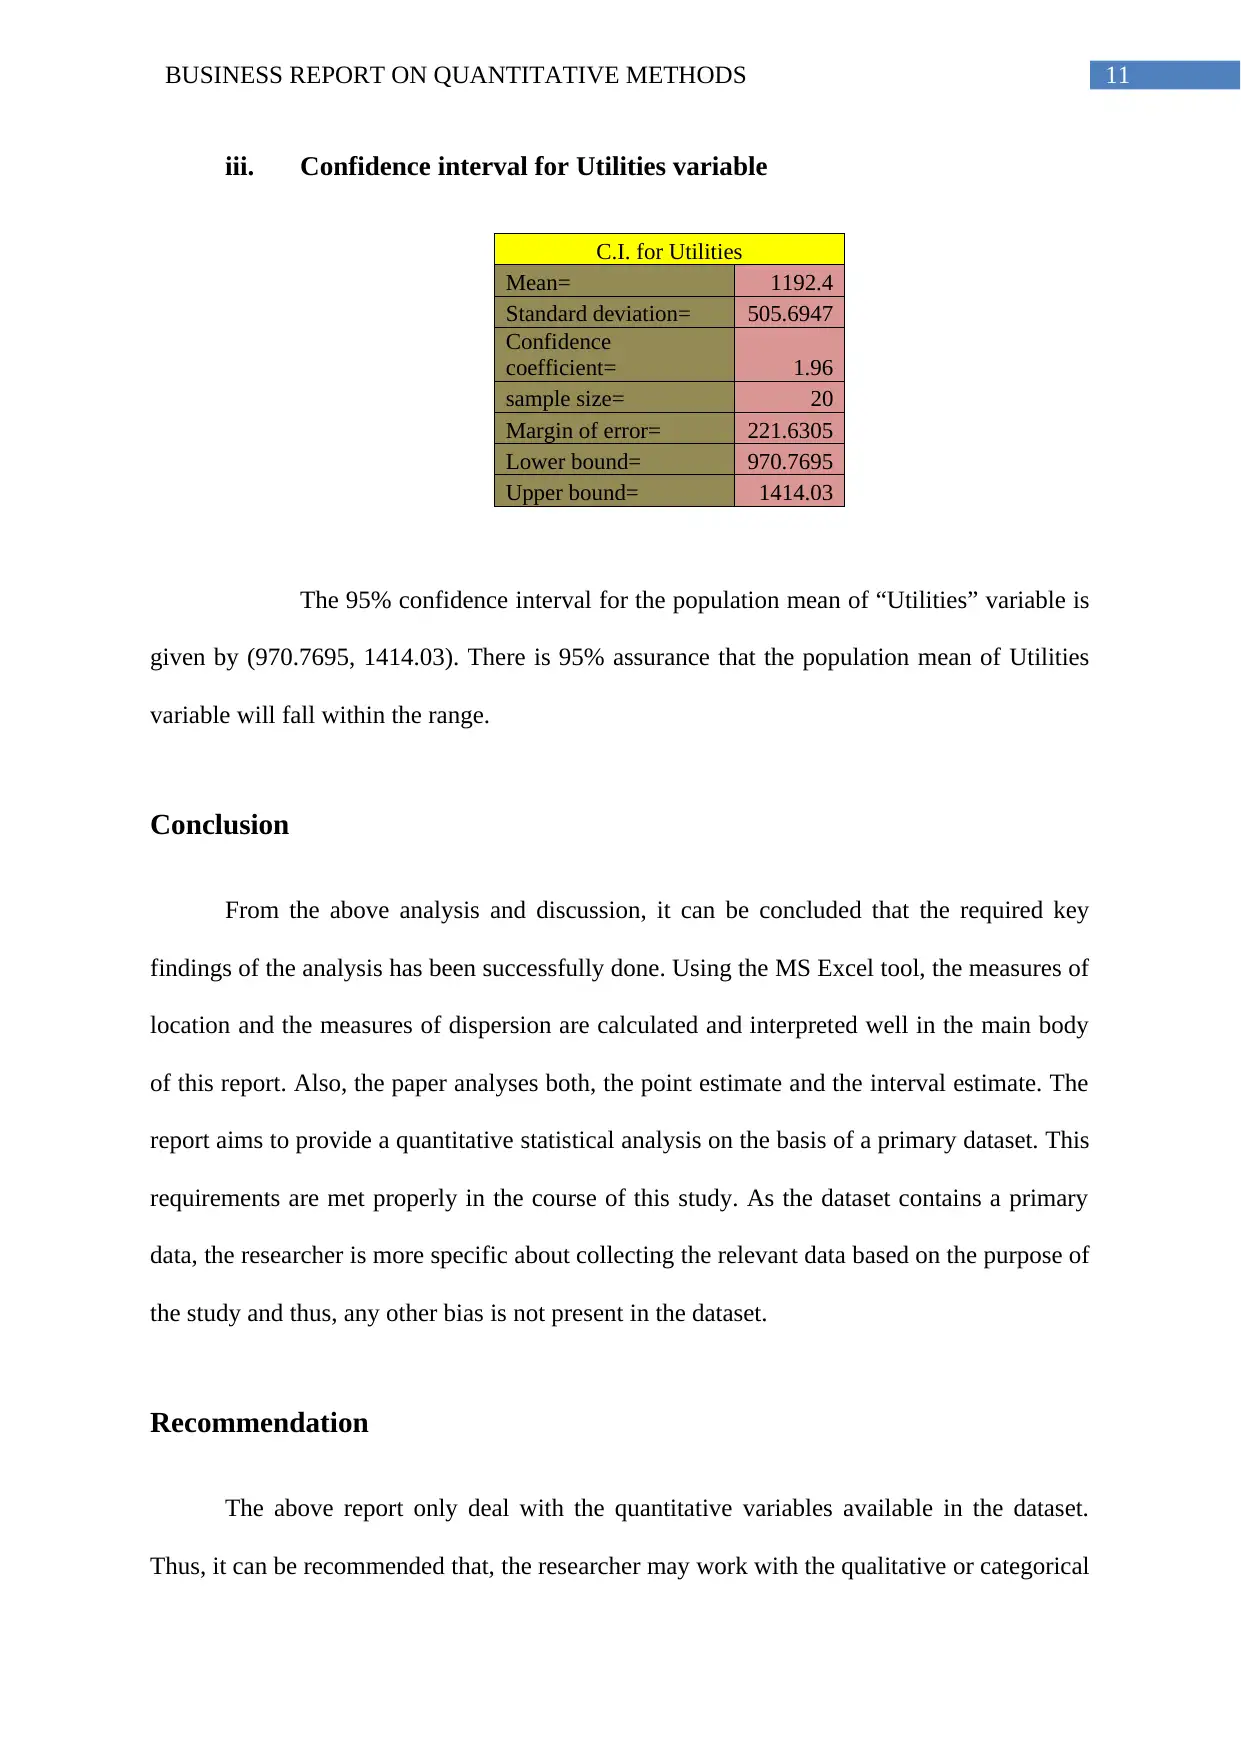
iii. Confidence interval for Utilities variable
C.I. for Utilities
Mean= 1192.4
Standard deviation= 505.6947
Confidence
coefficient= 1.96
sample size= 20
Margin of error= 221.6305
Lower bound= 970.7695
Upper bound= 1414.03
The 95% confidence interval for the population mean of “Utilities” variable is
given by (970.7695, 1414.03). There is 95% assurance that the population mean of Utilities
variable will fall within the range.
Conclusion
From the above analysis and discussion, it can be concluded that the required key
findings of the analysis has been successfully done. Using the MS Excel tool, the measures of
location and the measures of dispersion are calculated and interpreted well in the main body
of this report. Also, the paper analyses both, the point estimate and the interval estimate. The
report aims to provide a quantitative statistical analysis on the basis of a primary dataset. This
requirements are met properly in the course of this study. As the dataset contains a primary
data, the researcher is more specific about collecting the relevant data based on the purpose of
the study and thus, any other bias is not present in the dataset.
Recommendation
The above report only deal with the quantitative variables available in the dataset.
Thus, it can be recommended that, the researcher may work with the qualitative or categorical
⊘ This is a preview!⊘
Do you want full access?
Subscribe today to unlock all pages.
Trusted by 1+ million students worldwide
1 out of 14
Related Documents


Your All-in-One AI-Powered Toolkit for Academic Success.
+13062052269
info@desklib.com
Available 24*7 on WhatsApp / Email
![[object Object]](/_next/static/media/star-bottom.7253800d.svg)
Unlock your academic potential
Copyright © 2020–2026 A2Z Services. All Rights Reserved. Developed and managed by ZUCOL.