QMTH104 - International Students Expenditure Patterns in Melbourne
VerifiedAdded on 2023/06/11
|27
|4227
|137
Report
AI Summary
This report examines the expenditure patterns of international students in Melbourne, Victoria, utilizing survey data to analyze spending on rent, food, medical expenses, entertainment, and internet. The study identifies that apartments costing less than 1000 AUD are popular, and students allocate significant funds to food and entertainment. The findings suggest that businesses in Victoria could benefit from catering to these spending habits. The report includes descriptive statistics and graphical representations of the data, focusing on gender, country of origin, marital status, educational qualifications, and occupation. Confidence interval estimations are provided for rent, internet, and entertainment expenditures. The conclusion highlights business opportunities arising from the international student population in Melbourne.
Running head: EXPENDITURE OF INTERNATIONAL STUDENTS IN MELBOURNE,
VICTORIA
Expenditure Patterns of International Students in Melbourne, Victoria
(Expat Survey 2018)
Report to
Write your lecturer’s name here
KXXXXXX – Student Name
KXXXXXX – Student Name
KXXXXXX – Student Name
KXXXXXX – Student Name
VICTORIA
Expenditure Patterns of International Students in Melbourne, Victoria
(Expat Survey 2018)
Report to
Write your lecturer’s name here
KXXXXXX – Student Name
KXXXXXX – Student Name
KXXXXXX – Student Name
KXXXXXX – Student Name
Paraphrase This Document
Need a fresh take? Get an instant paraphrase of this document with our AI Paraphraser
Executive Summary
The paper reports on the pattern of expenditure of international students in Victoria,
Melbourne. It makes use of survey data to analyze and infer about the existing patterns using
statistical descriptive and graphical tools as well as estimation techniques.
The data focuses on expenses in rent, food, medical expenses, entertainment and
internet charges and connects this with opportunities for business that exist in the area. It was
found that apartments costing less than 1000 AUD are popular among the students. They also
have significant expenditure on food and also spend considerably on entertainment.
Thus businesses in these areas would do well to consider Victoria as a lucrative option
for setting up their business.
2
Contents
Executive Summary...................................................................................................................1
Introduction................................................................................................................................5
Aim of the report....................................................................................................................5
Objective of the report............................................................................................................6
Scope of the report..................................................................................................................6
Method of data collection...........................................................................................................6
Summary of the data set.............................................................................................................8
Gender....................................................................................................................................9
Country...................................................................................................................................9
3
⊘ This is a preview!⊘
Do you want full access?
Subscribe today to unlock all pages.
Trusted by 1+ million students worldwide
Marital status........................................................................................................................11
Educational Qualifications...................................................................................................12
Occupation............................................................................................................................13
Rent expenditure...................................................................................................................14
Daily Internet expenditure....................................................................................................16
Entertainment expenditure....................................................................................................18
Health expenditure................................................................................................................20
Food expenditure..................................................................................................................23
Confidence interval estimation................................................................................................25
Rent expenditure...................................................................................................................25
Daily Internet expenditure....................................................................................................25
Entertainment expenditure....................................................................................................25
Conclusion and recommendations...........................................................................................26
List of references......................................................................................................................27
4
Paraphrase This Document
Need a fresh take? Get an instant paraphrase of this document with our AI Paraphraser
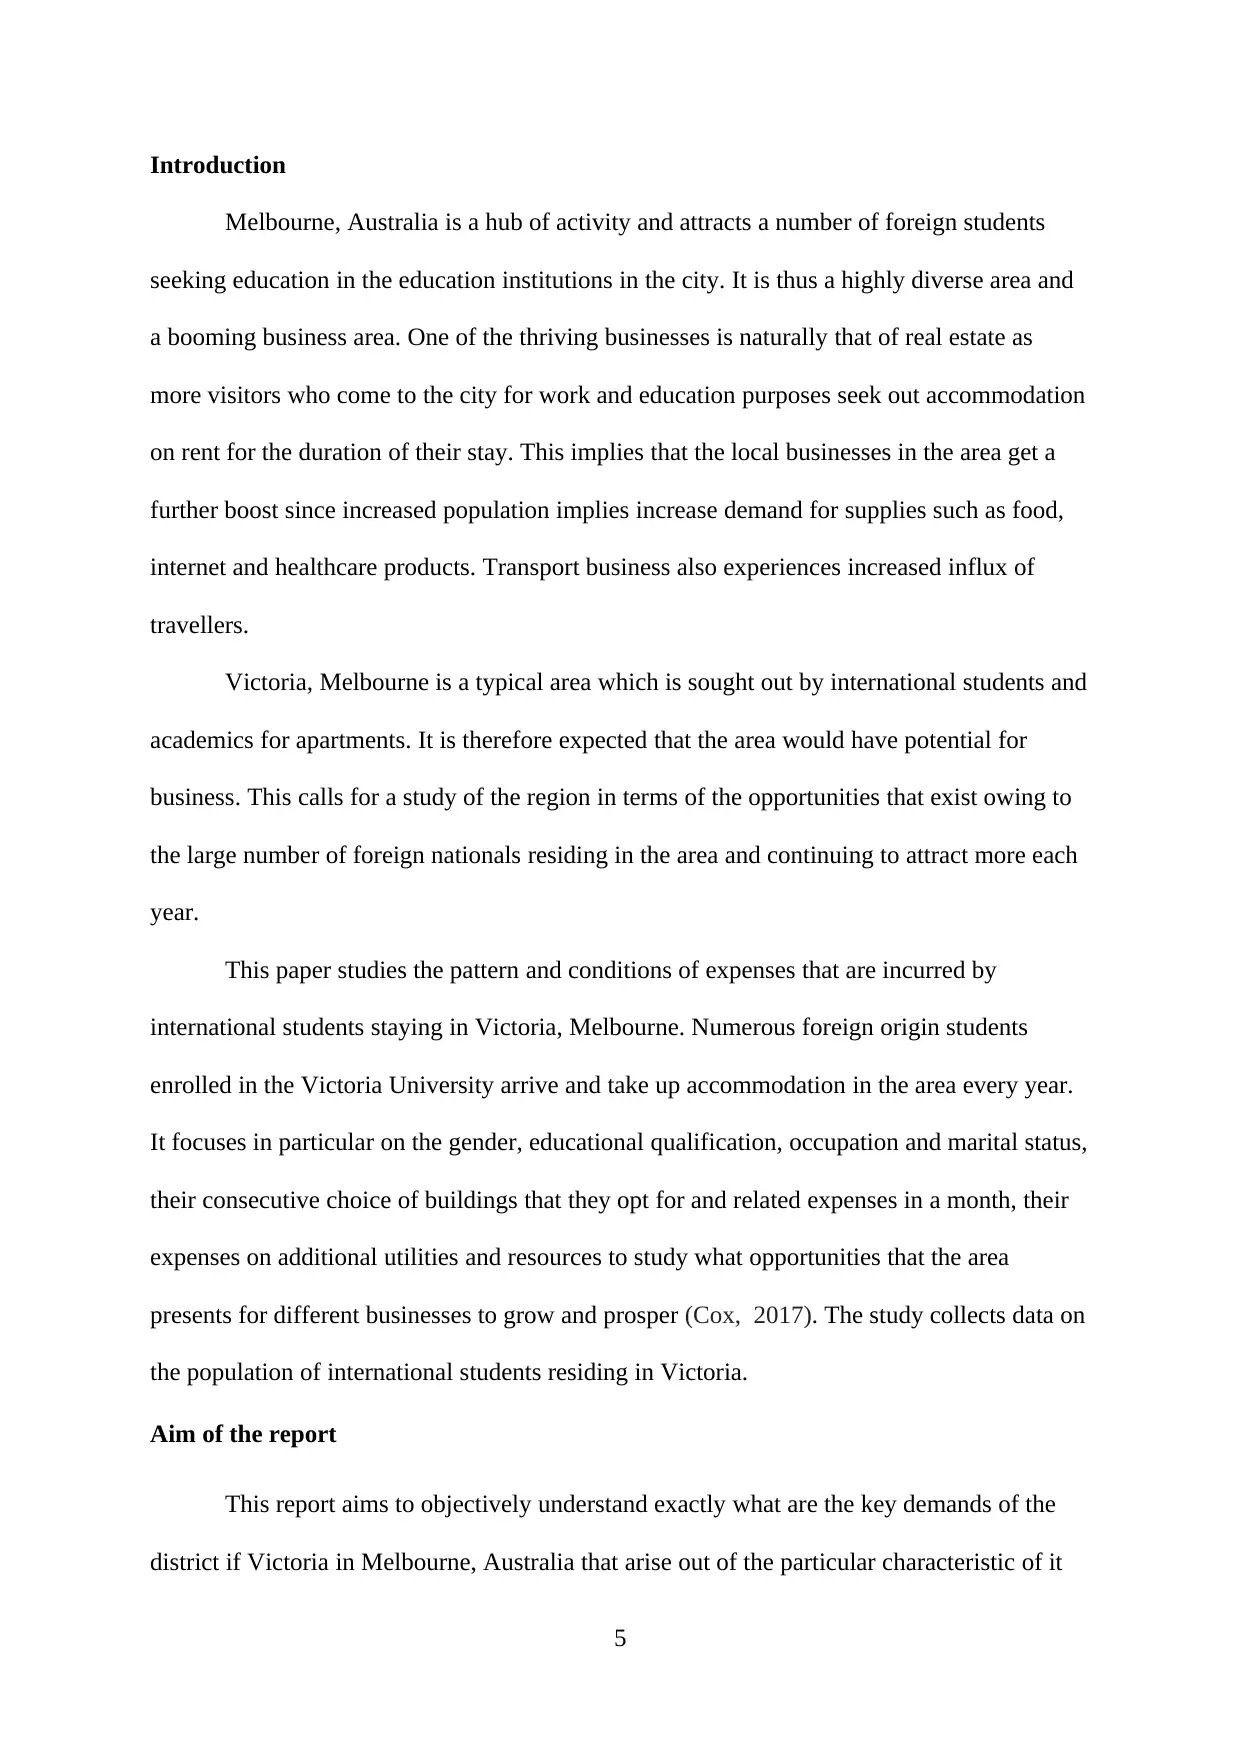
Introduction
Melbourne, Australia is a hub of activity and attracts a number of foreign students
seeking education in the education institutions in the city. It is thus a highly diverse area and
a booming business area. One of the thriving businesses is naturally that of real estate as
more visitors who come to the city for work and education purposes seek out accommodation
on rent for the duration of their stay. This implies that the local businesses in the area get a
further boost since increased population implies increase demand for supplies such as food,
internet and healthcare products. Transport business also experiences increased influx of
travellers.
Victoria, Melbourne is a typical area which is sought out by international students and
academics for apartments. It is therefore expected that the area would have potential for
business. This calls for a study of the region in terms of the opportunities that exist owing to
the large number of foreign nationals residing in the area and continuing to attract more each
year.
This paper studies the pattern and conditions of expenses that are incurred by
international students staying in Victoria, Melbourne. Numerous foreign origin students
enrolled in the Victoria University arrive and take up accommodation in the area every year.
It focuses in particular on the gender, educational qualification, occupation and marital status,
their consecutive choice of buildings that they opt for and related expenses in a month, their
expenses on additional utilities and resources to study what opportunities that the area
presents for different businesses to grow and prosper (Cox, 2017). The study collects data on
the population of international students residing in Victoria.
Aim of the report
This report aims to objectively understand exactly what are the key demands of the
district if Victoria in Melbourne, Australia that arise out of the particular characteristic of it
5
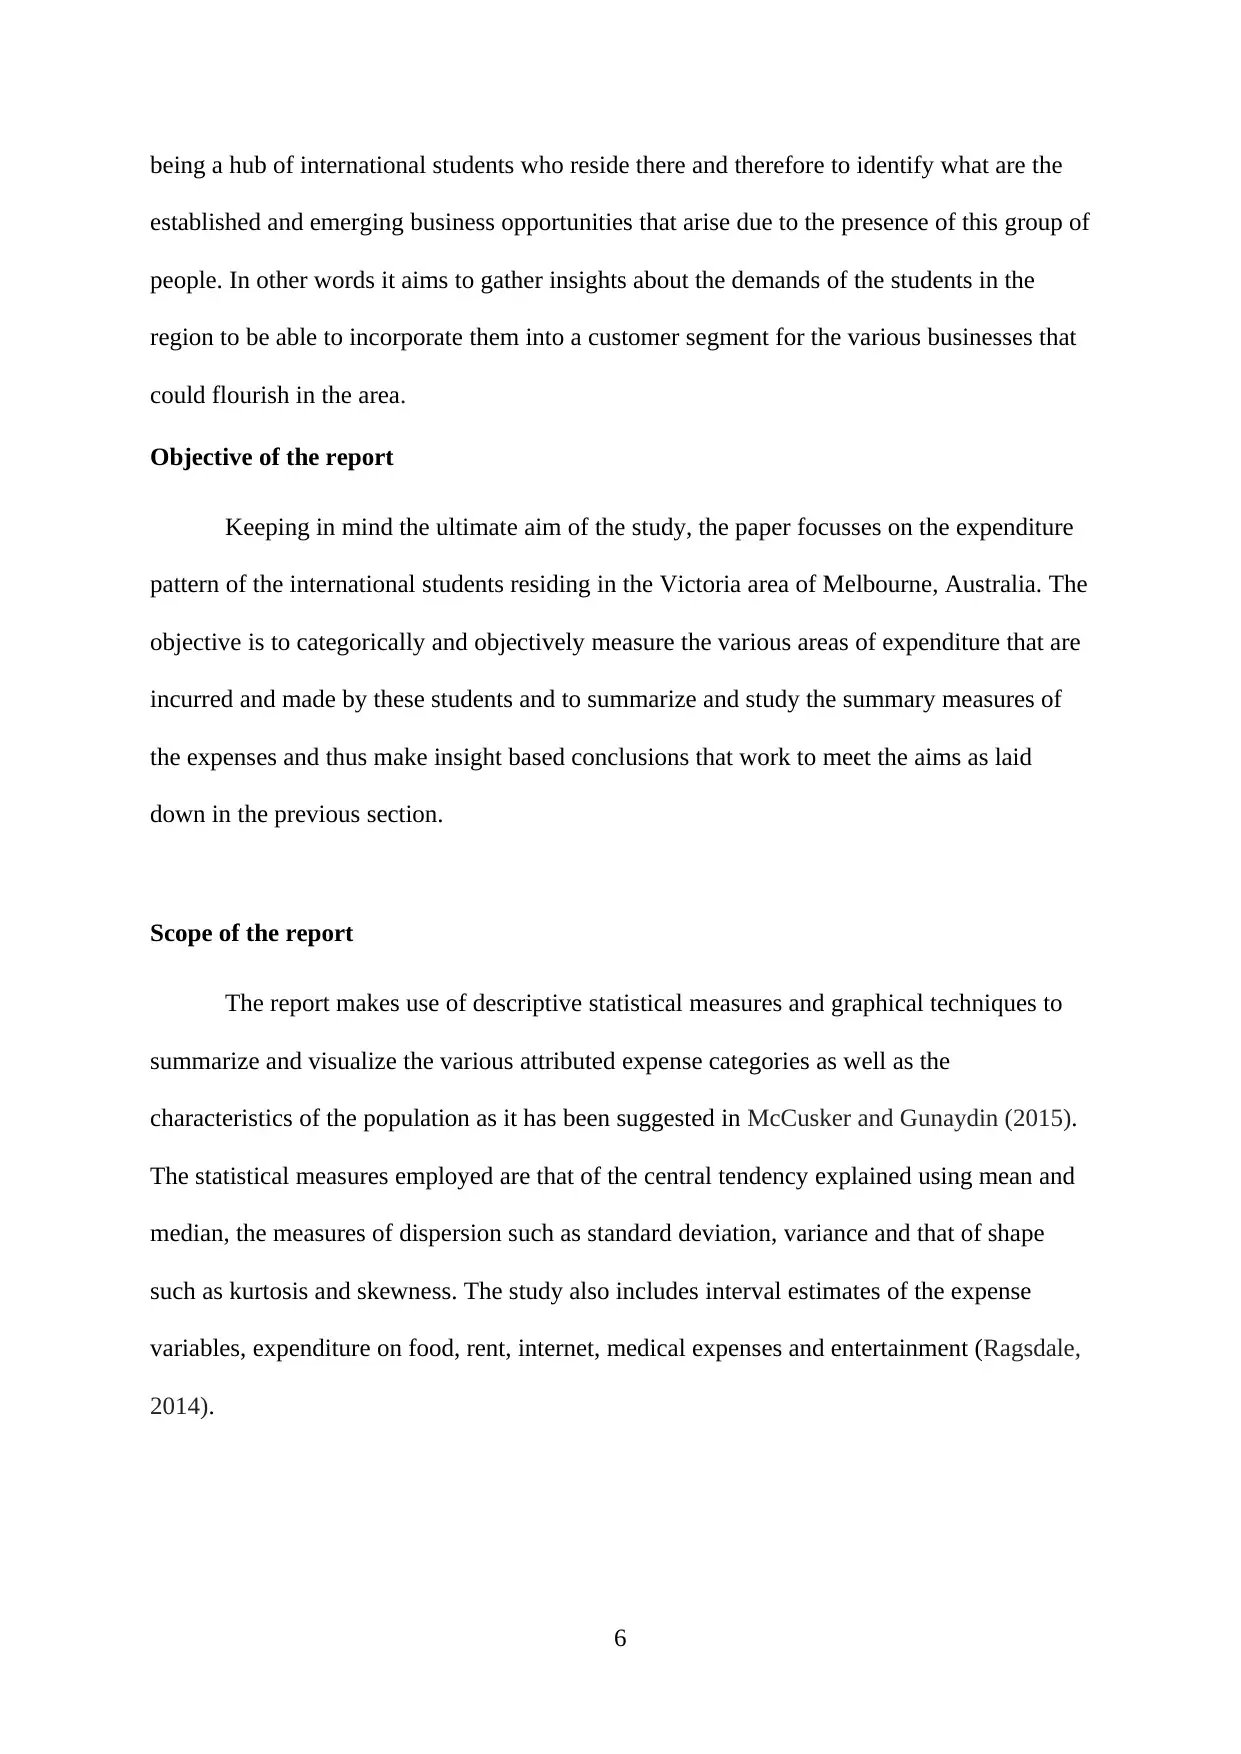
being a hub of international students who reside there and therefore to identify what are the
established and emerging business opportunities that arise due to the presence of this group of
people. In other words it aims to gather insights about the demands of the students in the
region to be able to incorporate them into a customer segment for the various businesses that
could flourish in the area.
Objective of the report
Keeping in mind the ultimate aim of the study, the paper focusses on the expenditure
pattern of the international students residing in the Victoria area of Melbourne, Australia. The
objective is to categorically and objectively measure the various areas of expenditure that are
incurred and made by these students and to summarize and study the summary measures of
the expenses and thus make insight based conclusions that work to meet the aims as laid
down in the previous section.
Scope of the report
The report makes use of descriptive statistical measures and graphical techniques to
summarize and visualize the various attributed expense categories as well as the
characteristics of the population as it has been suggested in McCusker and Gunaydin (2015).
The statistical measures employed are that of the central tendency explained using mean and
median, the measures of dispersion such as standard deviation, variance and that of shape
such as kurtosis and skewness. The study also includes interval estimates of the expense
variables, expenditure on food, rent, internet, medical expenses and entertainment (Ragsdale,
2014).
6
⊘ This is a preview!⊘
Do you want full access?
Subscribe today to unlock all pages.
Trusted by 1+ million students worldwide
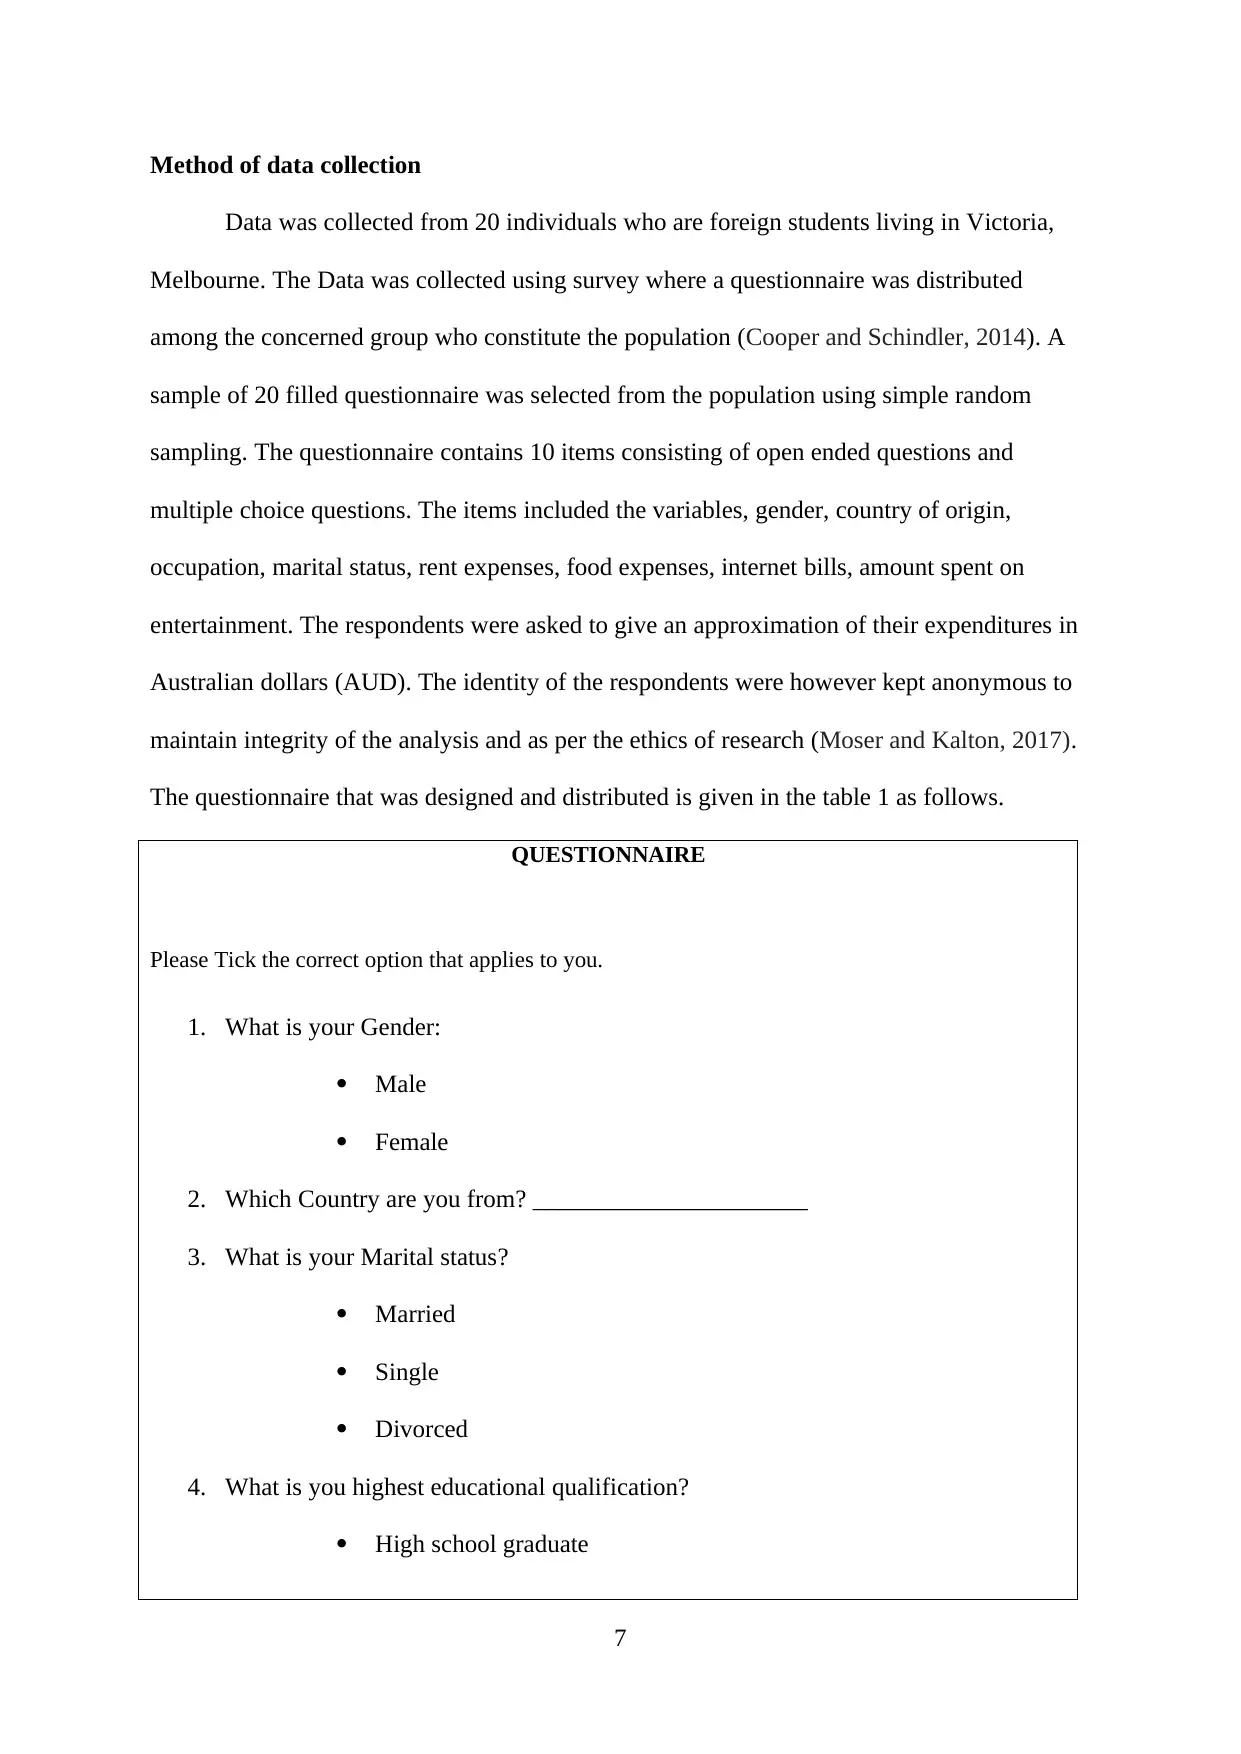
Method of data collection
Data was collected from 20 individuals who are foreign students living in Victoria,
Melbourne. The Data was collected using survey where a questionnaire was distributed
among the concerned group who constitute the population (Cooper and Schindler, 2014). A
sample of 20 filled questionnaire was selected from the population using simple random
sampling. The questionnaire contains 10 items consisting of open ended questions and
multiple choice questions. The items included the variables, gender, country of origin,
occupation, marital status, rent expenses, food expenses, internet bills, amount spent on
entertainment. The respondents were asked to give an approximation of their expenditures in
Australian dollars (AUD). The identity of the respondents were however kept anonymous to
maintain integrity of the analysis and as per the ethics of research (Moser and Kalton, 2017).
The questionnaire that was designed and distributed is given in the table 1 as follows.
QUESTIONNAIRE
Please Tick the correct option that applies to you.
1. What is your Gender:
Male
Female
2. Which Country are you from? ______________________
3. What is your Marital status?
Married
Single
Divorced
4. What is you highest educational qualification?
High school graduate
7
Paraphrase This Document
Need a fresh take? Get an instant paraphrase of this document with our AI Paraphraser
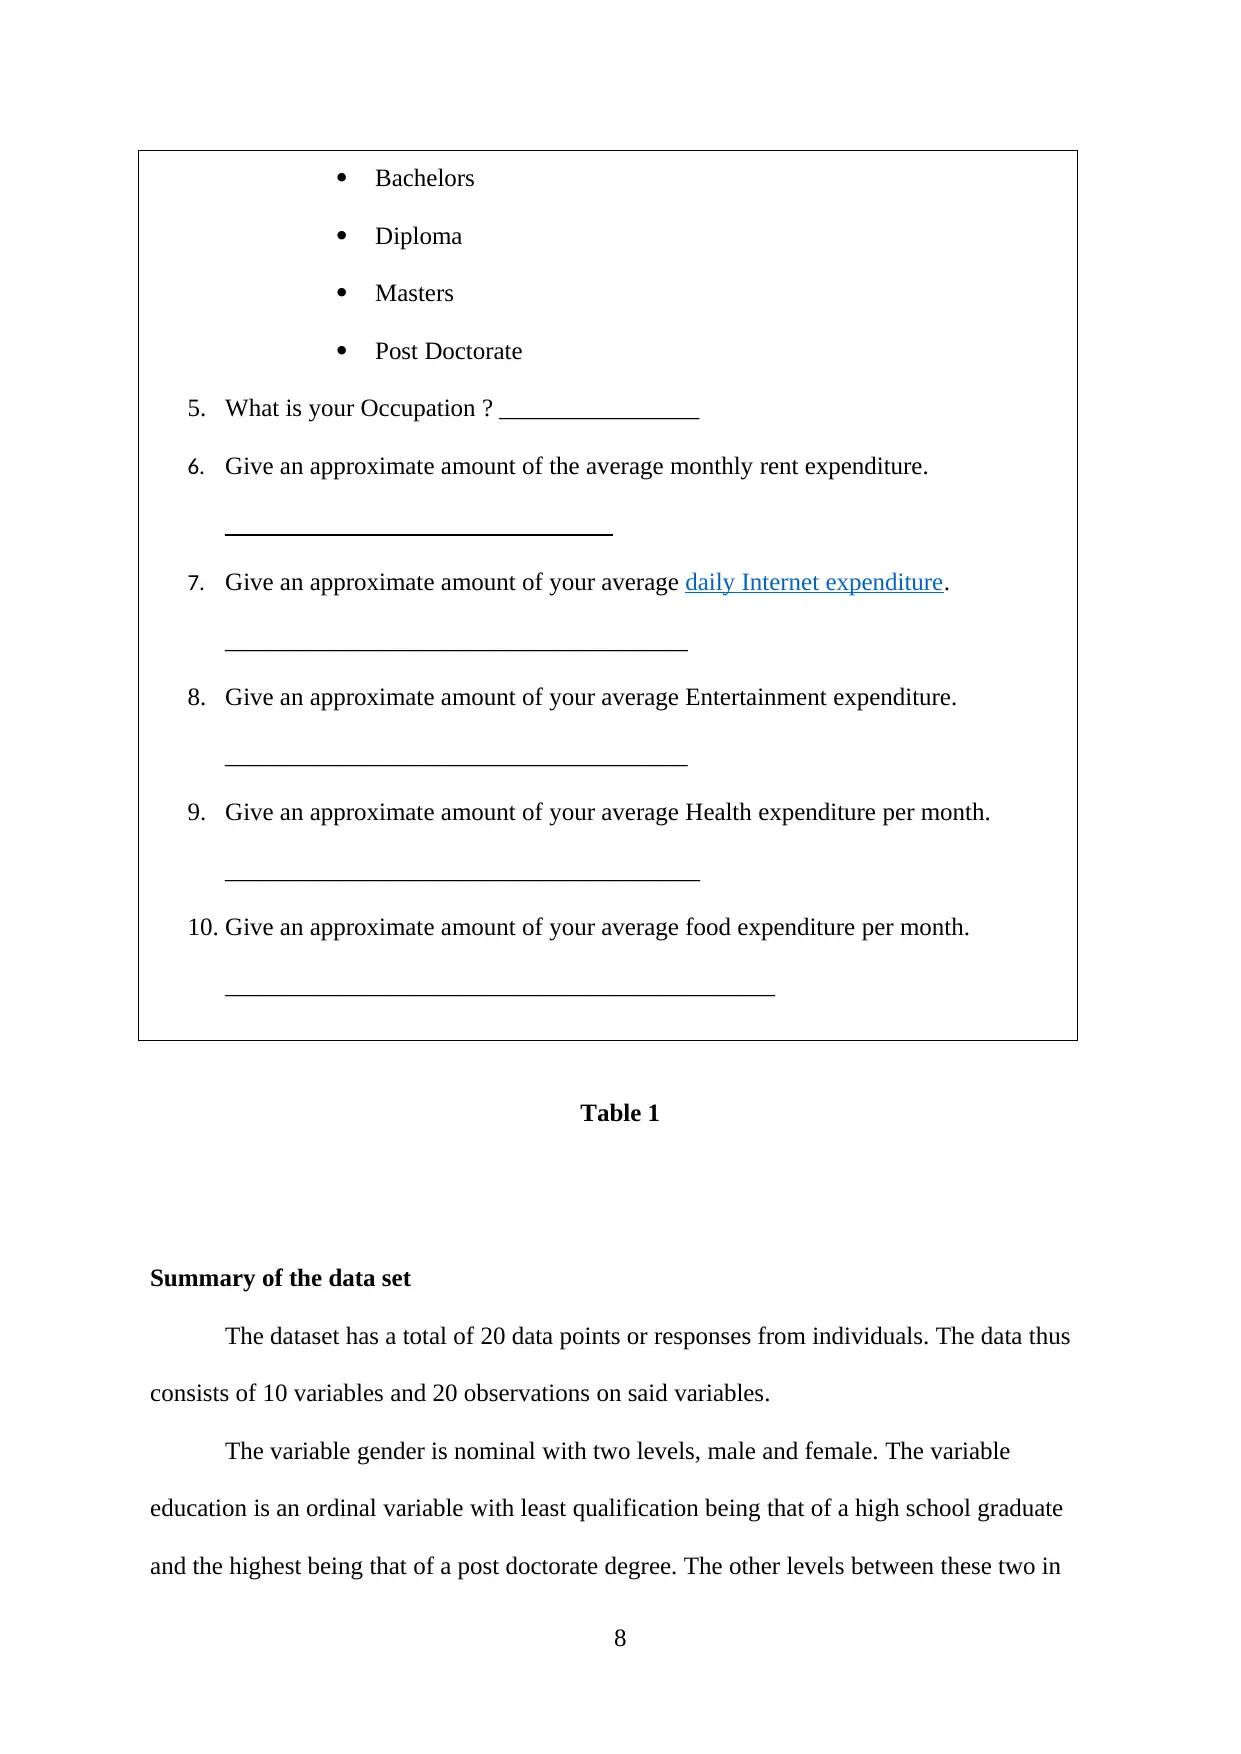
Bachelors
Diploma
Masters
Post Doctorate
5. What is your Occupation ? ________________
6. Give an approximate amount of the average monthly rent expenditure.
_______________________________
7. Give an approximate amount of your average daily Internet expenditure.
_____________________________________
8. Give an approximate amount of your average Entertainment expenditure.
_____________________________________
9. Give an approximate amount of your average Health expenditure per month.
______________________________________
10. Give an approximate amount of your average food expenditure per month.
____________________________________________
Table 1
Summary of the data set
The dataset has a total of 20 data points or responses from individuals. The data thus
consists of 10 variables and 20 observations on said variables.
The variable gender is nominal with two levels, male and female. The variable
education is an ordinal variable with least qualification being that of a high school graduate
and the highest being that of a post doctorate degree. The other levels between these two in
8
increasing order of educational qualification are, diploma graduate, bachelors graduate and
master’s graduate. The variable occupation consists of a number of categories as specified by
the customers with no pre-defined levels. The expenses on food, rent, health care,
entertainment and internet were collected as numerical variables. They are in interval scale
and is measures in terms of Australian dollars or AUD (Rumsey and Unger, 2015).
Gender
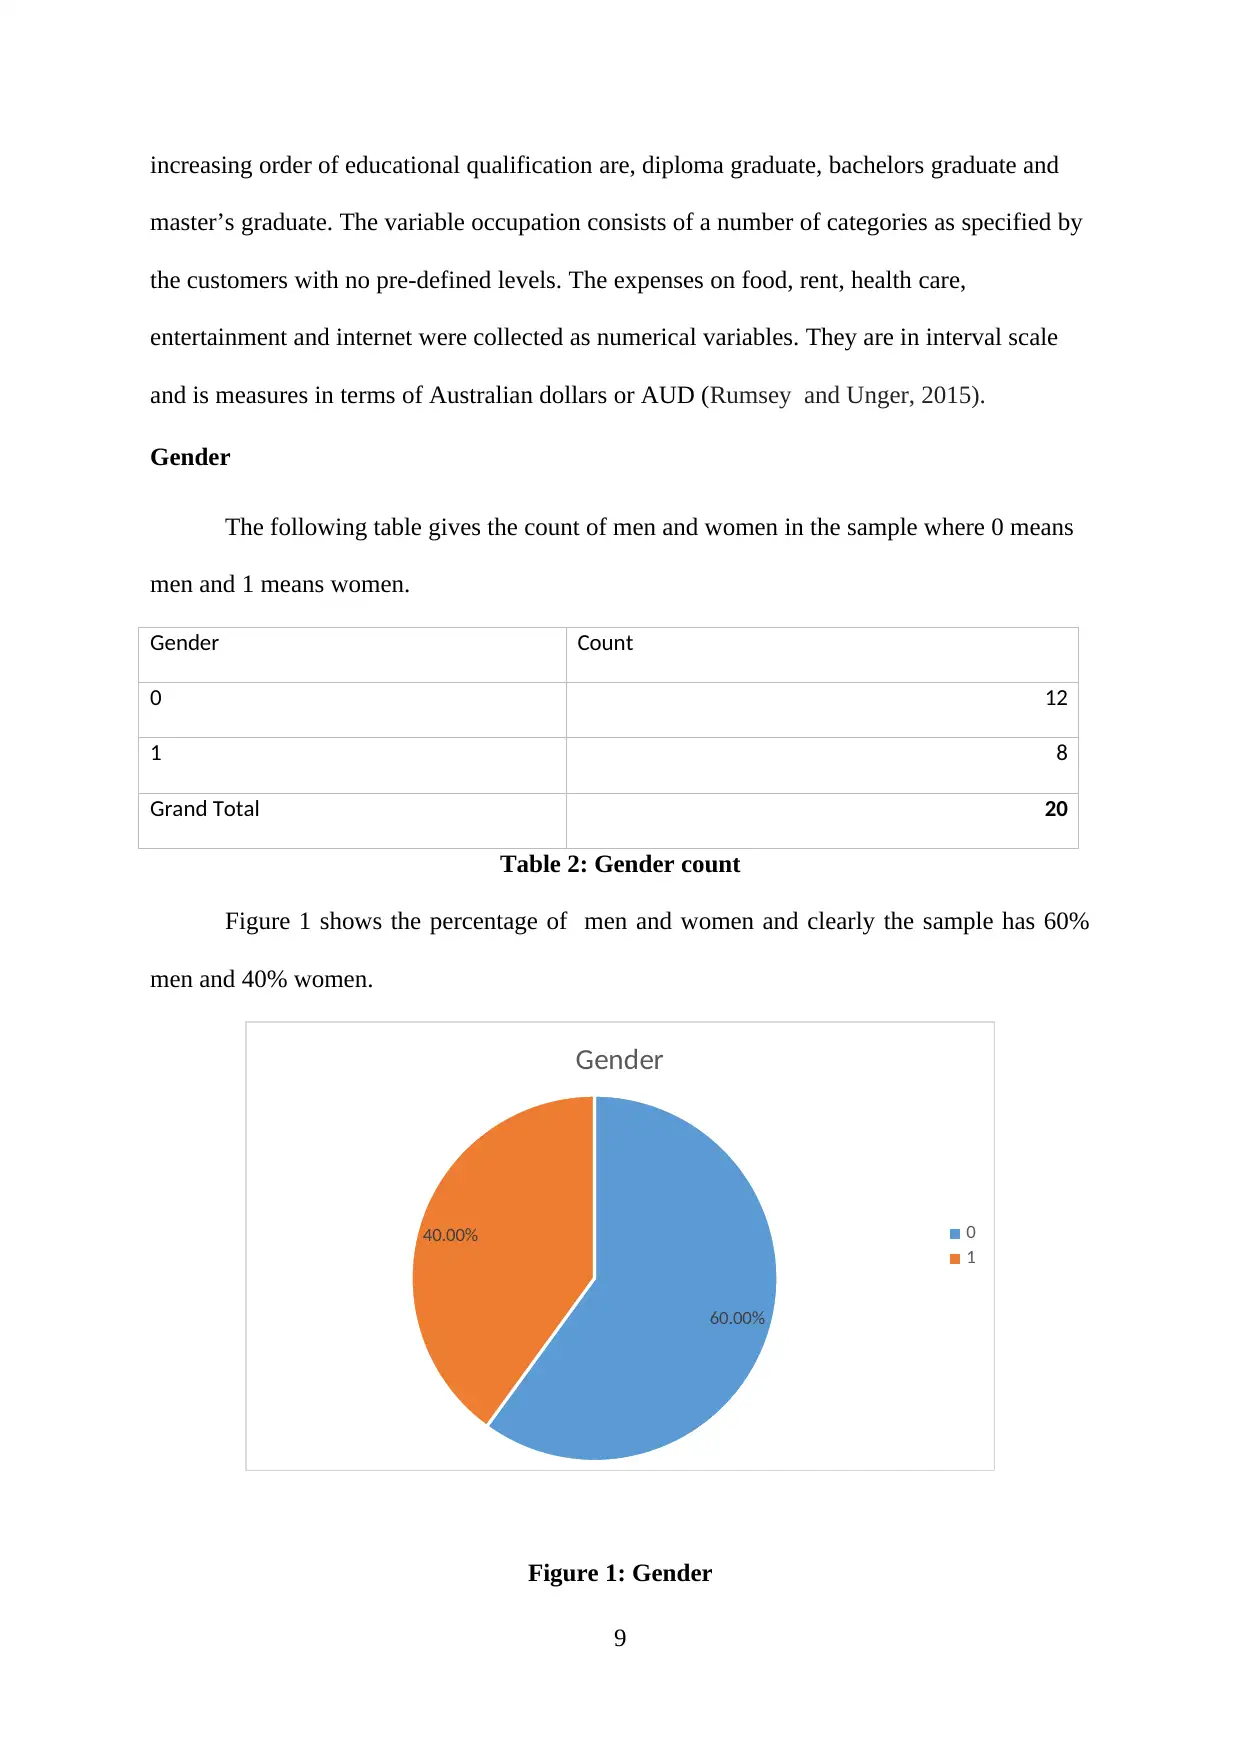
The following table gives the count of men and women in the sample where 0 means
men and 1 means women.
Gender Count
0 12
1 8
Grand Total 20
Table 2: Gender count
Figure 1 shows the percentage of men and women and clearly the sample has 60%
men and 40% women.
60.00%
40.00%
Gender
0
1
Figure 1: Gender
9
master’s graduate. The variable occupation consists of a number of categories as specified by
the customers with no pre-defined levels. The expenses on food, rent, health care,
entertainment and internet were collected as numerical variables. They are in interval scale
and is measures in terms of Australian dollars or AUD (Rumsey and Unger, 2015).
Gender
The following table gives the count of men and women in the sample where 0 means
men and 1 means women.
Gender Count
0 12
1 8
Grand Total 20
Table 2: Gender count
Figure 1 shows the percentage of men and women and clearly the sample has 60%
men and 40% women.
60.00%
40.00%
Gender
0
1
Figure 1: Gender
9
⊘ This is a preview!⊘
Do you want full access?
Subscribe today to unlock all pages.
Trusted by 1+ million students worldwide
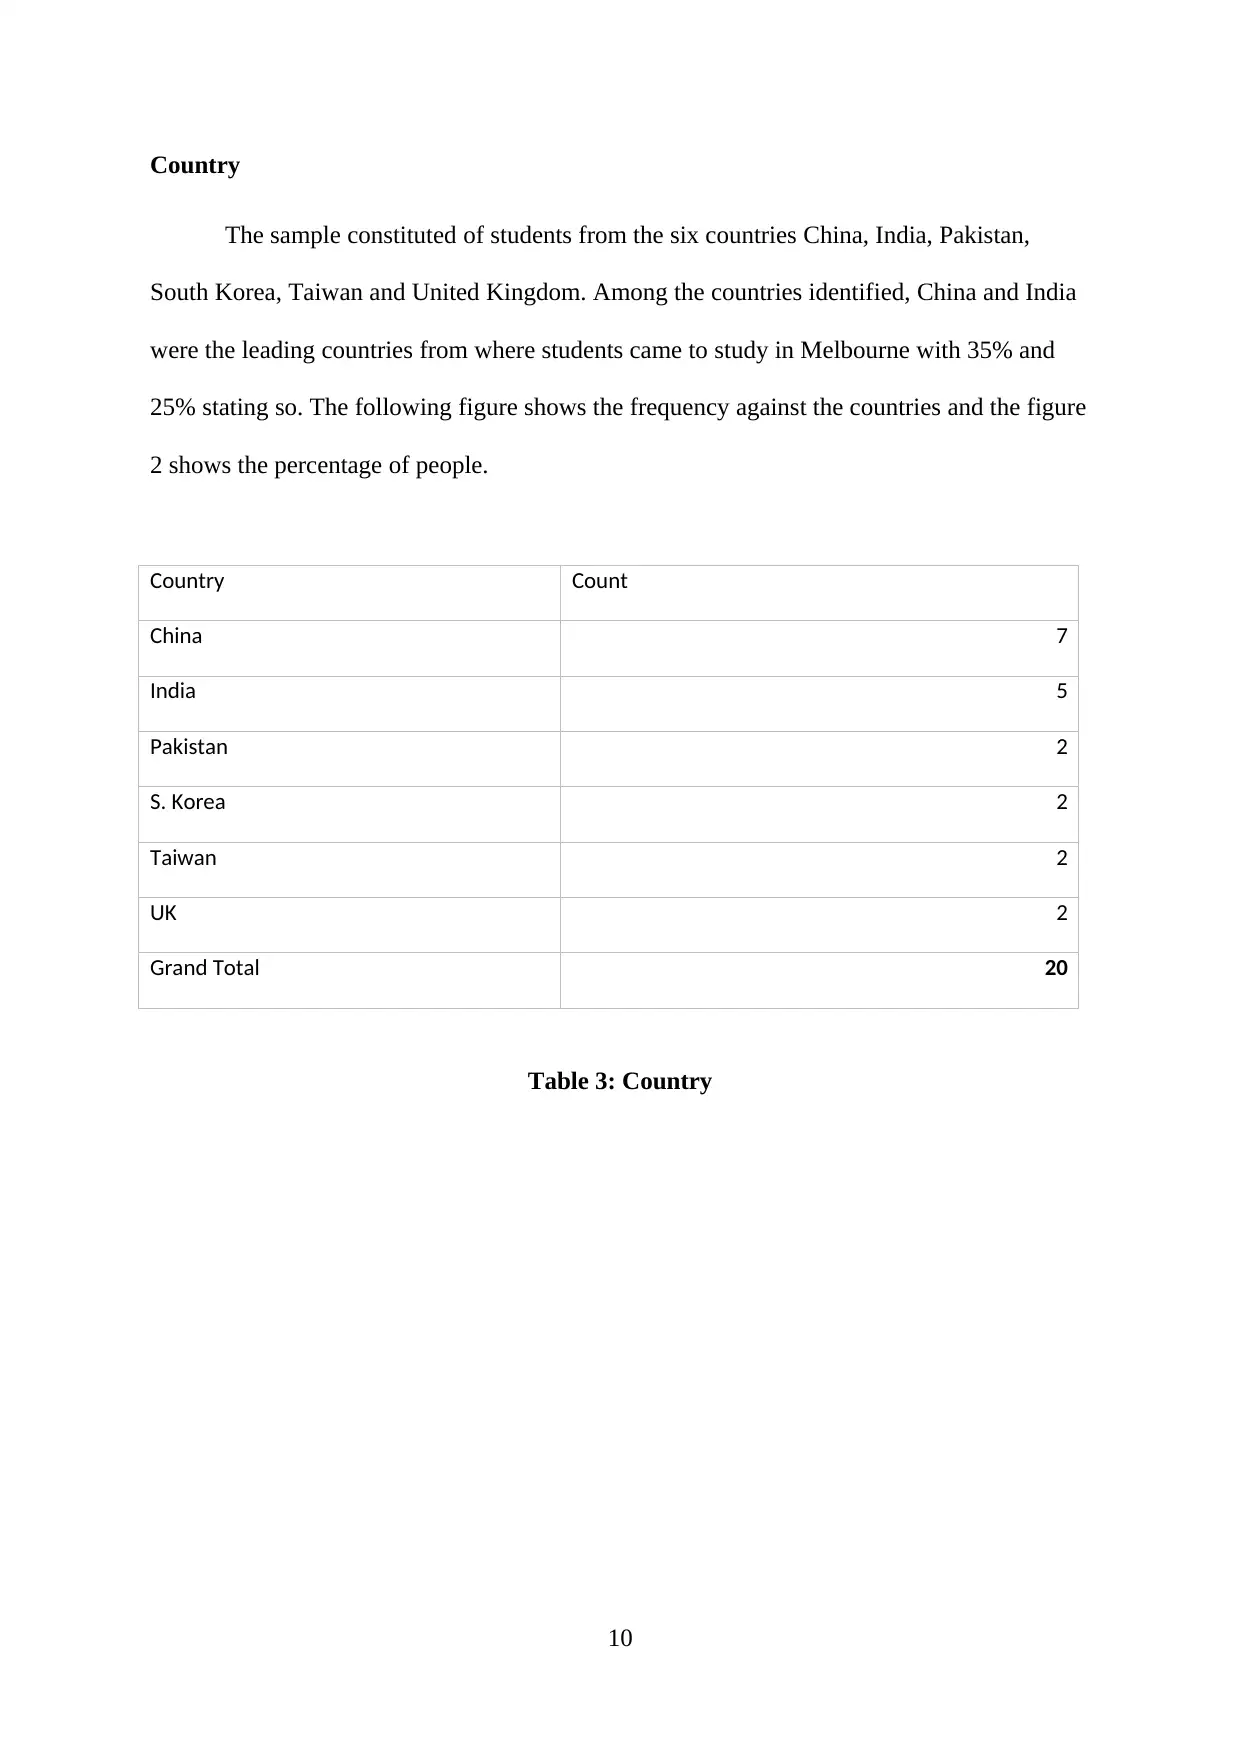
Country
The sample constituted of students from the six countries China, India, Pakistan,
South Korea, Taiwan and United Kingdom. Among the countries identified, China and India
were the leading countries from where students came to study in Melbourne with 35% and
25% stating so. The following figure shows the frequency against the countries and the figure
2 shows the percentage of people.
Country Count
China 7
India 5
Pakistan 2
S. Korea 2
Taiwan 2
UK 2
Grand Total 20
Table 3: Country
10
Paraphrase This Document
Need a fresh take? Get an instant paraphrase of this document with our AI Paraphraser
China India Pakistan S.Korea Taiwan UK
0.00%
5.00%
10.00%
15.00%
20.00%
25.00%
30.00%
35.00%
40.00%
35.00%
25.00%
10.00% 10.00% 10.00% 10.00%
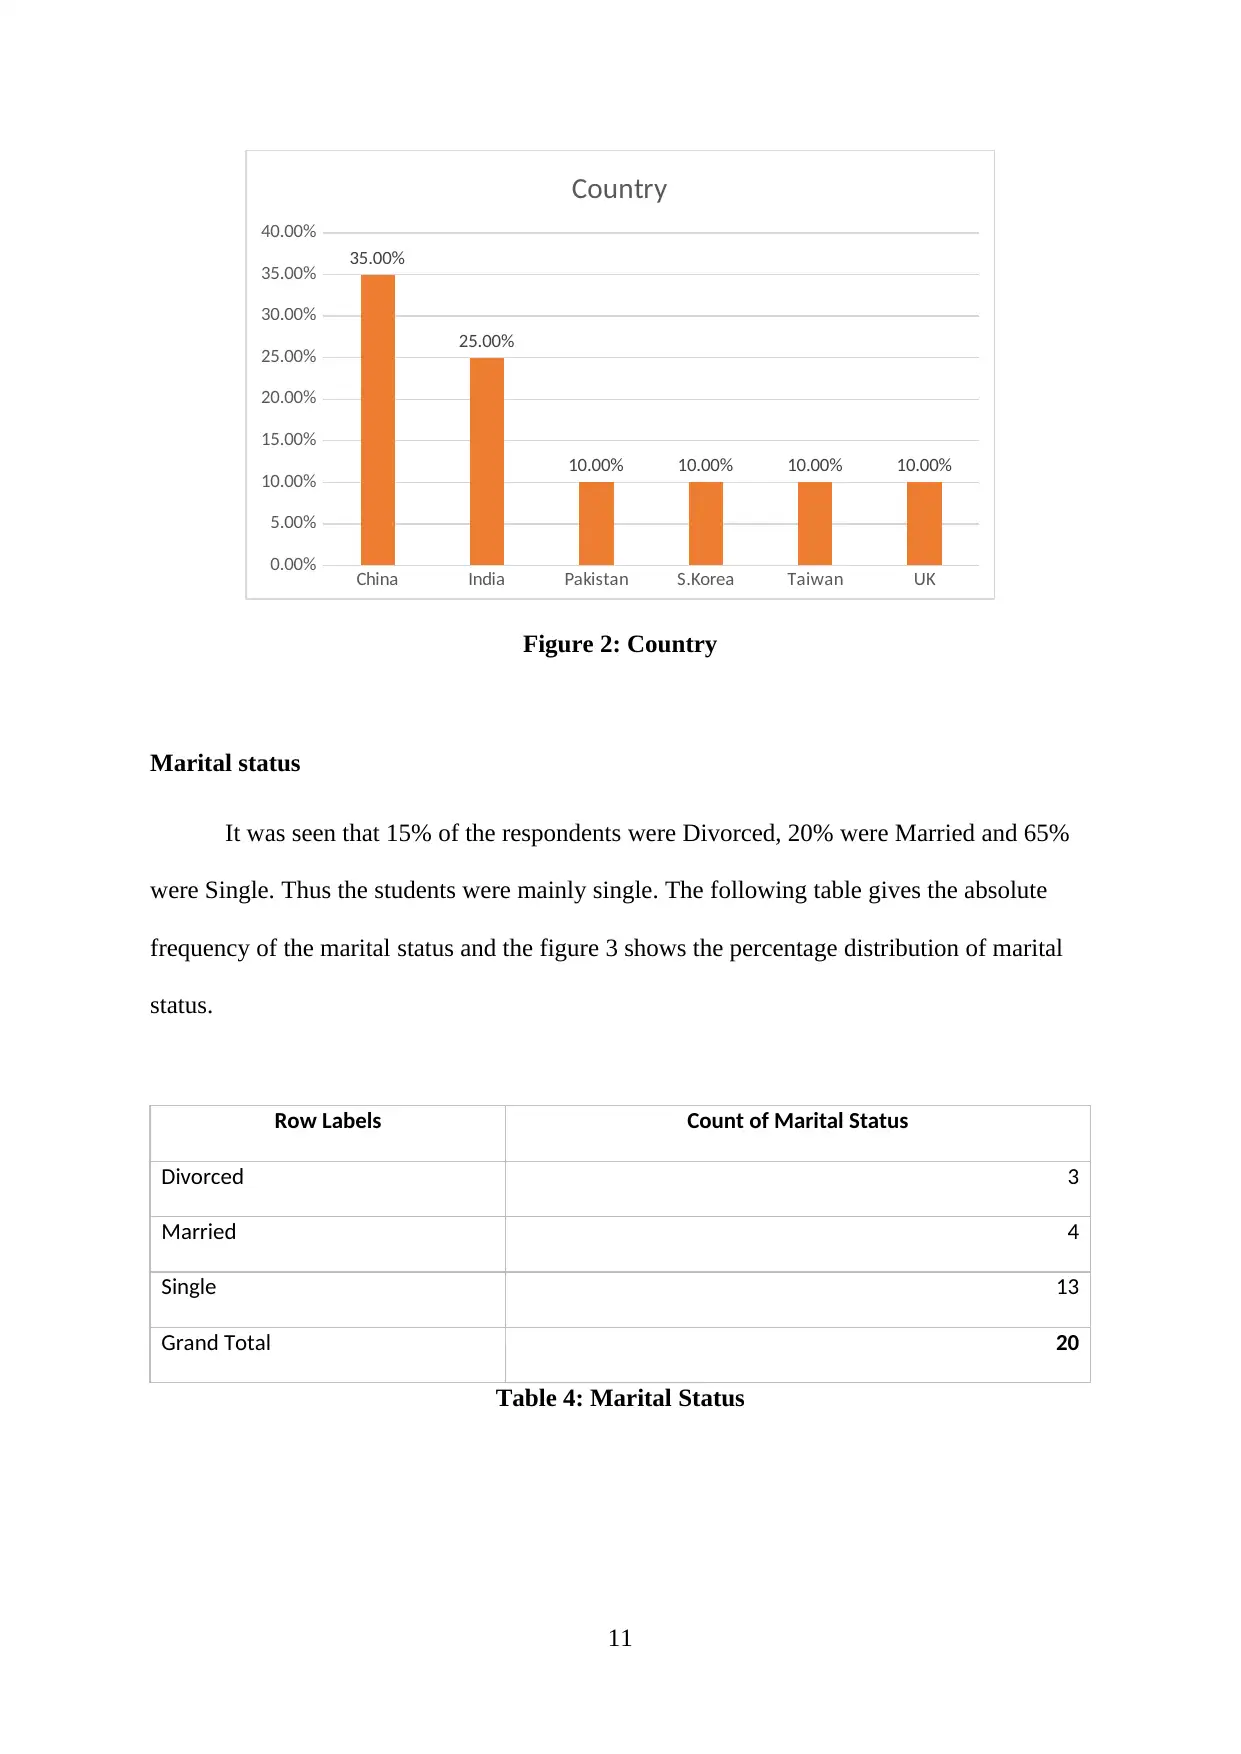
Country
Figure 2: Country
Marital status
It was seen that 15% of the respondents were Divorced, 20% were Married and 65%
were Single. Thus the students were mainly single. The following table gives the absolute
frequency of the marital status and the figure 3 shows the percentage distribution of marital
status.
Row Labels Count of Marital Status
Divorced 3
Married 4
Single 13
Grand Total 20
Table 4: Marital Status
11
0.00%
5.00%
10.00%
15.00%
20.00%
25.00%
30.00%
35.00%
40.00%
35.00%
25.00%
10.00% 10.00% 10.00% 10.00%
Country
Figure 2: Country
Marital status
It was seen that 15% of the respondents were Divorced, 20% were Married and 65%
were Single. Thus the students were mainly single. The following table gives the absolute
frequency of the marital status and the figure 3 shows the percentage distribution of marital
status.
Row Labels Count of Marital Status
Divorced 3
Married 4
Single 13
Grand Total 20
Table 4: Marital Status
11
15.00%
20.00%
65.00%
Marital Status
Divorced
Married
Single
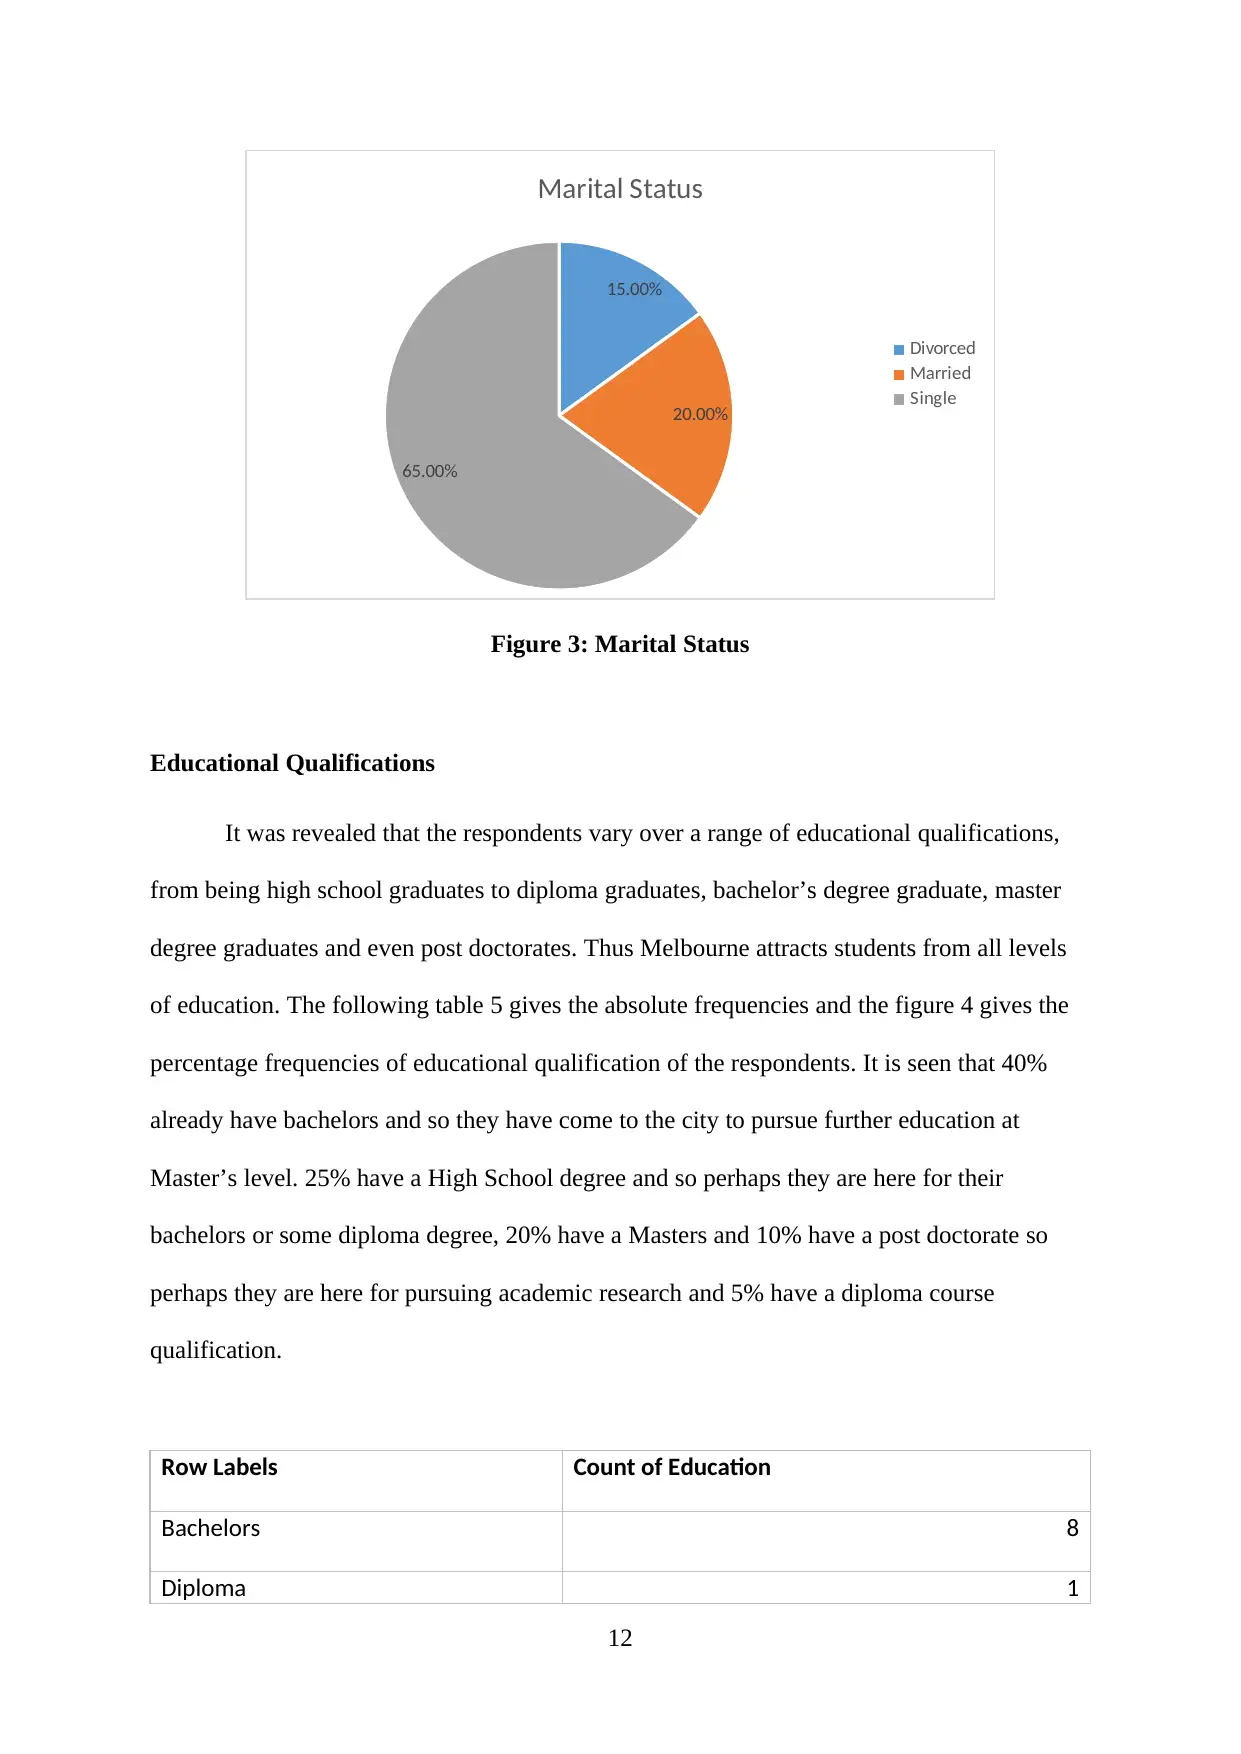
Figure 3: Marital Status
Educational Qualifications
It was revealed that the respondents vary over a range of educational qualifications,
from being high school graduates to diploma graduates, bachelor’s degree graduate, master
degree graduates and even post doctorates. Thus Melbourne attracts students from all levels
of education. The following table 5 gives the absolute frequencies and the figure 4 gives the
percentage frequencies of educational qualification of the respondents. It is seen that 40%
already have bachelors and so they have come to the city to pursue further education at
Master’s level. 25% have a High School degree and so perhaps they are here for their
bachelors or some diploma degree, 20% have a Masters and 10% have a post doctorate so
perhaps they are here for pursuing academic research and 5% have a diploma course
qualification.
Row Labels Count of Education
Bachelors 8
Diploma 1
12
20.00%
65.00%
Marital Status
Divorced
Married
Single
Figure 3: Marital Status
Educational Qualifications
It was revealed that the respondents vary over a range of educational qualifications,
from being high school graduates to diploma graduates, bachelor’s degree graduate, master
degree graduates and even post doctorates. Thus Melbourne attracts students from all levels
of education. The following table 5 gives the absolute frequencies and the figure 4 gives the
percentage frequencies of educational qualification of the respondents. It is seen that 40%
already have bachelors and so they have come to the city to pursue further education at
Master’s level. 25% have a High School degree and so perhaps they are here for their
bachelors or some diploma degree, 20% have a Masters and 10% have a post doctorate so
perhaps they are here for pursuing academic research and 5% have a diploma course
qualification.
Row Labels Count of Education
Bachelors 8
Diploma 1
12
⊘ This is a preview!⊘
Do you want full access?
Subscribe today to unlock all pages.
Trusted by 1+ million students worldwide
1 out of 27
Related Documents


Your All-in-One AI-Powered Toolkit for Academic Success.
+13062052269
info@desklib.com
Available 24*7 on WhatsApp / Email
![[object Object]](/_next/static/media/star-bottom.7253800d.svg)
Unlock your academic potential
Copyright © 2020–2026 A2Z Services. All Rights Reserved. Developed and managed by ZUCOL.