Exploring QPSK Modulation for Enhanced Data Transmission Efficiency
VerifiedAdded on 2020/04/01
|9
|1899
|192
AI Summary
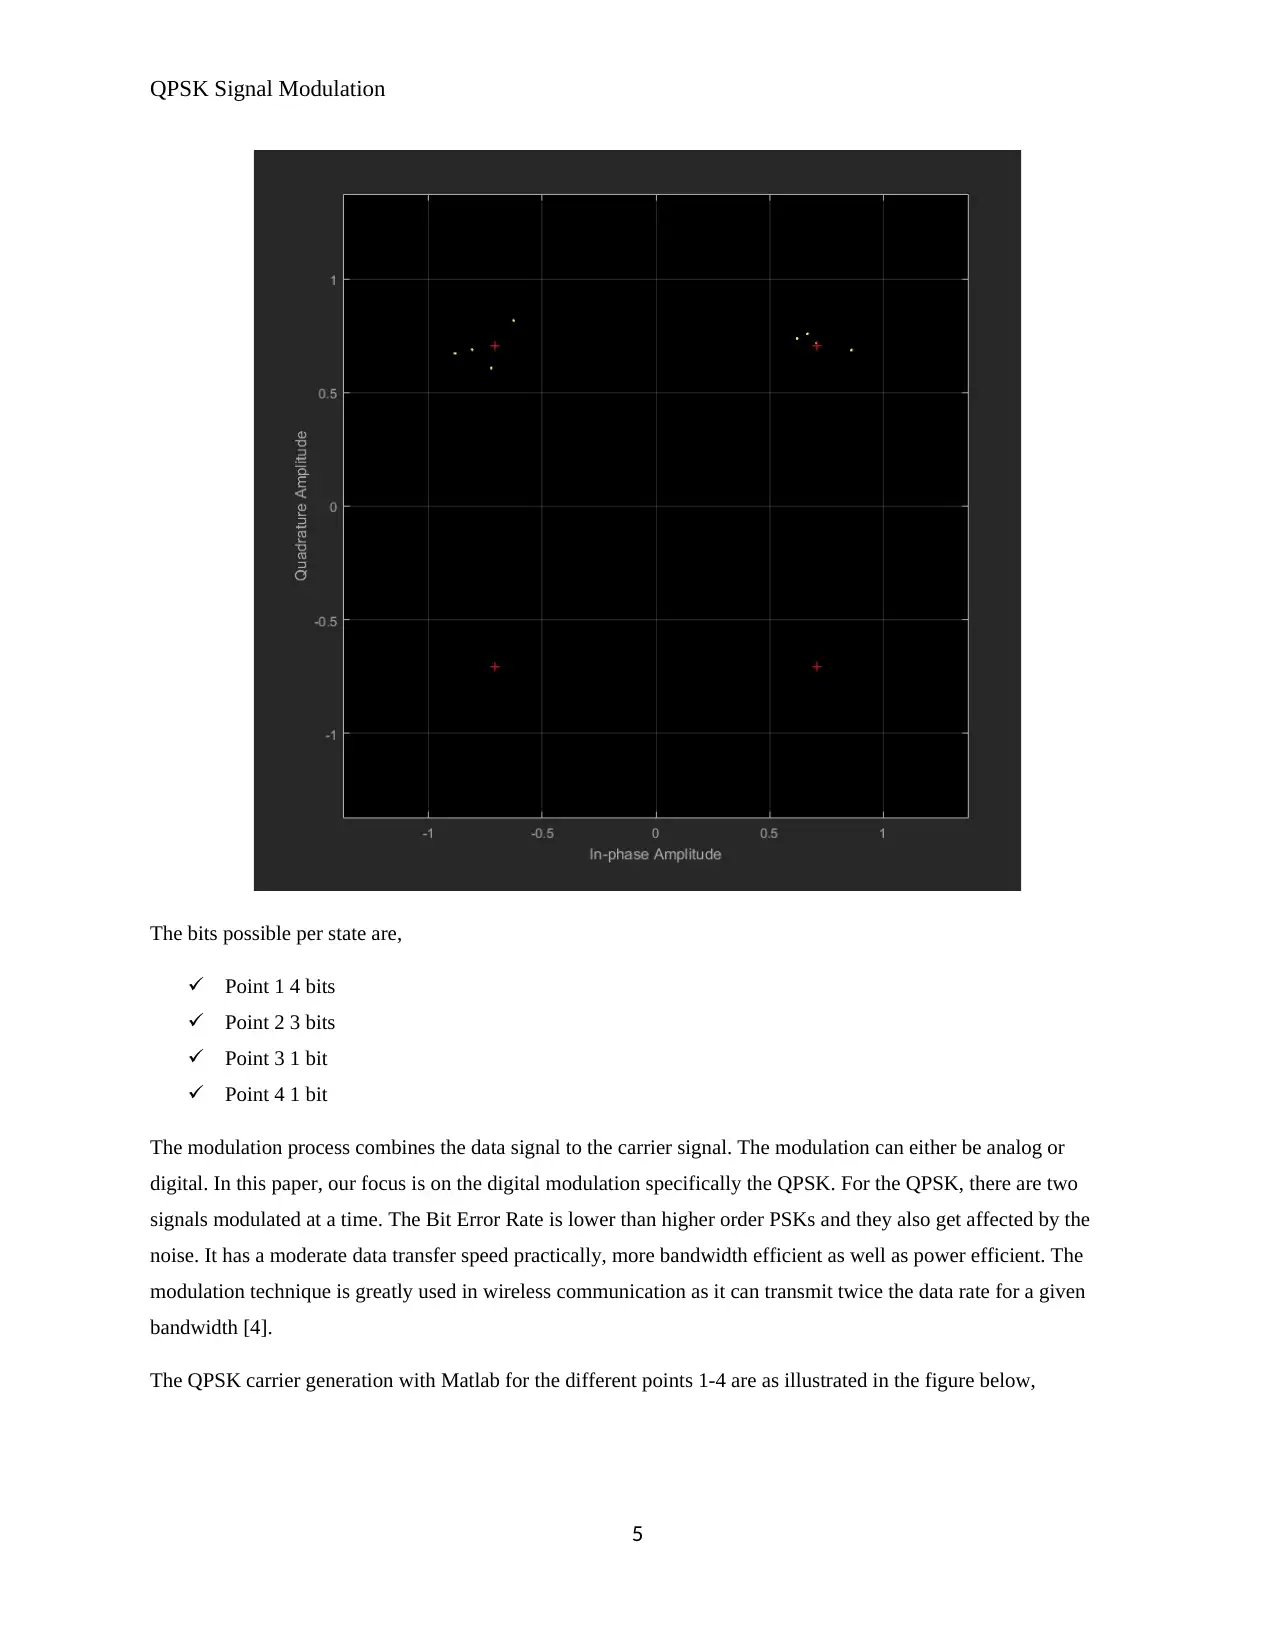
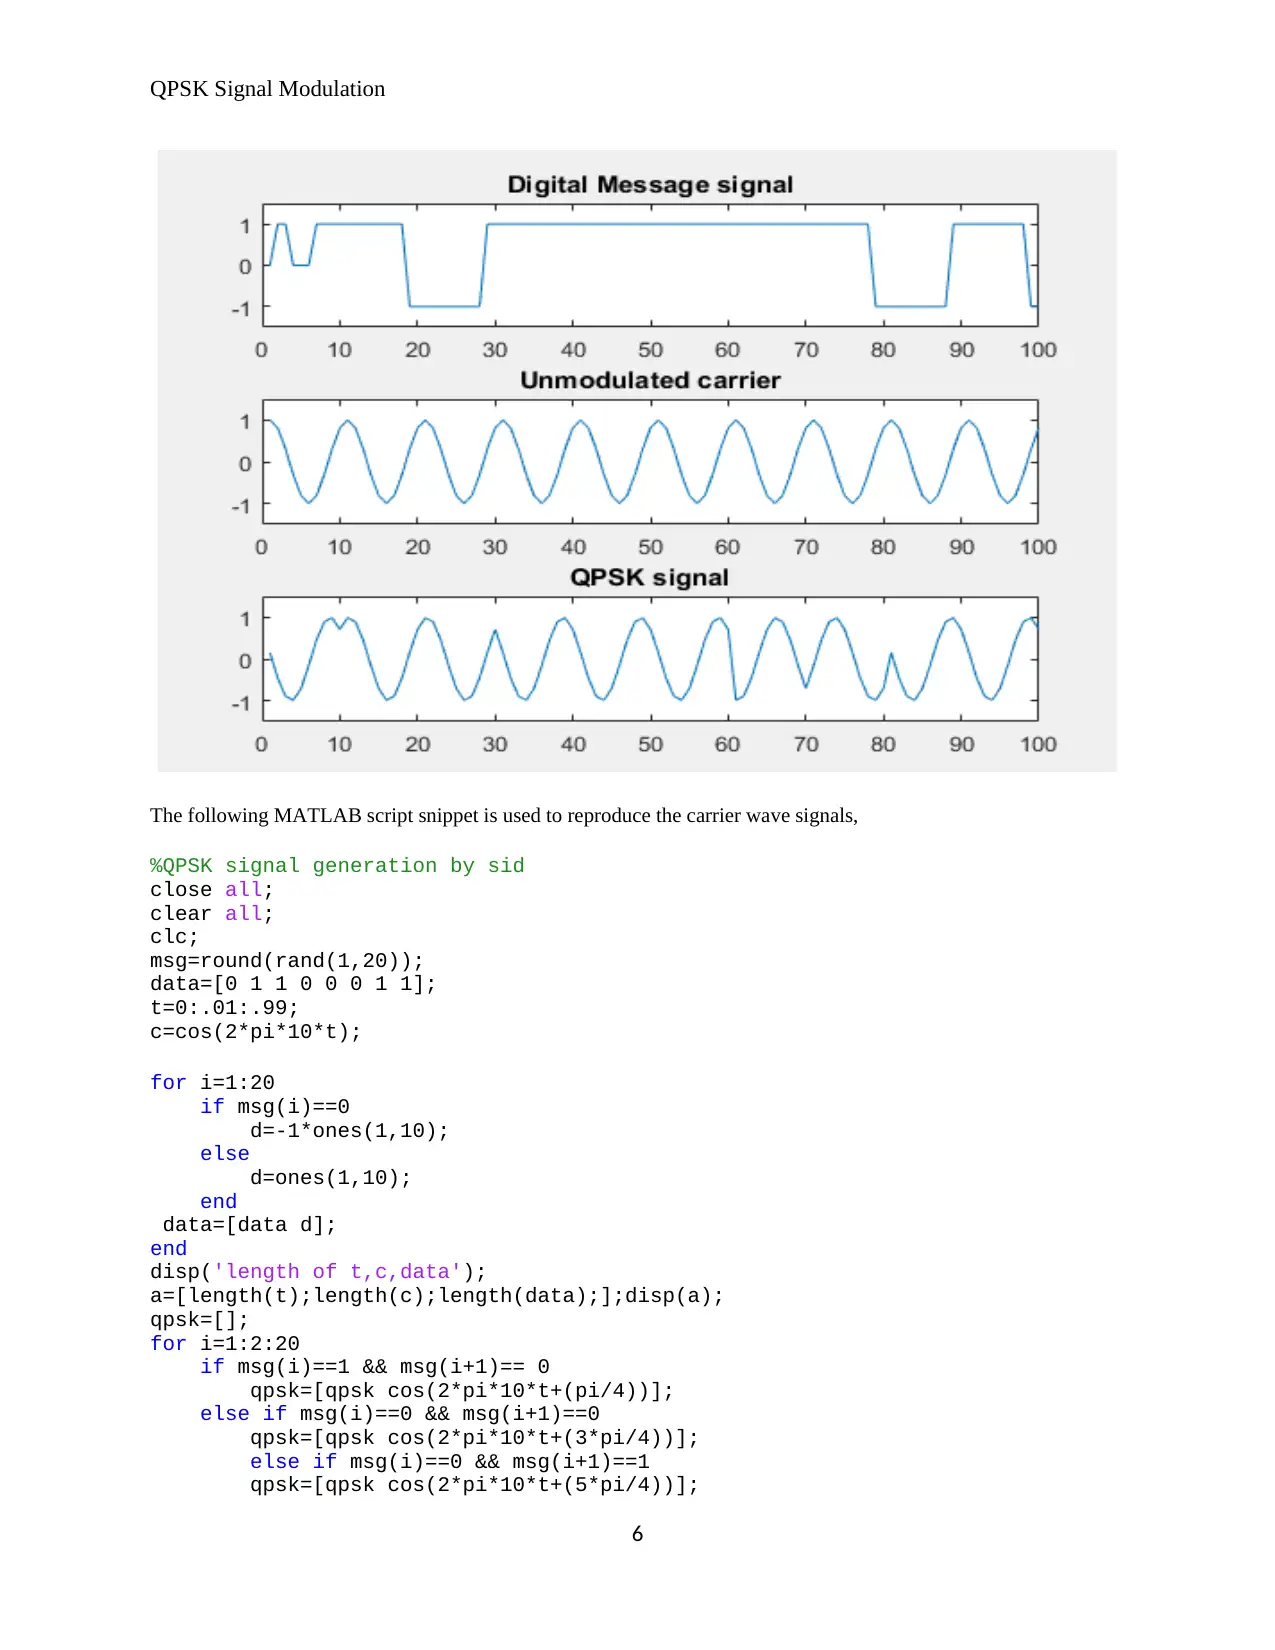
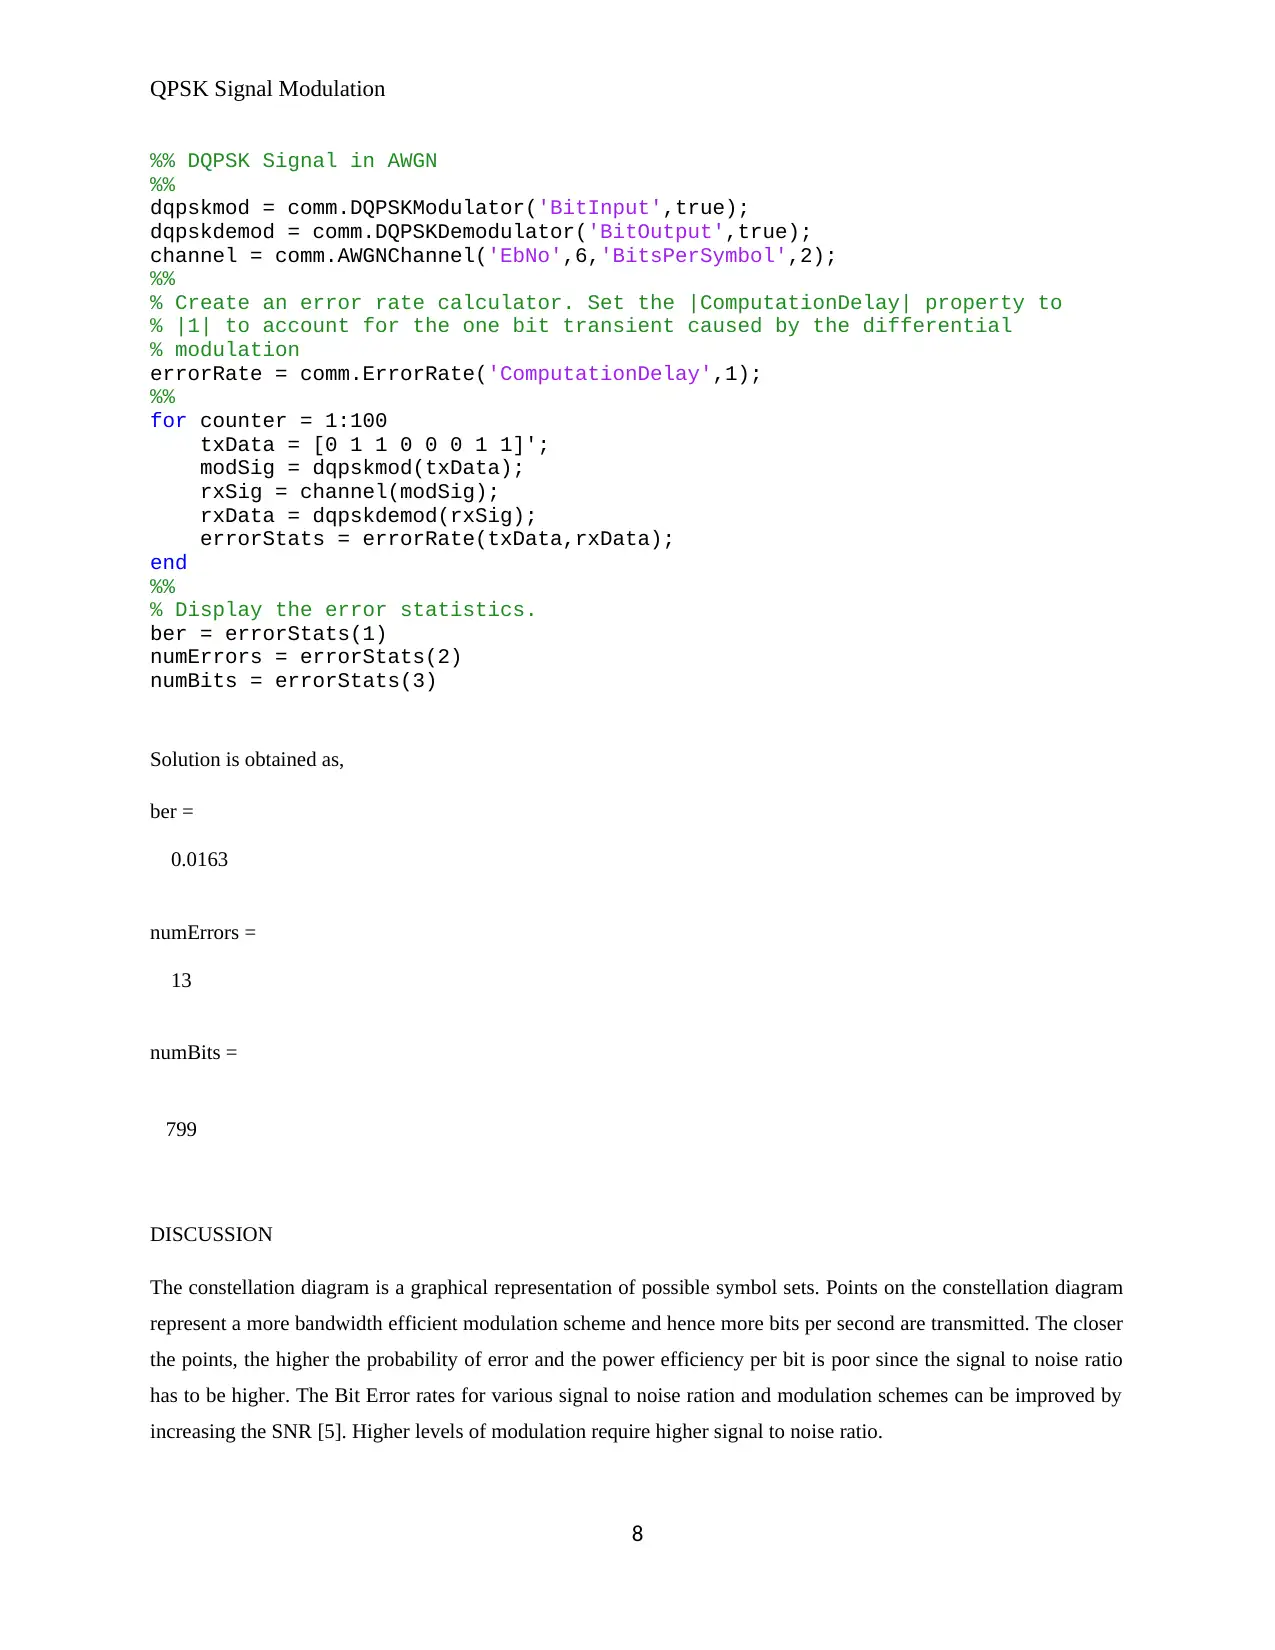
The report presents an in-depth analysis of QPSK modulation using MATLAB. It examines the constellation diagram to understand symbol representation and bandwidth efficiency. The study evaluates bit error rates (BER) under various signal-to-noise ratios (SNR), demonstrating how higher SNRs improve BER for different modulation schemes. The MATLAB simulation includes generating and demodulating signals in an Additive White Gaussian Noise (AWGN) channel, providing insights into practical communication system performance. Key findings highlight the trade-offs between bandwidth efficiency and error probability, emphasizing the need for optimal SNR levels to achieve reliable data transmission.
Contribute Materials
Your contribution can guide someone’s learning journey. Share your
documents today.

QPSK Signal Modulation
MELBOURNE INSTITUTE OF TECHNOLOGY
SCHOOL OF INFORMATION TECHNOLOGY & ENGINEERING
UNIT CODE: BE302
UNIT TITLE: Mobile & Satellite Communication Systems
ASSIGNMENT 2
QPSK SIGNAL MODULATION
1
MELBOURNE INSTITUTE OF TECHNOLOGY
SCHOOL OF INFORMATION TECHNOLOGY & ENGINEERING
UNIT CODE: BE302
UNIT TITLE: Mobile & Satellite Communication Systems
ASSIGNMENT 2
QPSK SIGNAL MODULATION
1
Secure Best Marks with AI Grader
Need help grading? Try our AI Grader for instant feedback on your assignments.

QPSK Signal Modulation
INTRODUCTION
In mobile and satellite communication, the message signals are transmitted from the sender point to the receiver
point. The message signal needs to be transmitted via a channel and it must be encoded using a given technique for
it to be transmitted. The process of encoding the message input from a low frequency signal to a higher one is
referred to as modulation. The modulating signal is said to have a lower frequency than that in the channel or its
carrier. The frequency of the carrier is the center of the radio channel [1]. The reverse occurs at the receiver point
where the low frequency signal is extracted from the band pass signal that represents the carrier. The modulation
techniques can either be analog or digital. The analog modulation uses the modulating signal to continuously vary
the carrier by varying the amplitude, frequency, or phase. All these parameters are key in a signal and they are
varied to obtain different outputs. In the amplitude modulation, the modulated signal tends to be affected by a lot of
variations in the received power. In frequency modulation, the amplitude as well as the transmitted power is held
constant. The signal in this case, is less affected by noise as the information is not in the amplitude of the signal. The
bandwidth can be traded for better signal to noise ratio. The non-linear amplifiers that are more power efficient can
be used. In the phase modulation, only the phase changes, all other parameters are held constant [2].
The digital modulation, on the other hand, uses representation of symbols as groups of bits of information. The
symbols can have m states and be represented by n number of bits. For instance, the ANSI or UTS-8 codes are
represented in the digital modulation communication techniques. Some of the variants of the digital modulation are
AFK, FSK, PSK, BPSK, QPSK, and QAM. In digital communication, an analog continuous-time signal is sampled.
The sampling points should be sufficiently close to follow the signal curve. The sampling is set to about twice the
supply frequency based on the Nyquist rate. Only the discrete points can be quantized or rounded to the nearest pre-
determined value, encoded and transmitted to save power. The illustration below shows the entire communication
block of the digital modulation communication,
2

QPSK Signal Modulation
The symbol rate is defined in bauds per second. Other features are estimated in the digital modulation. The bit error
rate is the noise in the channel that can result in errors in received signal. The bit error rate is a likelihood of a bit
received incorrectly. The acceptable BER is usually 1 in 100000, that is, 10-5. The amplitude Shift keying (ASK)
alters the amplitude as on or off. The frequency Shift keying (FSK) alters the frequency of the signal to represent on
or off states. The minimum shift keying means to have the minimum possible change in frequency. The carrier
phase is switched between various discrete and equal spaced values. Amplitude and frequency of the signal are the
same. Of concern to us is the Quadri-phase Shift Keying (QPSK) where the phases of the signals differ by 900. The
bandwidth efficiency is 2 bit per second per Hz. 900 phase shift is introduced between two BPSK switches.
Two data streams are transmitted simultaneously such that there is an in-phase data stream named I and the
quadrature data stream named Q. These two inputs are such that the Q is phase shifted by 900 compared to I. each
QPSK symbol contains 2 bits of data. The modulated output can be represented in complex form [3].
The system follows the signal orthogonality concept where cosine and sine are orthogonal basic signals. Consider
the M possible signals that represent the set,
Each signal, therefore, consists of a set of basic signals,
3

QPSK Signal Modulation
Orthogonality means that if we multiply basic signals by itself, the result is 1, otherwise the result is 0.
METHOD
Step 1: Describe the QPSK constellation diagram; use the diagram to calculate the number of bits per state or point
on the constellation diagram that can be assigned.
Step 2: The In-phase and quadrature carrier wave components for each point on the constellation diagram. To
determine the amplitudes of the In-phase and Quadrature components for carrier waves in sin or cos form
Step 3: Demonstrating the In-phase and Quadrature components addition for each state.
Step 4: Encode the data
Step 5: Plot the modulated carrier wave corresponding to the given data sequence using the MATLAB script.
RESULTS
The data sequence to encode is d = [0 1 1 0 0 0 1 1]
QPSK constellation diagram
In-phase and quadrature components
%% Constellation Diagram of QPSK Signal
%%
% Create a constellation diagram System object.
cd = comm.ConstellationDiagram;
%%
% Generate random symbols, apply QPSK modulation, and pass the modulated
% signal through a noisy channel.
d = [0 1 1 0 0 0 1 1]';
x = pskmod(d,4,pi/4);
y = awgn(x,20);
%%
% Plot the constellation diagram by using the |step| method.
step(cd,y)
4
Secure Best Marks with AI Grader
Need help grading? Try our AI Grader for instant feedback on your assignments.

QPSK Signal Modulation
The bits possible per state are,
Point 1 4 bits
Point 2 3 bits
Point 3 1 bit
Point 4 1 bit
The modulation process combines the data signal to the carrier signal. The modulation can either be analog or
digital. In this paper, our focus is on the digital modulation specifically the QPSK. For the QPSK, there are two
signals modulated at a time. The Bit Error Rate is lower than higher order PSKs and they also get affected by the
noise. It has a moderate data transfer speed practically, more bandwidth efficient as well as power efficient. The
modulation technique is greatly used in wireless communication as it can transmit twice the data rate for a given
bandwidth [4].
The QPSK carrier generation with Matlab for the different points 1-4 are as illustrated in the figure below,
5

QPSK Signal Modulation
The following MATLAB script snippet is used to reproduce the carrier wave signals,
%QPSK signal generation by sid
close all;
clear all;
clc;
msg=round(rand(1,20));
data=[0 1 1 0 0 0 1 1];
t=0:.01:.99;
c=cos(2*pi*10*t);
for i=1:20
if msg(i)==0
d=-1*ones(1,10);
else
d=ones(1,10);
end
data=[data d];
end
disp('length of t,c,data');
a=[length(t);length(c);length(data);];disp(a);
qpsk=[];
for i=1:2:20
if msg(i)==1 && msg(i+1)== 0
qpsk=[qpsk cos(2*pi*10*t+(pi/4))];
else if msg(i)==0 && msg(i+1)==0
qpsk=[qpsk cos(2*pi*10*t+(3*pi/4))];
else if msg(i)==0 && msg(i+1)==1
qpsk=[qpsk cos(2*pi*10*t+(5*pi/4))];
6

QPSK Signal Modulation
else if msg(i)==1 && msg(i+1)==1
qpsk=[qpsk cos(2*pi*10*t+(7*pi/4))];
end
end
end
end
end
%plot(qpsk);
modsig=[];
for i=1:100:1000
for j=1:10
p=qpsk(i+j);
modsig=[modsig p];
end
end
subplot(311);
plot(data);axis([0 100 -1.5 1.5])
title('Digital Message signal');
subplot(313);
plot(modsig);axis([0 100 -1.5 1.5])
title('QPSK signal');
subplot(312)
plot(c);axis([0 100 -1.5 1.5])
title('Unmodulated carrier');
The table below shows the carrier wave signals for state 1 through to state 4.
DATA ENCODING
CARRIER WAVE FOR MODULATED DATA PLOT
7
Paraphrase This Document
Need a fresh take? Get an instant paraphrase of this document with our AI Paraphraser

QPSK Signal Modulation
%% DQPSK Signal in AWGN
%%
dqpskmod = comm.DQPSKModulator('BitInput',true);
dqpskdemod = comm.DQPSKDemodulator('BitOutput',true);
channel = comm.AWGNChannel('EbNo',6,'BitsPerSymbol',2);
%%
% Create an error rate calculator. Set the |ComputationDelay| property to
% |1| to account for the one bit transient caused by the differential
% modulation
errorRate = comm.ErrorRate('ComputationDelay',1);
%%
for counter = 1:100
txData = [0 1 1 0 0 0 1 1]';
modSig = dqpskmod(txData);
rxSig = channel(modSig);
rxData = dqpskdemod(rxSig);
errorStats = errorRate(txData,rxData);
end
%%
% Display the error statistics.
ber = errorStats(1)
numErrors = errorStats(2)
numBits = errorStats(3)
Solution is obtained as,
ber =
0.0163
numErrors =
13
numBits =
799
DISCUSSION
The constellation diagram is a graphical representation of possible symbol sets. Points on the constellation diagram
represent a more bandwidth efficient modulation scheme and hence more bits per second are transmitted. The closer
the points, the higher the probability of error and the power efficiency per bit is poor since the signal to noise ratio
has to be higher. The Bit Error rates for various signal to noise ration and modulation schemes can be improved by
increasing the SNR [5]. Higher levels of modulation require higher signal to noise ratio.
8

QPSK Signal Modulation
REFERENCES
[1] T. S. Rappaport, Wireless Communications, Prentice Hall PTR, 2002.
[2] K. Chang, RF and Microwave Wireless Systems, J. Wiley & Sons, 2000.
[3] M. Sellers and D. Kostas, "Comparison of QPSK/QAM OFDM & Spread Spectrum for 2-11 Ghz PMP BWAS,"
IEEE, 2000.
[4] P. Mishra and S. Mane, "Implementation of QPSK Modulation on MATLAB Simulation," International
Journal of Engineering and Innovative Technology (IJEIT), vol. 5, no. 8, pp. 20-23, 2016.
[5] D. C. C. Tsimenidis, EEE807 Simulation of Wireless Communications, NewCastle University, 2013.
9
1 out of 9
Related Documents

Your All-in-One AI-Powered Toolkit for Academic Success.
+13062052269
info@desklib.com
Available 24*7 on WhatsApp / Email
Unlock your academic potential
© 2024 | Zucol Services PVT LTD | All rights reserved.