MAP4C - Grade 12 Math: Lesson 13 Assignment - Quadratic Functions

Verified

Added on  2022/09/08

|7
|674
|21
Homework Assignment
AI Summary
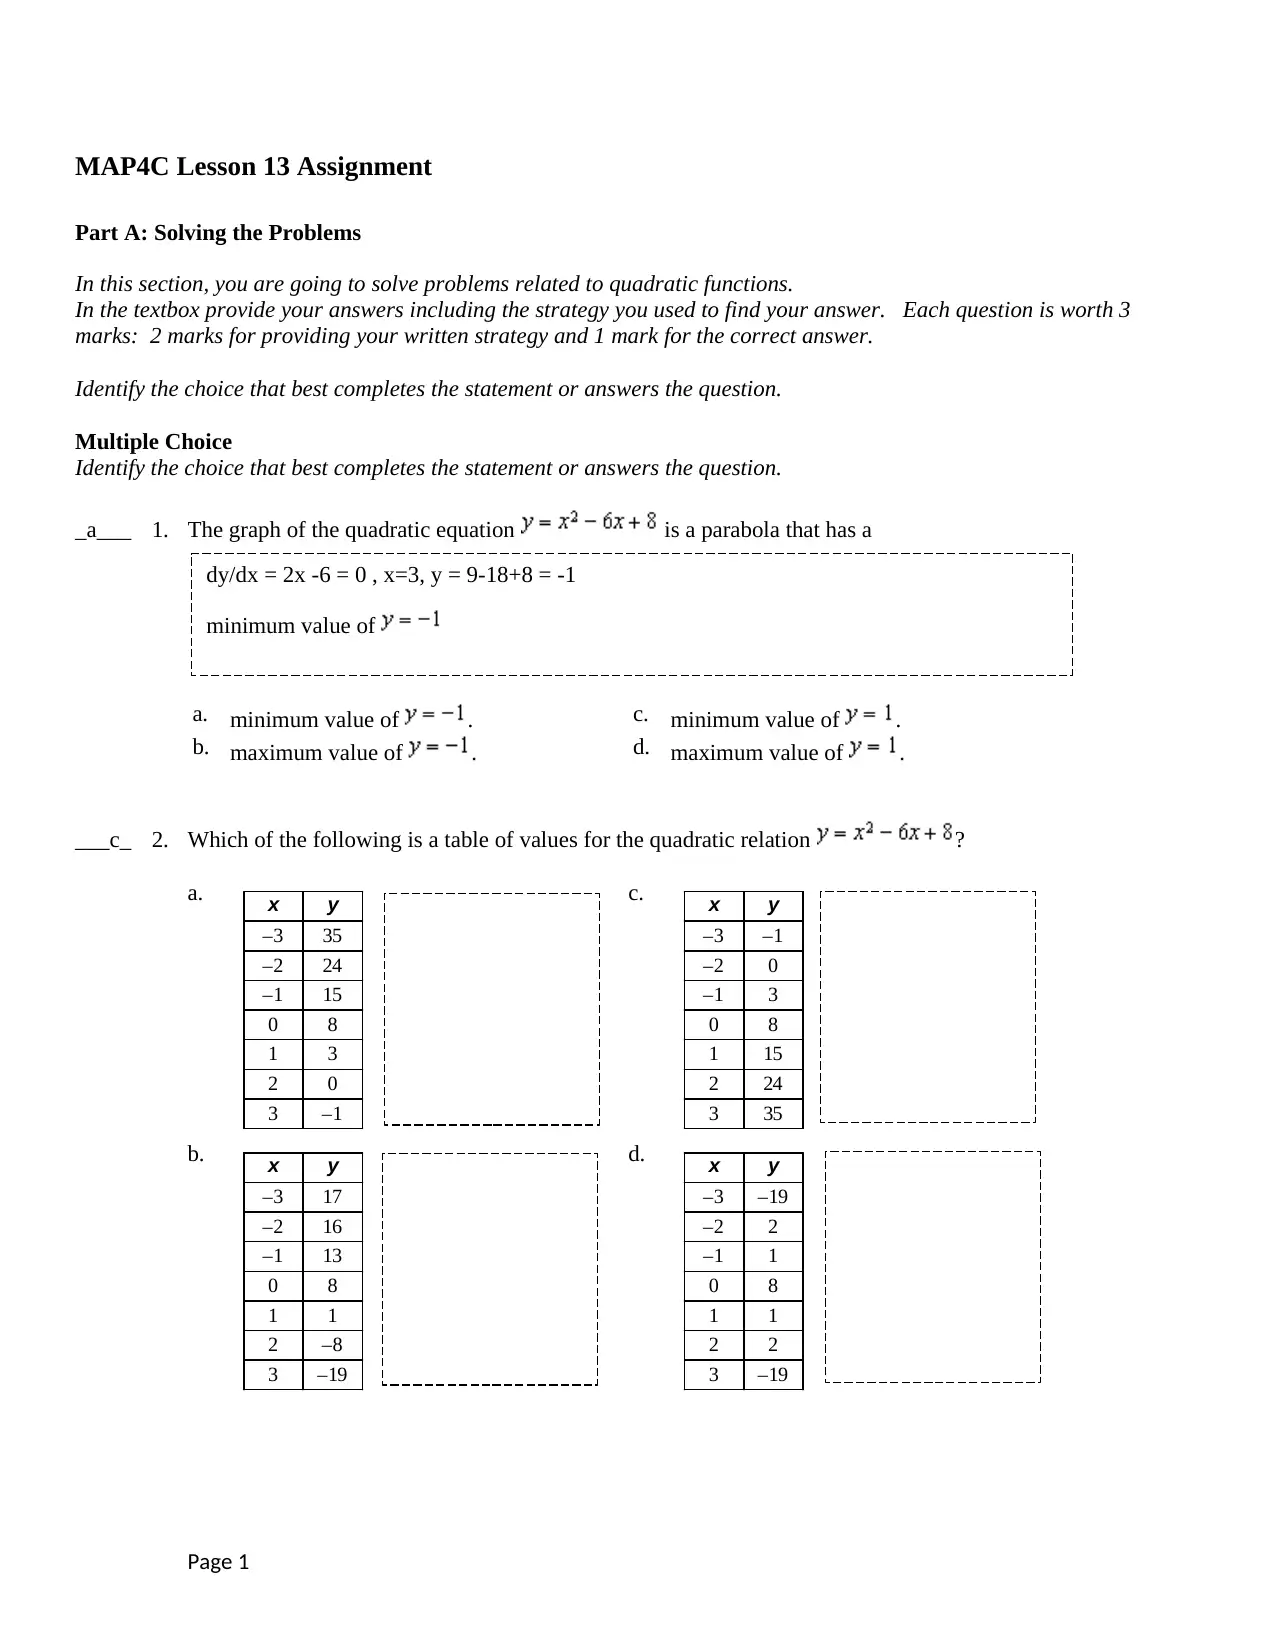
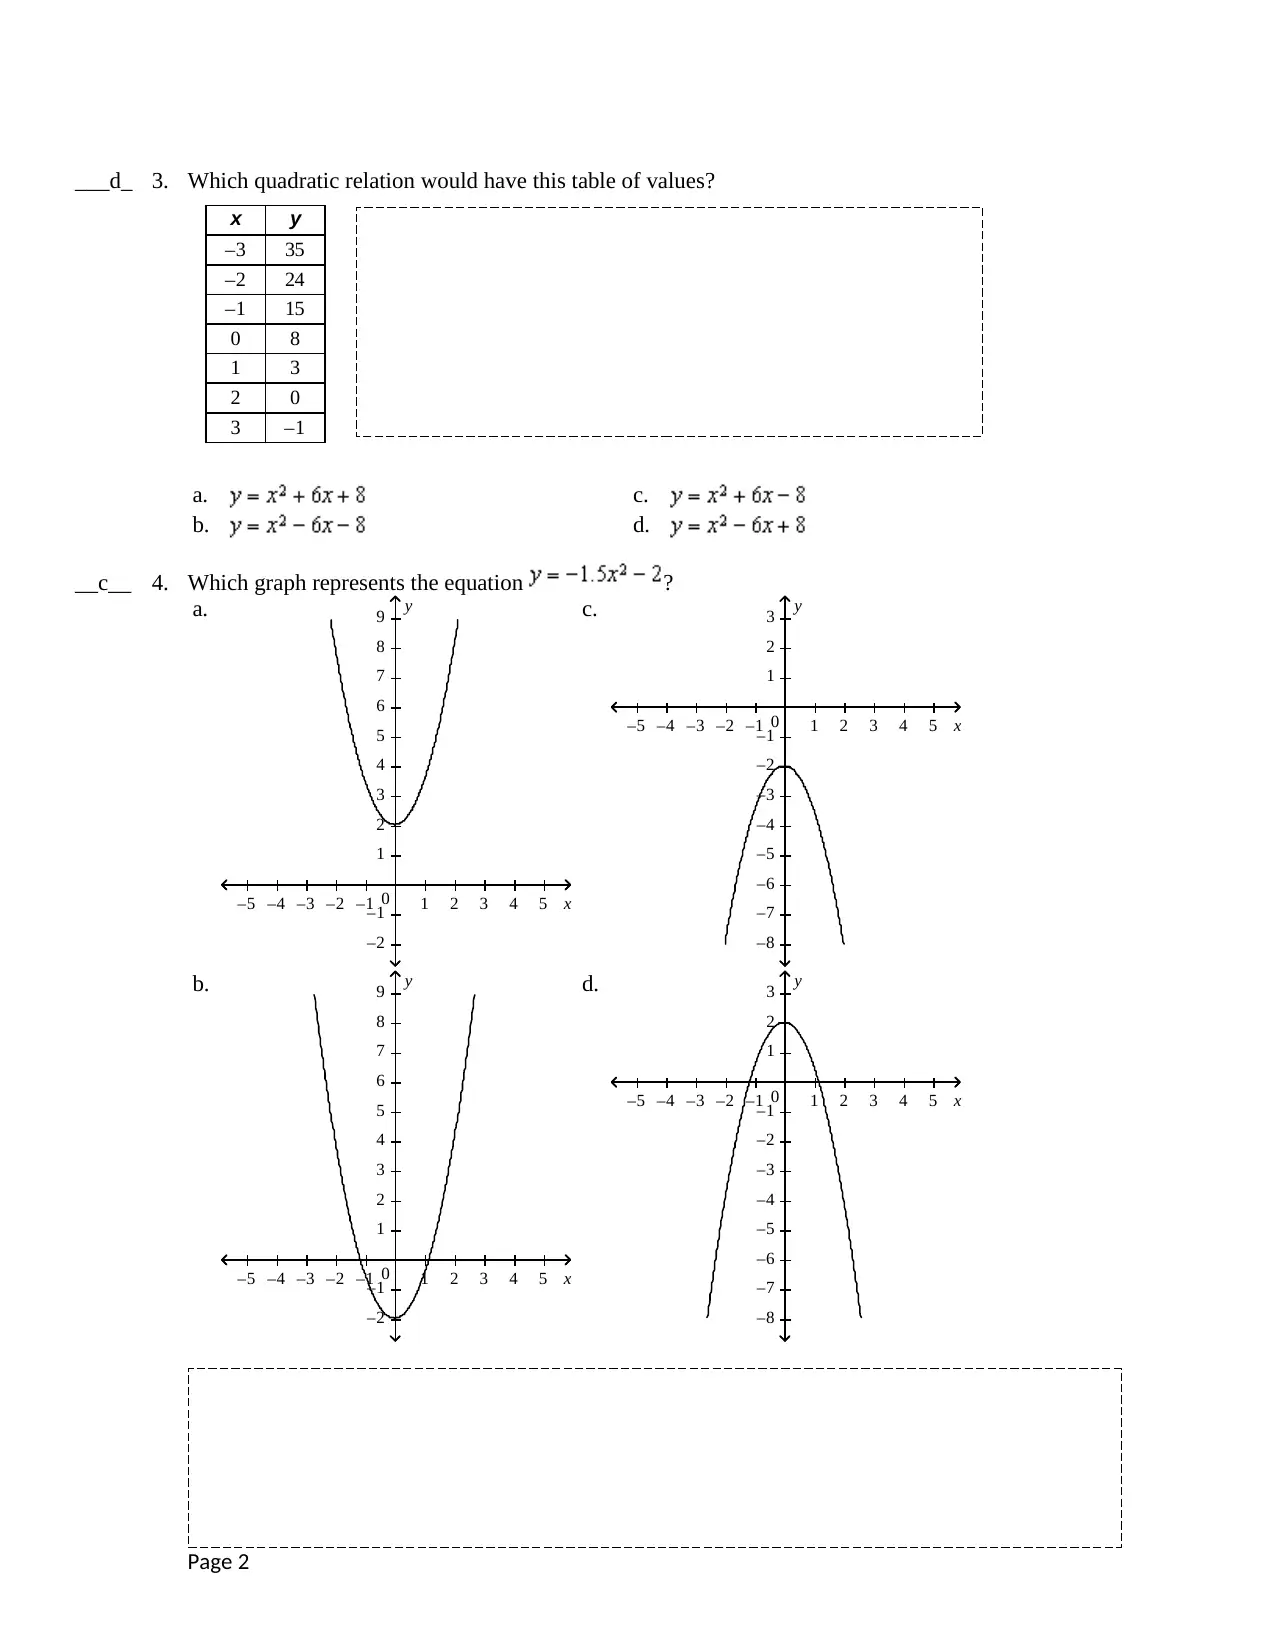
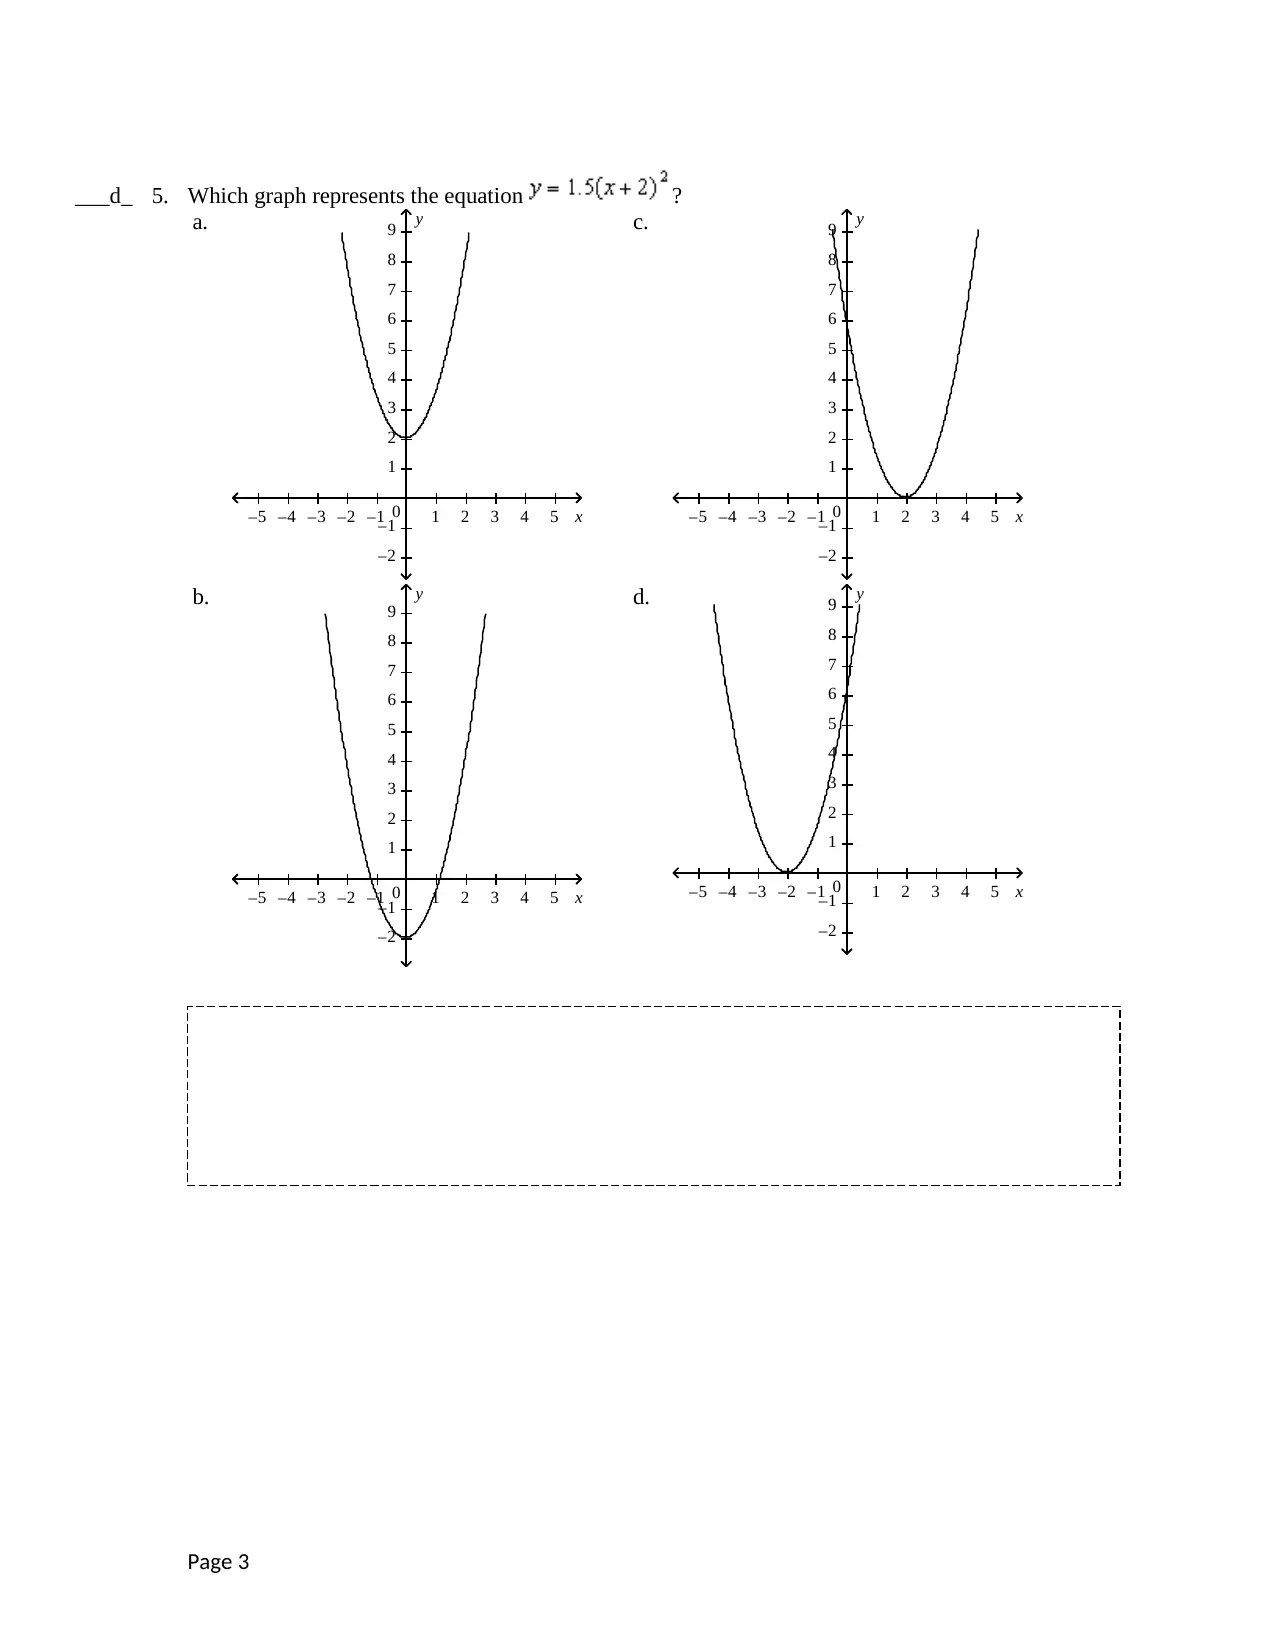
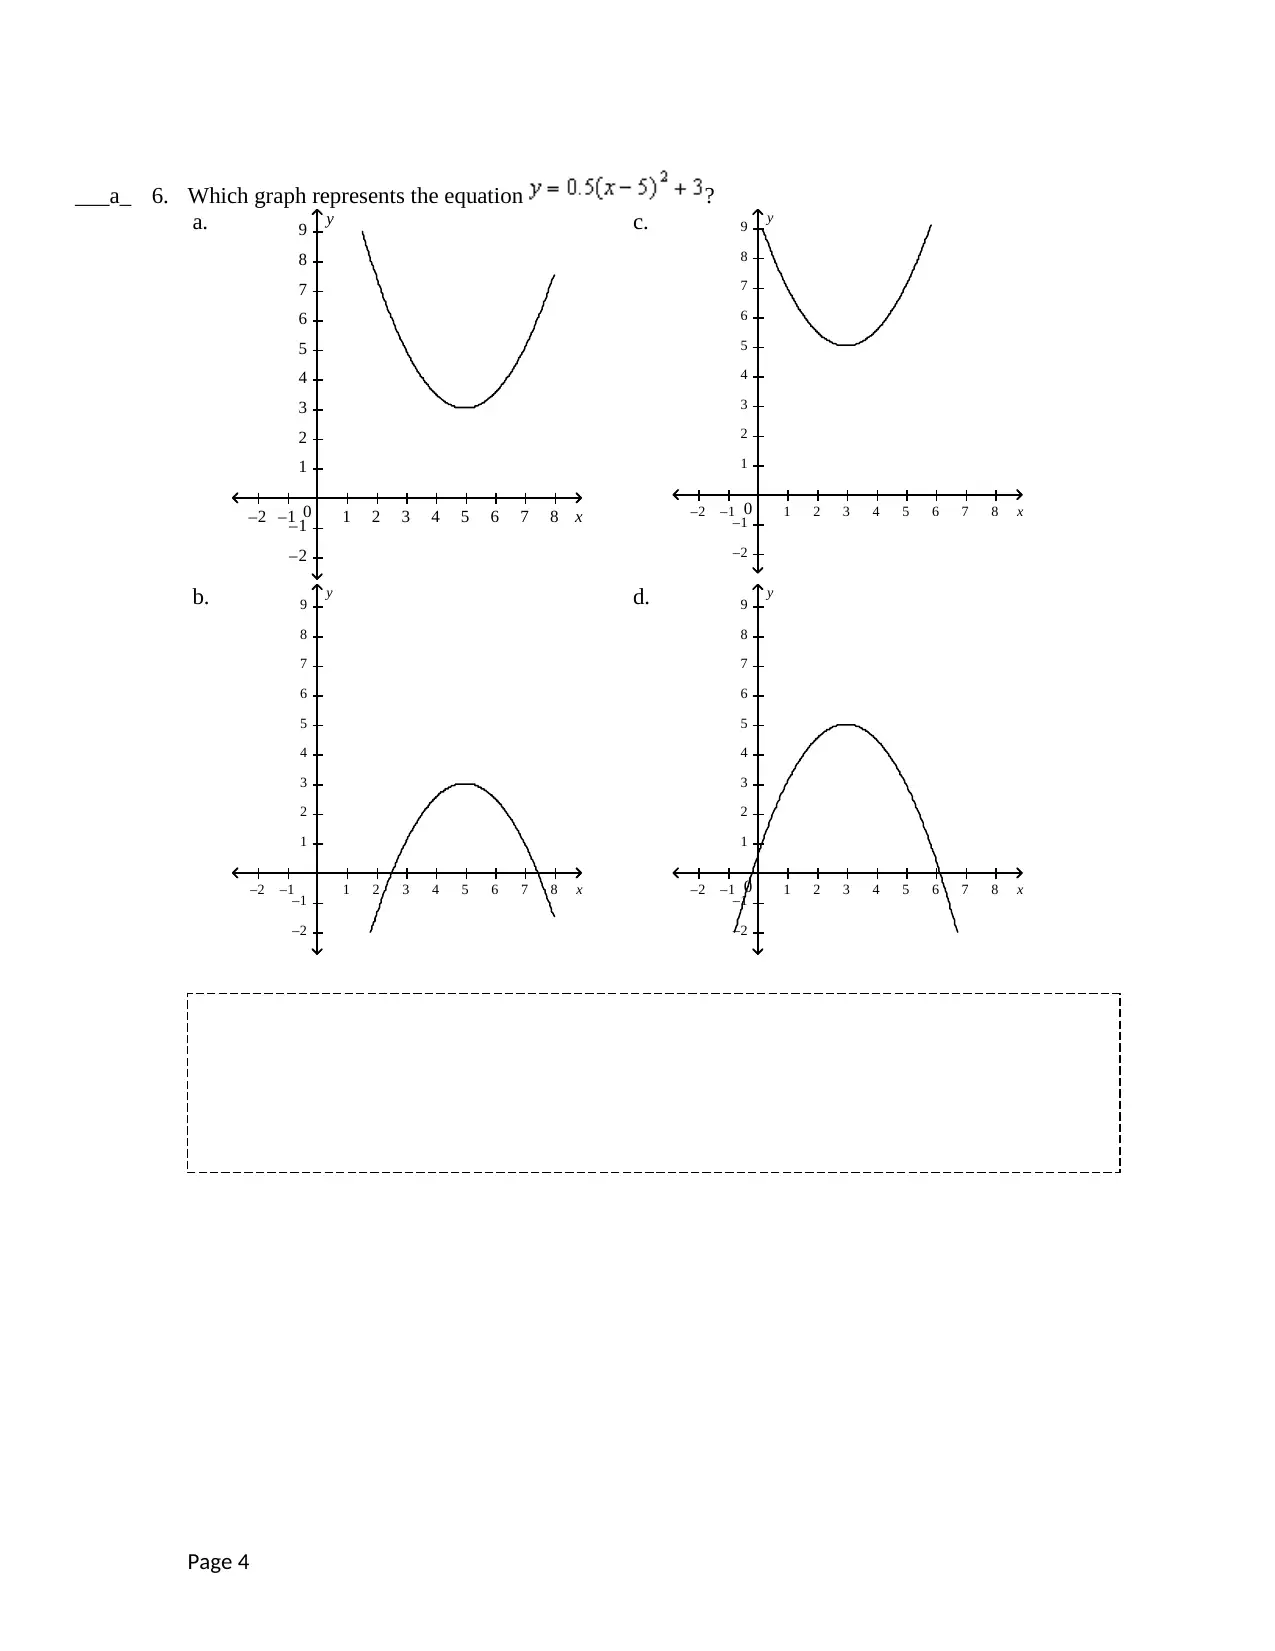
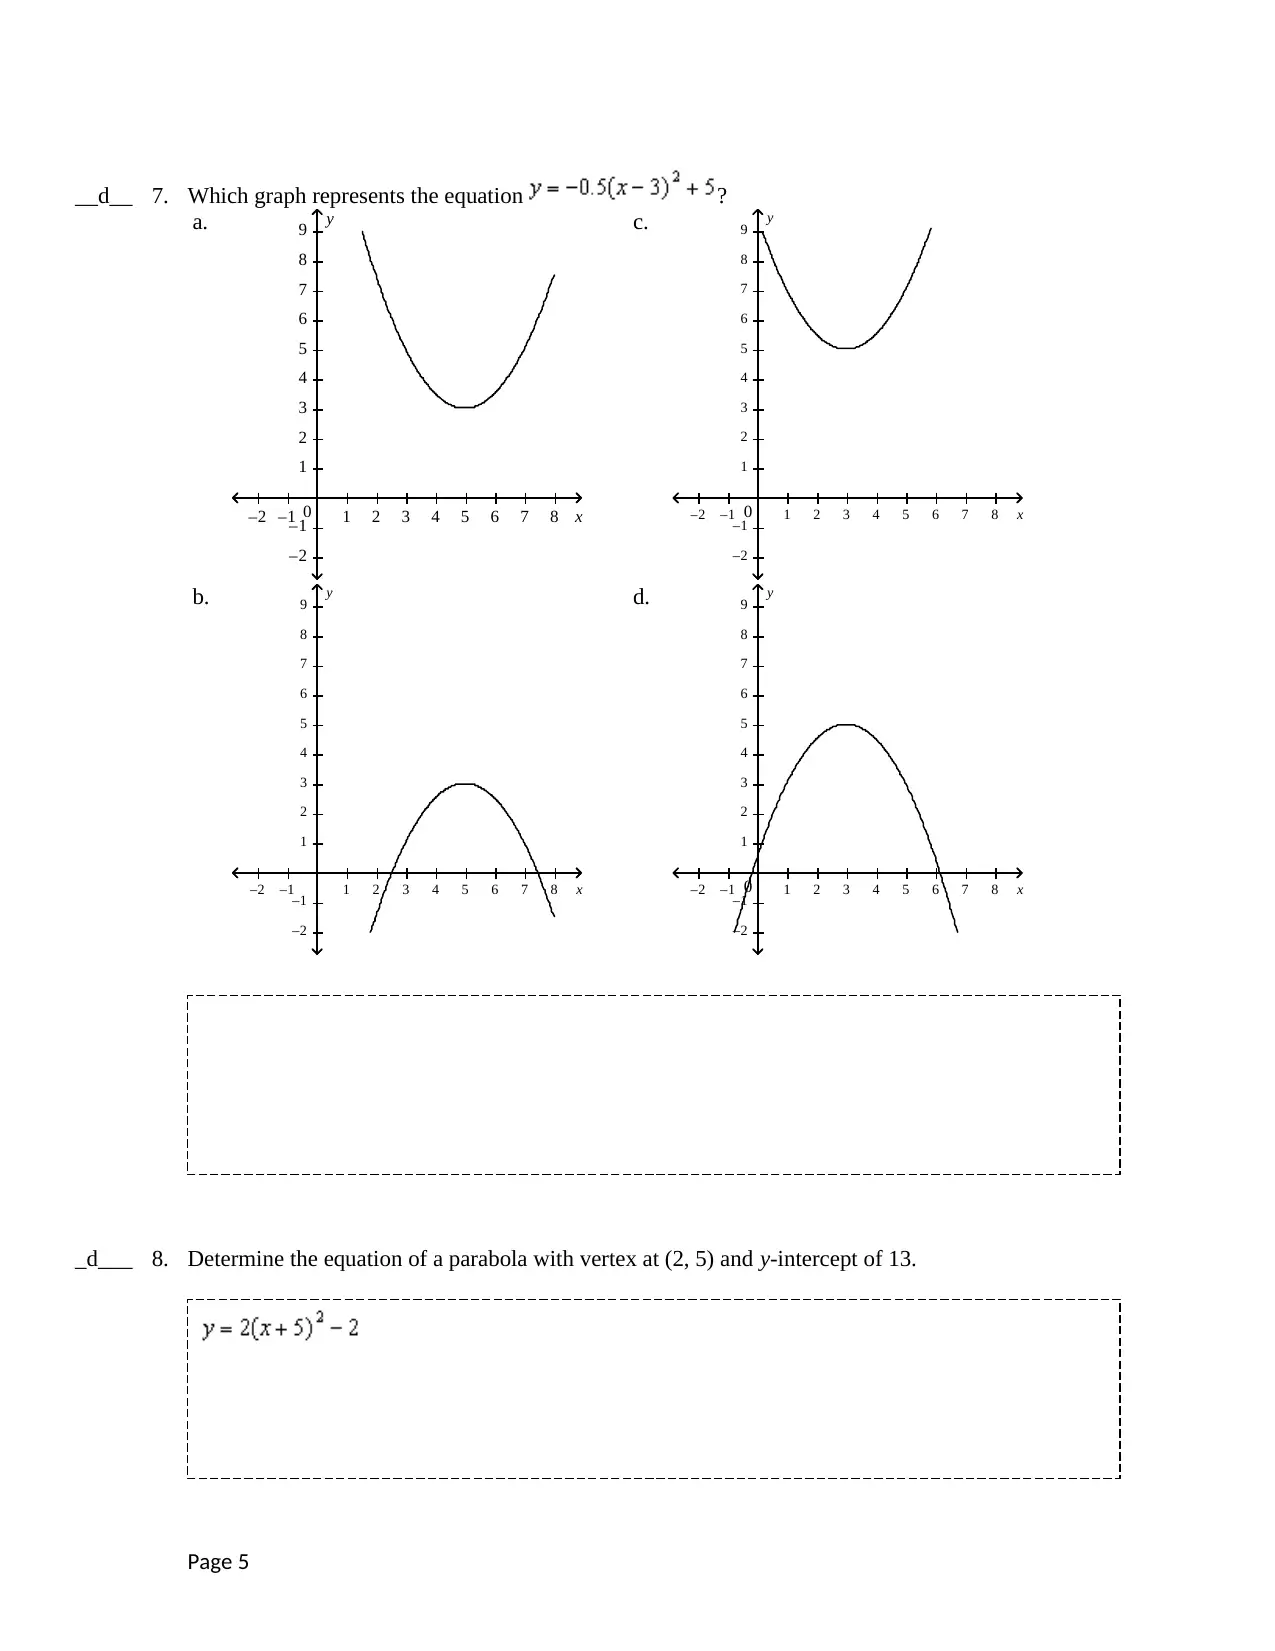
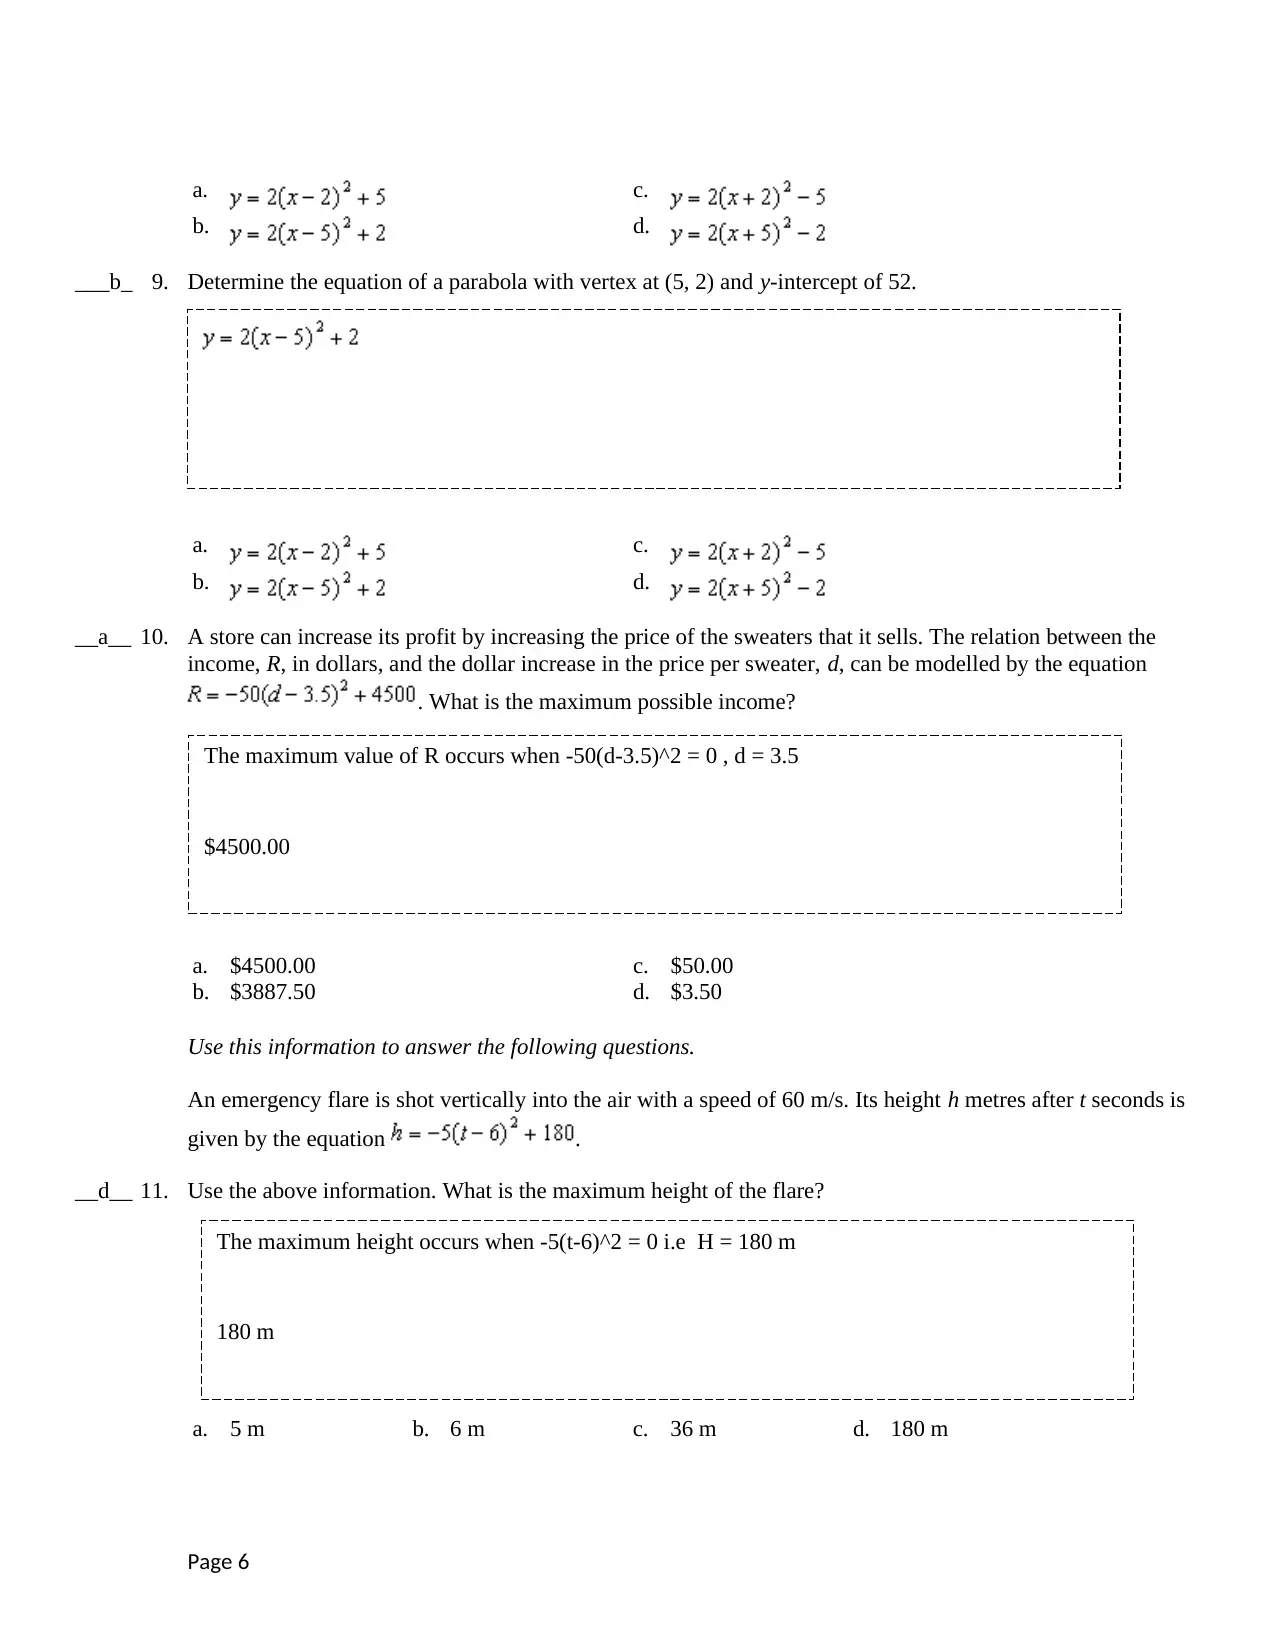
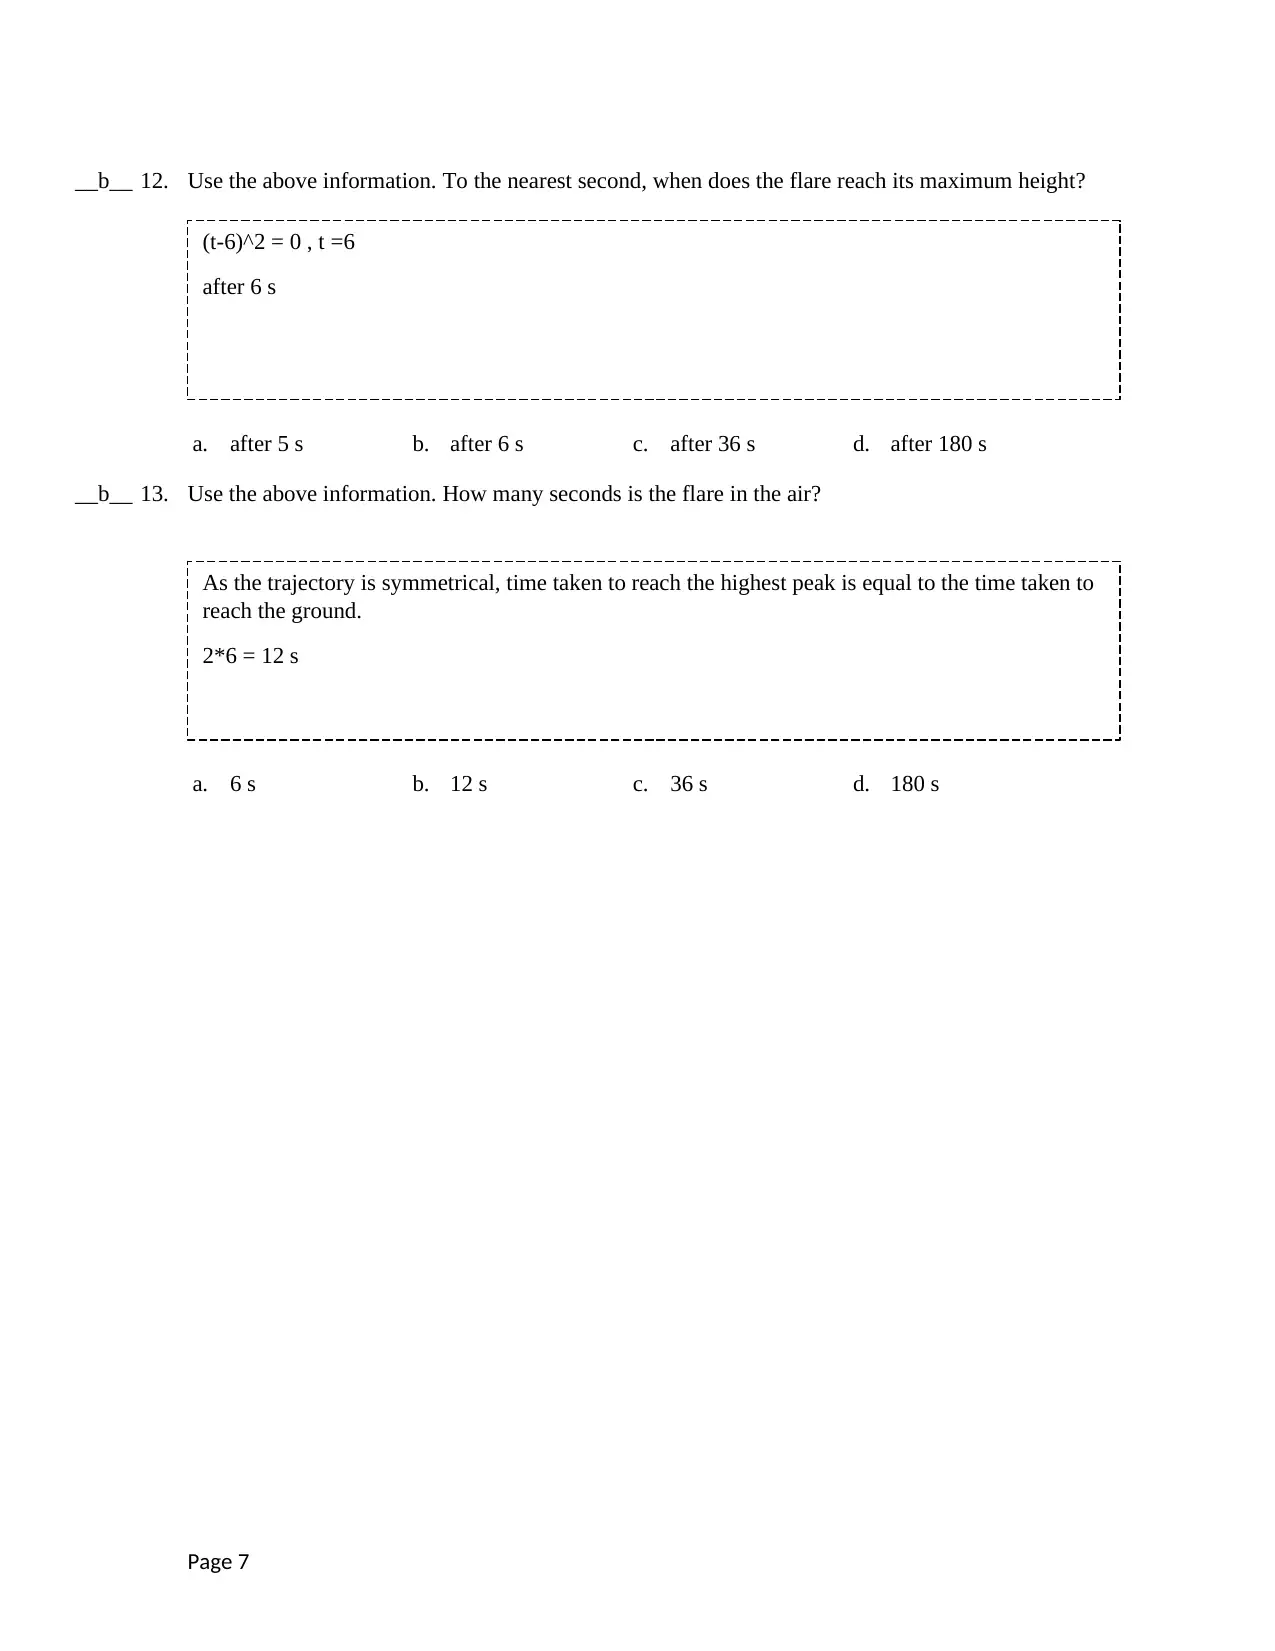
This assignment is a solution to the MAP4C Lesson 13 assignment, focusing on quadratic functions. The assignment presents multiple-choice questions that require students to solve problems related to quadratic equations, identify graphs, and determine equations based on given conditions. The solutions provided include the correct answers along with the strategies used to arrive at the solutions. The questions cover topics such as finding the minimum or maximum values of parabolas, identifying tables of values and graphs for quadratic relations, and determining equations of parabolas given their vertex and y-intercept. The assignment aims to assess students' understanding of quadratic functions and their ability to apply relevant formulas and concepts to solve problems. Students can use this document as a guide to understand the concepts and to learn the solving strategies.
Document Page
MAP4C Lesson 13 Assignment
Part A: Solving the Problems
In this section, you are going to solve problems related to quadratic functions.
In the textbox provide your answers including the strategy you used to find your answer. Each question is worth 3
marks: 2 marks for providing your written strategy and 1 mark for the correct answer.
Identify the choice that best completes the statement or answers the question.
Multiple Choice
Identify the choice that best completes the statement or answers the question.
_a___ 1. The graph of the quadratic equation is a parabola that has a
a. minimum value of . c. minimum value of .
b. maximum value of . d. maximum value of .
___c_ 2. Which of the following is a table of values for the quadratic relation ?
Page 1
dy/dx = 2x -6 = 0 , x=3, y = 9-18+8 = -1
minimum value of
a. x y
–3
–2
–1
0
1
2
3
35
24
15
8
3
0
–1
c. x y
–3
–2
–1
0
1
2
3
–1
0
3
8
15
24
35
b. x y
–3
–2
–1
0
1
2
3
17
16
13
8
1
–8
–19
d. x y
–3
–2
–1
0
1
2
3
–19
2
1
8
1
2
–19
tabler-icon-diamond-filled.svg

Paraphrase This Document

Need a fresh take? Get an instant paraphrase of this document with our AI Paraphraser
Document Page
___d_ 3. Which quadratic relation would have this table of values?
x y
–3
–2
–1
0
1
2
3
35
24
15
8
3
0
–1
a. c.
b. d.
__c__ 4. Which graph represents the equation ?
a.
0 1 2 3 4 5–1–2–3–4–5 x
1
2
3
4
5
6
7
8
9
–1
–2
y c.
0 1 2 3 4 5–1–2–3–4–5 x
1
2
3
–1
–2
–3
–4
–5
–6
–7
–8
y
b.
0 1 2 3 4 5–1–2–3–4–5 x
1
2
3
4
5
6
7
8
9
–1
–2
y d.
0 1 2 3 4 5–1–2–3–4–5 x
1
2
3
–1
–2
–3
–4
–5
–6
–7
–8
y
Page 2
Document Page
___d_ 5. Which graph represents the equation ?
a.
0 1 2 3 4 5–1–2–3–4–5 x
1
2
3
4
5
6
7
8
9
–1
–2
y c.
0 1 2 3 4 5–1–2–3–4–5 x
1
2
3
4
5
6
7
8
9
–1
–2
y
b.
0 1 2 3 4 5–1–2–3–4–5 x
1
2
3
4
5
6
7
8
9
–1
–2
y d.
0 1 2 3 4 5–1–2–3–4–5 x
1
2
3
4
5
6
7
8
9
–1
–2
y
Page 3
Document Page
___a_ 6. Which graph represents the equation ?
a.
0 1 2 3 4 5 6 7 8–1–2 x
1
2
3
4
5
6
7
8
9
–1
–2
y c.
0 1 2 3 4 5 6 7 8–1–2 x
1
2
3
4
5
6
7
8
9
–1
–2
y
b.
1 2 3 4 5 6 7 8–1–2 x
1
2
3
4
5
6
7
8
9
–1
–2
y d.
0 1 2 3 4 5 6 7 8–1–2 x
1
2
3
4
5
6
7
8
9
–1
–2
y
Page 4
tabler-icon-diamond-filled.svg

Paraphrase This Document

Need a fresh take? Get an instant paraphrase of this document with our AI Paraphraser
Document Page
__d__ 7. Which graph represents the equation ?
a.
0 1 2 3 4 5 6 7 8–1–2 x
1
2
3
4
5
6
7
8
9
–1
–2
y c.
0 1 2 3 4 5 6 7 8–1–2 x
1
2
3
4
5
6
7
8
9
–1
–2
y
b.
1 2 3 4 5 6 7 8–1–2 x
1
2
3
4
5
6
7
8
9
–1
–2
y d.
0 1 2 3 4 5 6 7 8–1–2 x
1
2
3
4
5
6
7
8
9
–1
–2
y
_d___ 8. Determine the equation of a parabola with vertex at (2, 5) and y-intercept of 13.
Page 5
Document Page
a. c.
b. d.
___b_ 9. Determine the equation of a parabola with vertex at (5, 2) and y-intercept of 52.
a. c.
b. d.
__a__ 10. A store can increase its profit by increasing the price of the sweaters that it sells. The relation between the
income, R, in dollars, and the dollar increase in the price per sweater, d, can be modelled by the equation
. What is the maximum possible income?
a. $4500.00 c. $50.00
b. $3887.50 d. $3.50
Use this information to answer the following questions.
An emergency flare is shot vertically into the air with a speed of 60 m/s. Its height h metres after t seconds is
given by the equation .
__d__ 11. Use the above information. What is the maximum height of the flare?
a. 5 m b. 6 m c. 36 m d. 180 m
Page 6
The maximum value of R occurs when -50(d-3.5)^2 = 0 , d = 3.5
$4500.00
The maximum height occurs when -5(t-6)^2 = 0 i.e H = 180 m
180 m
Document Page
__b__ 12. Use the above information. To the nearest second, when does the flare reach its maximum height?
a. after 5 s b. after 6 s c. after 36 s d. after 180 s
__b__ 13. Use the above information. How many seconds is the flare in the air?
a. 6 s b. 12 s c. 36 s d. 180 s
Page 7
(t-6)^2 = 0 , t =6
after 6 s
As the trajectory is symmetrical, time taken to reach the highest peak is equal to the time taken to
reach the ground.
2*6 = 12 s
chevron_up_icon
1 out of 7
circle_padding
hide_on_mobile
zoom_out_icon
[object Object]