MTH 47 Statistics Project: Qualitative and Quantitative Analysis
VerifiedAdded on 2022/08/18
|8
|1026
|12
Project
AI Summary
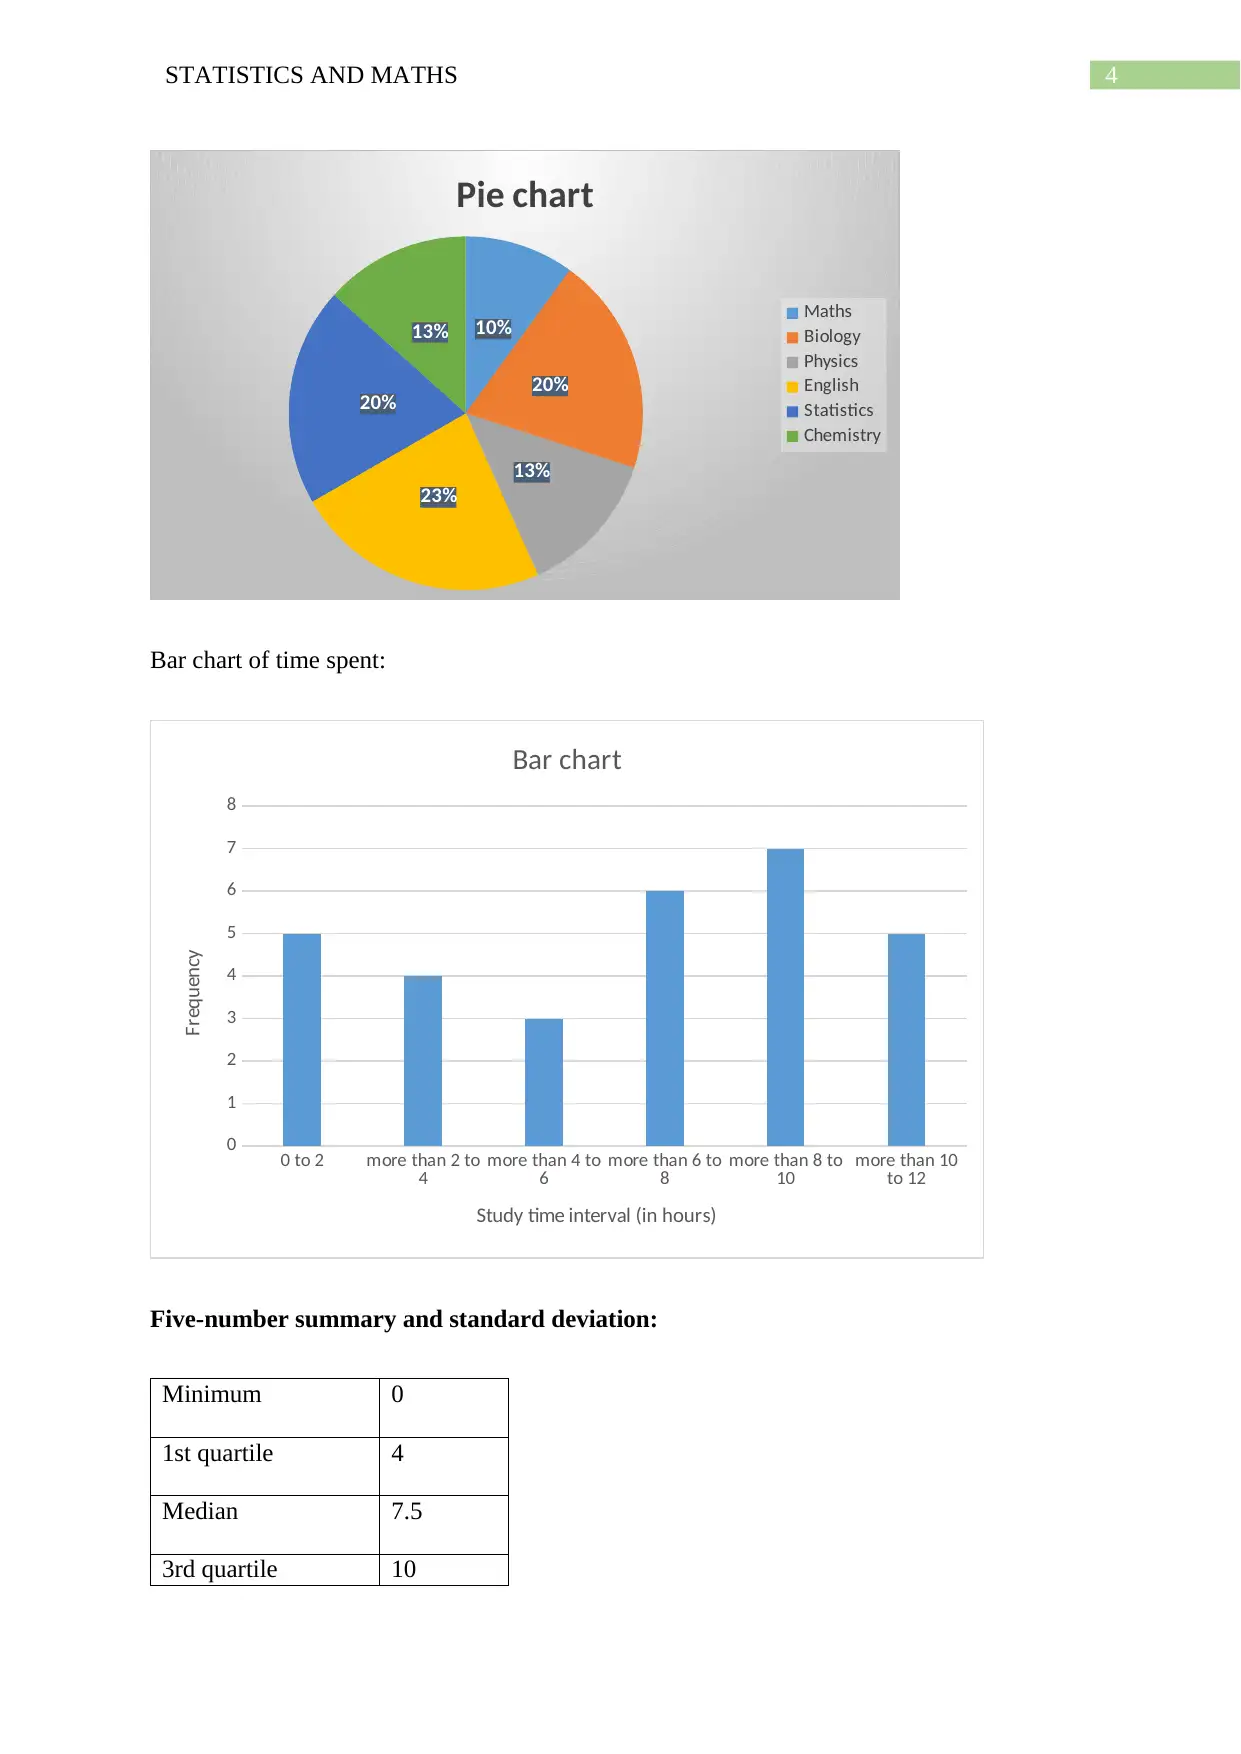
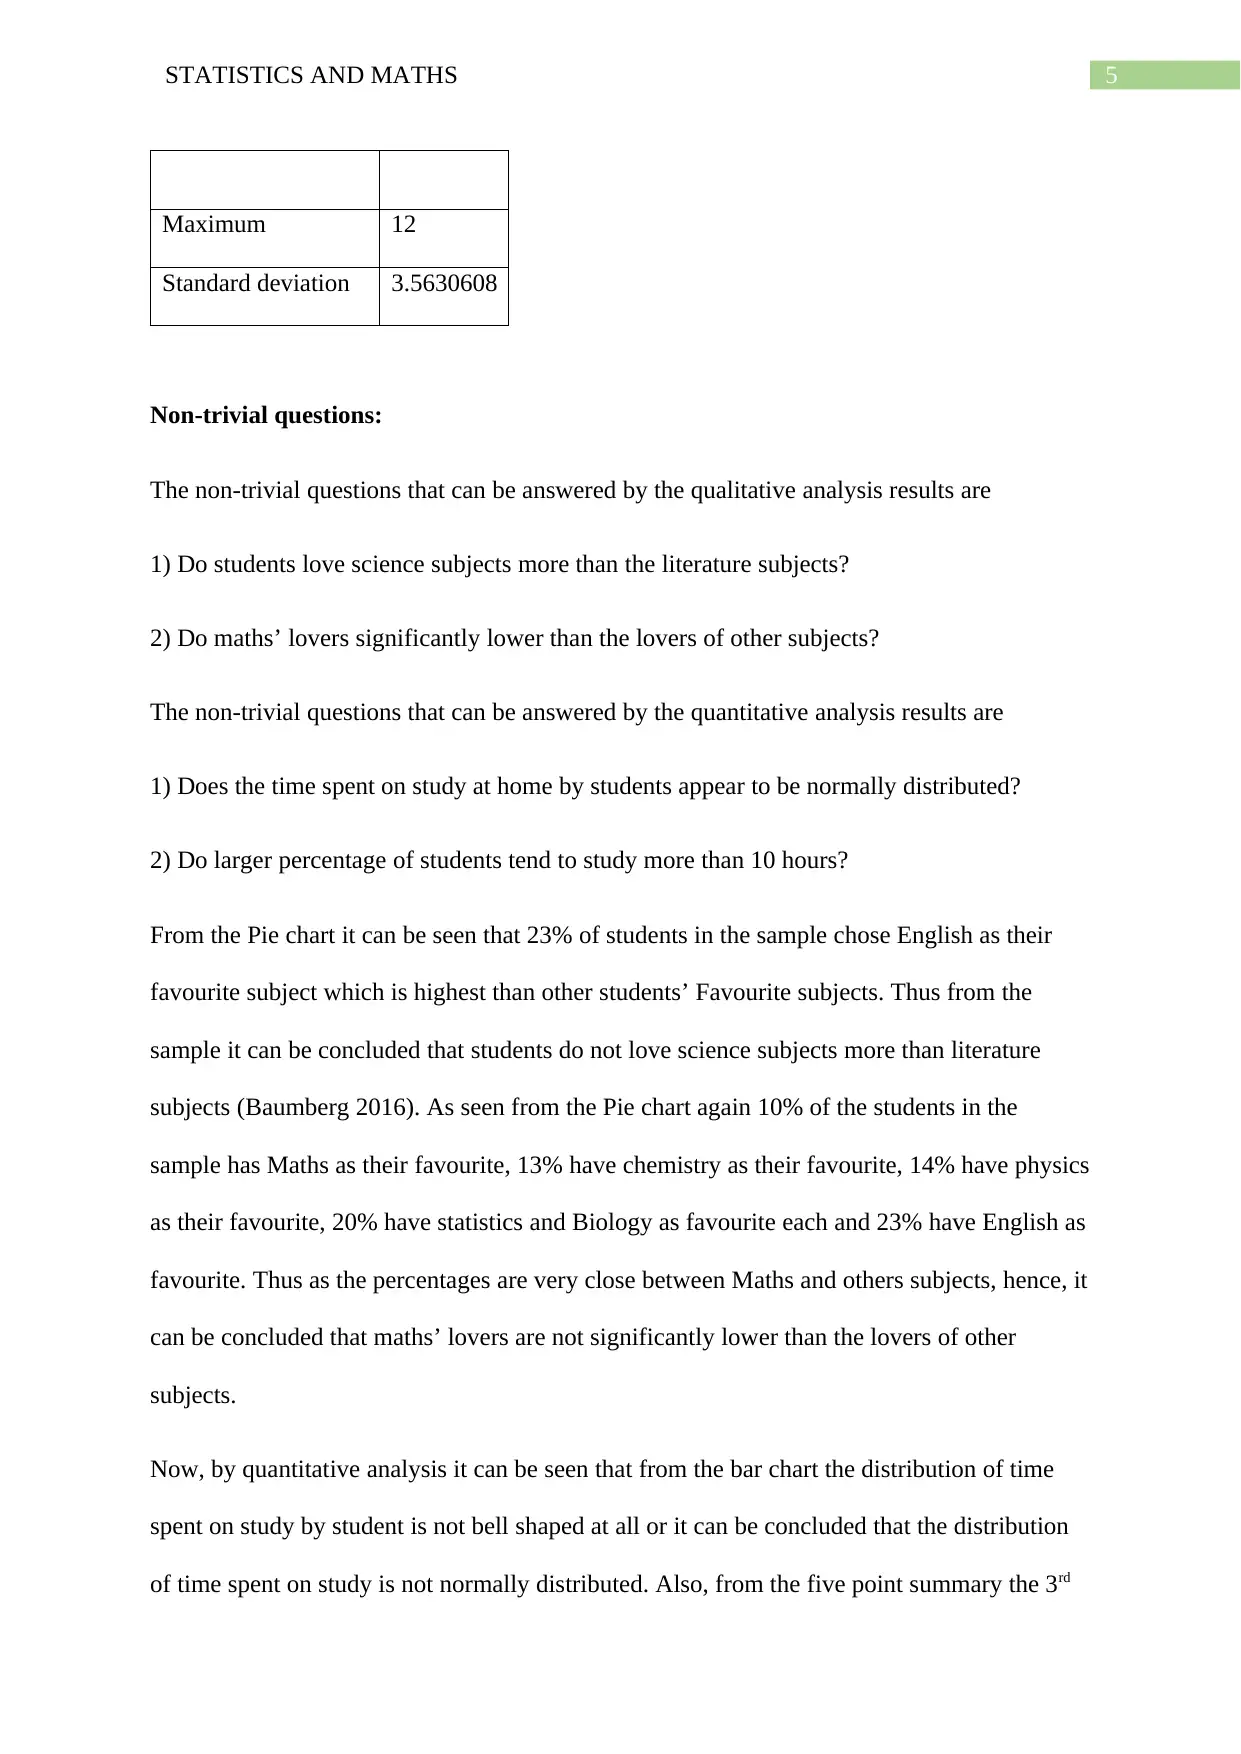
This statistics project analyzes survey data collected from a sample of 30 individuals, addressing both qualitative and quantitative questions. The assignment begins with defining two survey questions: one qualitative (favorite subject) and one quantitative (study time). The data collected is then organiz...

Running head: STATISTICS AND MATHS
STATISTICS AND MATHS
Name of the Student
Name of the University
Author Note
STATISTICS AND MATHS
Name of the Student
Name of the University
Author Note
Paraphrase This Document
Need a fresh take? Get an instant paraphrase of this document with our AI Paraphraser

1STATISTICS AND MATHS
Introduction:
In this assignment a random sample of 30 people are asked two questions (one
qualitative and another quantitative) questions and based on their response data analysis is
performed that includes some basic charts and graphs with descriptive statistics calculations.
Then four questions are answered indirectly from the analysis results (Bengtsson 2016). The
responses of the two questions asked to 30 individuals are kept in a excel file as given below.
Topic questions:
Qualitative question: Which subject is you’re most favourite in the class?
Quantitative question: How much time in hours do you study at home?
Sample selection and data collection process:
The sample of 30 classmates are selected randomly from all over the classes and are asked
each of the two question in personal interview. All of the 30 individuals participated in the
survey by answering both questions with acceptable answers and hence the effective sample
size for data analysis is 30 (Rising Holmström et al. 2017). The collected data is given below.
Most favorite
subject
Study time at home(in hours)
Maths 8
Biology 10
Physics 10
English 2
Physics 4
Statistics 3
Statistics 8

2STATISTICS AND MATHS
Maths 9
Biology 11
Biology 8
English 5
Biology 7
English 2
Physics 9
Chemistry 7
Chemistry 5
Physics 11
Statistics 2
Biology 12
English 9
Chemistry 6
Statistics 0
English 12
English 0
Maths 4
Chemistry 10
Statistics 4
English 11
Biology 7
Statistics 9
Maths 9
Biology 11
Biology 8
English 5
Biology 7
English 2
Physics 9
Chemistry 7
Chemistry 5
Physics 11
Statistics 2
Biology 12
English 9
Chemistry 6
Statistics 0
English 12
English 0
Maths 4
Chemistry 10
Statistics 4
English 11
Biology 7
Statistics 9
⊘ This is a preview!⊘
Do you want full access?
Subscribe today to unlock all pages.

Trusted by 1+ million students worldwide

3STATISTICS AND MATHS
Frequency distribution:
Frequency distribution for favourite subject:
Subject Frequency
Maths 3
Biology 6
Physics 4
English 7
Statistics 6
Chemistry 4
Total 30
Frequency distribution for time spent:
Study time interval(in
hours)
Frequency
0 to 2 5
more than 2 to 4 4
more than 4 to 6 3
more than 6 to 8 6
more than 8 to 10 7
more than 10 to 12 5
Statistical graphs:
Pie chart of Favourite subject:
Paraphrase This Document
Need a fresh take? Get an instant paraphrase of this document with our AI Paraphraser

4STATISTICS AND MATHS
10%
20%
13%
23%
20%
13%
Pie chart
Maths
Biology
Physics
English
Statistics
Chemistry
Bar chart of time spent:
0 to 2 more than 2 to
4 more than 4 to
6 more than 6 to
8 more than 8 to
10 more than 10
to 12
0
1
2
3
4
5
6
7
8
Bar chart
Study time interval (in hours)
Frequency
Five-number summary and standard deviation:
Minimum 0
1st quartile 4
Median 7.5
3rd quartile 10

5STATISTICS AND MATHS
Maximum 12
Standard deviation 3.5630608
Non-trivial questions:
The non-trivial questions that can be answered by the qualitative analysis results are
1) Do students love science subjects more than the literature subjects?
2) Do maths’ lovers significantly lower than the lovers of other subjects?
The non-trivial questions that can be answered by the quantitative analysis results are
1) Does the time spent on study at home by students appear to be normally distributed?
2) Do larger percentage of students tend to study more than 10 hours?
From the Pie chart it can be seen that 23% of students in the sample chose English as their
favourite subject which is highest than other students’ Favourite subjects. Thus from the
sample it can be concluded that students do not love science subjects more than literature
subjects (Baumberg 2016). As seen from the Pie chart again 10% of the students in the
sample has Maths as their favourite, 13% have chemistry as their favourite, 14% have physics
as their favourite, 20% have statistics and Biology as favourite each and 23% have English as
favourite. Thus as the percentages are very close between Maths and others subjects, hence, it
can be concluded that maths’ lovers are not significantly lower than the lovers of other
subjects.
Now, by quantitative analysis it can be seen that from the bar chart the distribution of time
spent on study by student is not bell shaped at all or it can be concluded that the distribution
of time spent on study is not normally distributed. Also, from the five point summary the 3rd
⊘ This is a preview!⊘
Do you want full access?
Subscribe today to unlock all pages.

Trusted by 1+ million students worldwide

6STATISTICS AND MATHS
quartile is 10 and the standard deviation is 3.563 indicating many values less than 10 (Shi et
al. 2018). Thus it can be concluded that there is no sufficient evidence from the sample that
large number of students tend to study more than 10 hours at home.
Conclusion:
Hence, in conclusion it can be stated that the objectives of the assignment are successfully
met satisfying the conditions of qualitative and quantitative research with visual and
analytical interpretations and minimum sample size. The selected sample is considered
random, however, in process of survey data collection through personal interview the first
available student in each class were approached and thus the result can be a little biased.
Also, due to low sample size which is accepted to reduce the time of interviewing procedure
can lead to a significant amount of sampling error in the results. All the non-trivial questions
for qualitative and quantitative research are positively answered from the data analysis and
visual charts as depicted earlier.
Paraphrase This Document
Need a fresh take? Get an instant paraphrase of this document with our AI Paraphraser

7STATISTICS AND MATHS
References:
Baumberg, B., 2016. The stigma of claiming benefits: a quantitative study. Journal of Social
Policy, 45(2), pp.181-199.
Bengtsson, M., 2016. How to plan and perform a qualitative study using content
analysis. NursingPlus Open, 2, pp.8-14.
Rising Holmström, M., Häggström, M., Audulv, Å., Junehag, L., Coyne, I. and Söderberg, S.,
2017. To integrate and manage diabetes in school: Youth’s experiences of living with Type 1
diabetes in relation to school–a qualitative study. International Diabetes Nursing, 14(2-3),
pp.46-51.
Shi, J., Luo, D., Weng, H., Zeng, X.T., Lin, L. and Tong, T., 2018. How to estimate the
sample mean and standard deviation from the five number summary?. arXiv preprint
arXiv:1801.01267.
1 out of 8
Related Documents

Your All-in-One AI-Powered Toolkit for Academic Success.
+13062052269
info@desklib.com
Available 24*7 on WhatsApp / Email
Unlock your academic potential
© 2024 | Zucol Services PVT LTD | All rights reserved.