Quality Control Report: P-chart Analysis of iKettle Production Process

Verified

Added on  2022/11/15

|7
|1152
|263
Report
AI Summary
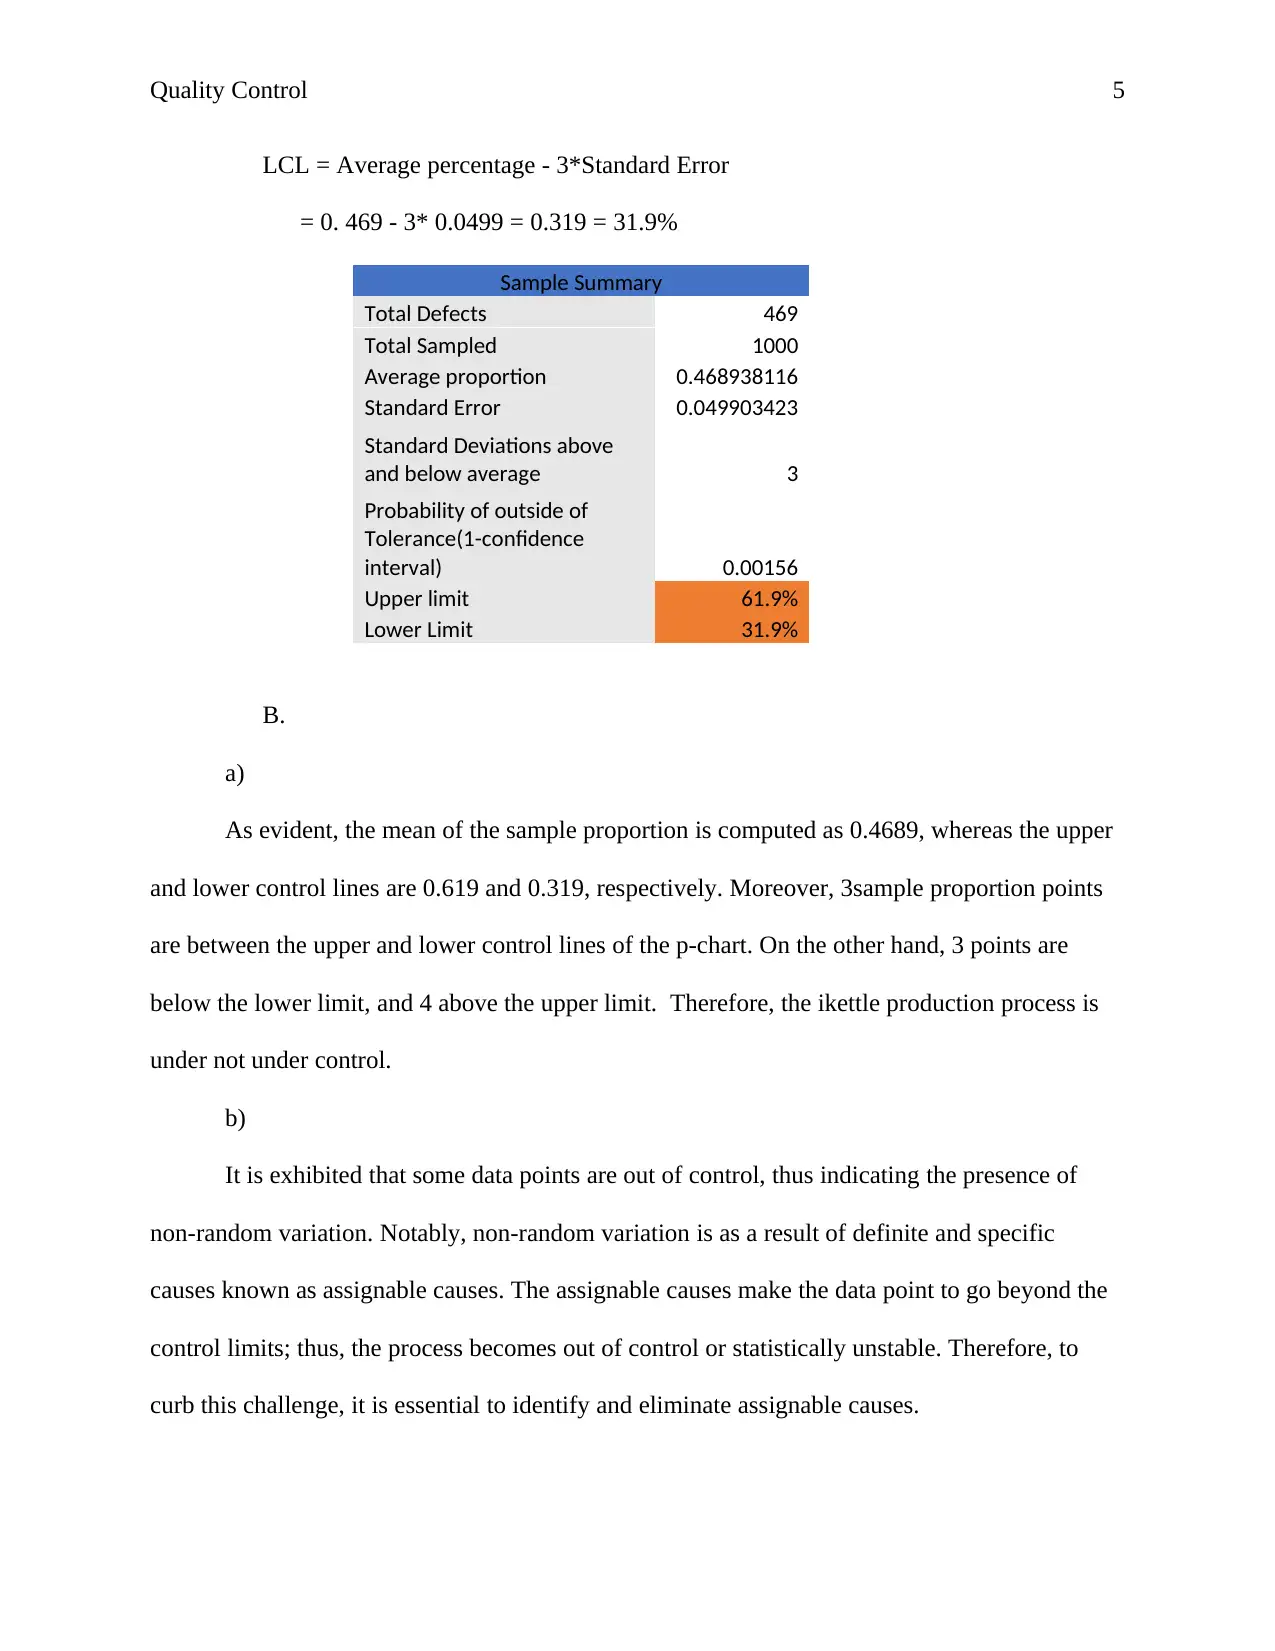
This report presents a P-chart analysis of the iKettle production process. The study utilizes statistical process control (SPC) to assess the product's quality, employing a P-chart to determine if the production is under control. A random dataset of iKettle production is generated, and the percentage of defects is calculated. The report calculates the upper and lower control limits, revealing that the production process is not under control due to the presence of non-random variation. The report identifies assignable causes and suggests improvement measures such as creating constancy of purpose, continuous product improvement, breaking down departmental barriers, and adopting teamwork to optimize future production quality. The analysis includes calculations for the average percentage of defects, standard error, and control limits, offering a detailed assessment of the production process's stability and providing recommendations for quality enhancement.
tabler-icon-diamond-filled.svg

Contribute Materials

Your contribution can guide someone’s learning journey. Share your documents today.
Document Page
Running header: Quality Control 1
Quality Control: P-chart
Name:
Institution:
tabler-icon-diamond-filled.svg

Secure Best Marks with AI Grader

Need help grading? Try our AI Grader for instant feedback on your assignments.
Document Page
Quality Control 2
A.
Hot water, tea, or coffee we all tend to consume either of the products at least once a day
either, in work stations, homes, or schools. However, people sometimes feel lazy, tired, or busy
to heat water or any of the products manually. On the other hand, it is fascinating that people are
always close or near their personal computers (laptops) or smartphones thus it is necessary to
build a product that will aid in heating water without altering their “comfort zones.” Therefore,
by creating an ikettle that connects to the smartphone or the PC using a Bluetooth or Wi-Fi will
solve the above problem. The kettle can be switched on or off from your phone or PC, thus
enabling people to continue consuming their favorite drinks “stimulants.” Moreover, the product
will save time, particularly in a work station set-up.
There is no doubt quality control (QC) practices tend to develop an appropriate
mechanism to the vital and challenging task of managing organizational change hence statistical
process control (SPC) is the critical way to QC. Notably, SPC is a set of methods that assess the
ongoing improvement of systems, processes, and outcome, whereby the technique uses the
trends and variation generated from a dataset (Toledo, Lizarelli, & Santana, 2017). There are
various tools incorporated in SPC, which include scatter diagrams, flow diagrams, frequency
plots, run charts, frequency charts, and control charts (Gejdoš, 2015). Therefore, it is essential to
assess the quality of the ikettle, whereby a control chart known as p-chart will be used to exhibit
if the production process of the product is under control or not.
a) As a result, to create a random dataset of ikettle produced;
i. My year of birth is (August, 8, 1974) thus X = 74 + 8 = 82
ii. N = 10
Document Page
Quality Control 3
iii. Using RAND()*82 10 sample proportions are given by
Number of
Defects
4
19
66
55
18
68
45
58
73
64
b) P-chart
Sample Number
Number of
Defects
Number
of Sample
Percent
of
Defects
Average of
Defects
Above or below
accepted value
1 4 100 4% 46.9% Below
2 19 100 18.6% 46.9% Below
3 66 100 66.1% 46.9% Above
4 55 100 54.6% 46.9%
5 18 100 17.8% 46.9% Below
6 68 100 68.0% 46.9% Above
7 45 100 44.6% 46.9%
8 58 100 58.0% 46.9%
9 73 100 73.0% 46.9% Above
10 64 100 64.1% 46.9% Above
The number of defects is computed using the RAND()*X excel function whereas Percent
of defects is given by; Number of defects / Number of sample; For instance, sample1 percent of
defects = 4/100 = 0.04 = 4%.
The average percent of defects is given by (4 + 18.6 + 66.1 + 54.6 + 17.8 + 68 + 44.6 +
58 + 73 + 64.1)/ 10 = 46.9%
Document Page
Quality Control 4
1 2 3 4 5 6 7 8 9 10
0
2
4
6
8
10
12
P-Chart
Upper limit Average of Defects
Lower Limit Percent of Defects
Sample number
Proportion
c) Notably, control limits are horizontal lines above and below the mean (center) line
that aid assessing whether the process in under control, they include the upper and
lower control limit (Gejdoš, 2015).
Upper Control limit (UCL)
The upper control limit exhibits the upper bound of the mean, which is calculated by
adding the margin of error (3*standard error) to the mean.
UCL = Average percentage + 3*Standard Error
Standard Error = p*q/N
= √(0.469 * 0.531) / 100
= √0.249 = 0.499
= 0. 469 + 3* 0.0499 = 0.619 = 61.9%
Lower Control limit (LCL)
The lower control limit exhibits the lower bound of the mean, which is calculated by
subtracting the margin of error (3*standard error) from the mean.
tabler-icon-diamond-filled.svg

Secure Best Marks with AI Grader

Need help grading? Try our AI Grader for instant feedback on your assignments.
Document Page
Quality Control 5
LCL = Average percentage - 3*Standard Error
= 0. 469 - 3* 0.0499 = 0.319 = 31.9%
Sample Summary
Total Defects 469
Total Sampled 1000
Average proportion 0.468938116
Standard Error 0.049903423
Standard Deviations above
and below average 3
Probability of outside of
Tolerance(1-confidence
interval) 0.00156
Upper limit 61.9%
Lower Limit 31.9%
B.
a)
As evident, the mean of the sample proportion is computed as 0.4689, whereas the upper
and lower control lines are 0.619 and 0.319, respectively. Moreover, 3sample proportion points
are between the upper and lower control lines of the p-chart. On the other hand, 3 points are
below the lower limit, and 4 above the upper limit. Therefore, the ikettle production process is
under not under control.
b)
It is exhibited that some data points are out of control, thus indicating the presence of
non-random variation. Notably, non-random variation is as a result of definite and specific
causes known as assignable causes. The assignable causes make the data point to go beyond the
control limits; thus, the process becomes out of control or statistically unstable. Therefore, to
curb this challenge, it is essential to identify and eliminate assignable causes.
Document Page
Quality Control 6
c)
Notably, there are various recommendable measures that will aid in optimizing the
quality of ikettle in future production, which include creating constancy of purpose towards
improving the product to become more competitive. Moreover, the company should regularly
improve every product step thus enhancing the quality of ikettle, which result in a decrease in the
cost of production and maximizes the profits generated. Besides, it is essential to break down the
barriers associated with the products in various departments. Notably, it is necessary to cease the
overdependence of inspection to achieve quality by building quality into the product in the
preliminary stage, thus eliminating the mass check-ups. Generally, to optimize quality in the
future production of the product, the company should adopt teamwork among the employees.
Document Page
Quality Control 7
References
Gejdoš, P. (2015). Continuous Quality Improvement by Statistical Process Control. Procedia
Economics and Finance, 565-572.
Toledo, J. C., Lizarelli, F. L., & Santana, M. B. (2017). Success factors in the implementation of
statistical process control: action research in a chemical plant. SciELO Analytics, 47-54.
chevron_up_icon
1 out of 7
circle_padding
hide_on_mobile
zoom_out_icon
logo.png

Your All-in-One AI-Powered Toolkit for Academic Success.

Available 24*7 on WhatsApp / Email

[object Object]