Report on Total Quality Management and Continuous Improvement
VerifiedAdded on 2022/10/12
|11
|1794
|249
Report
AI Summary
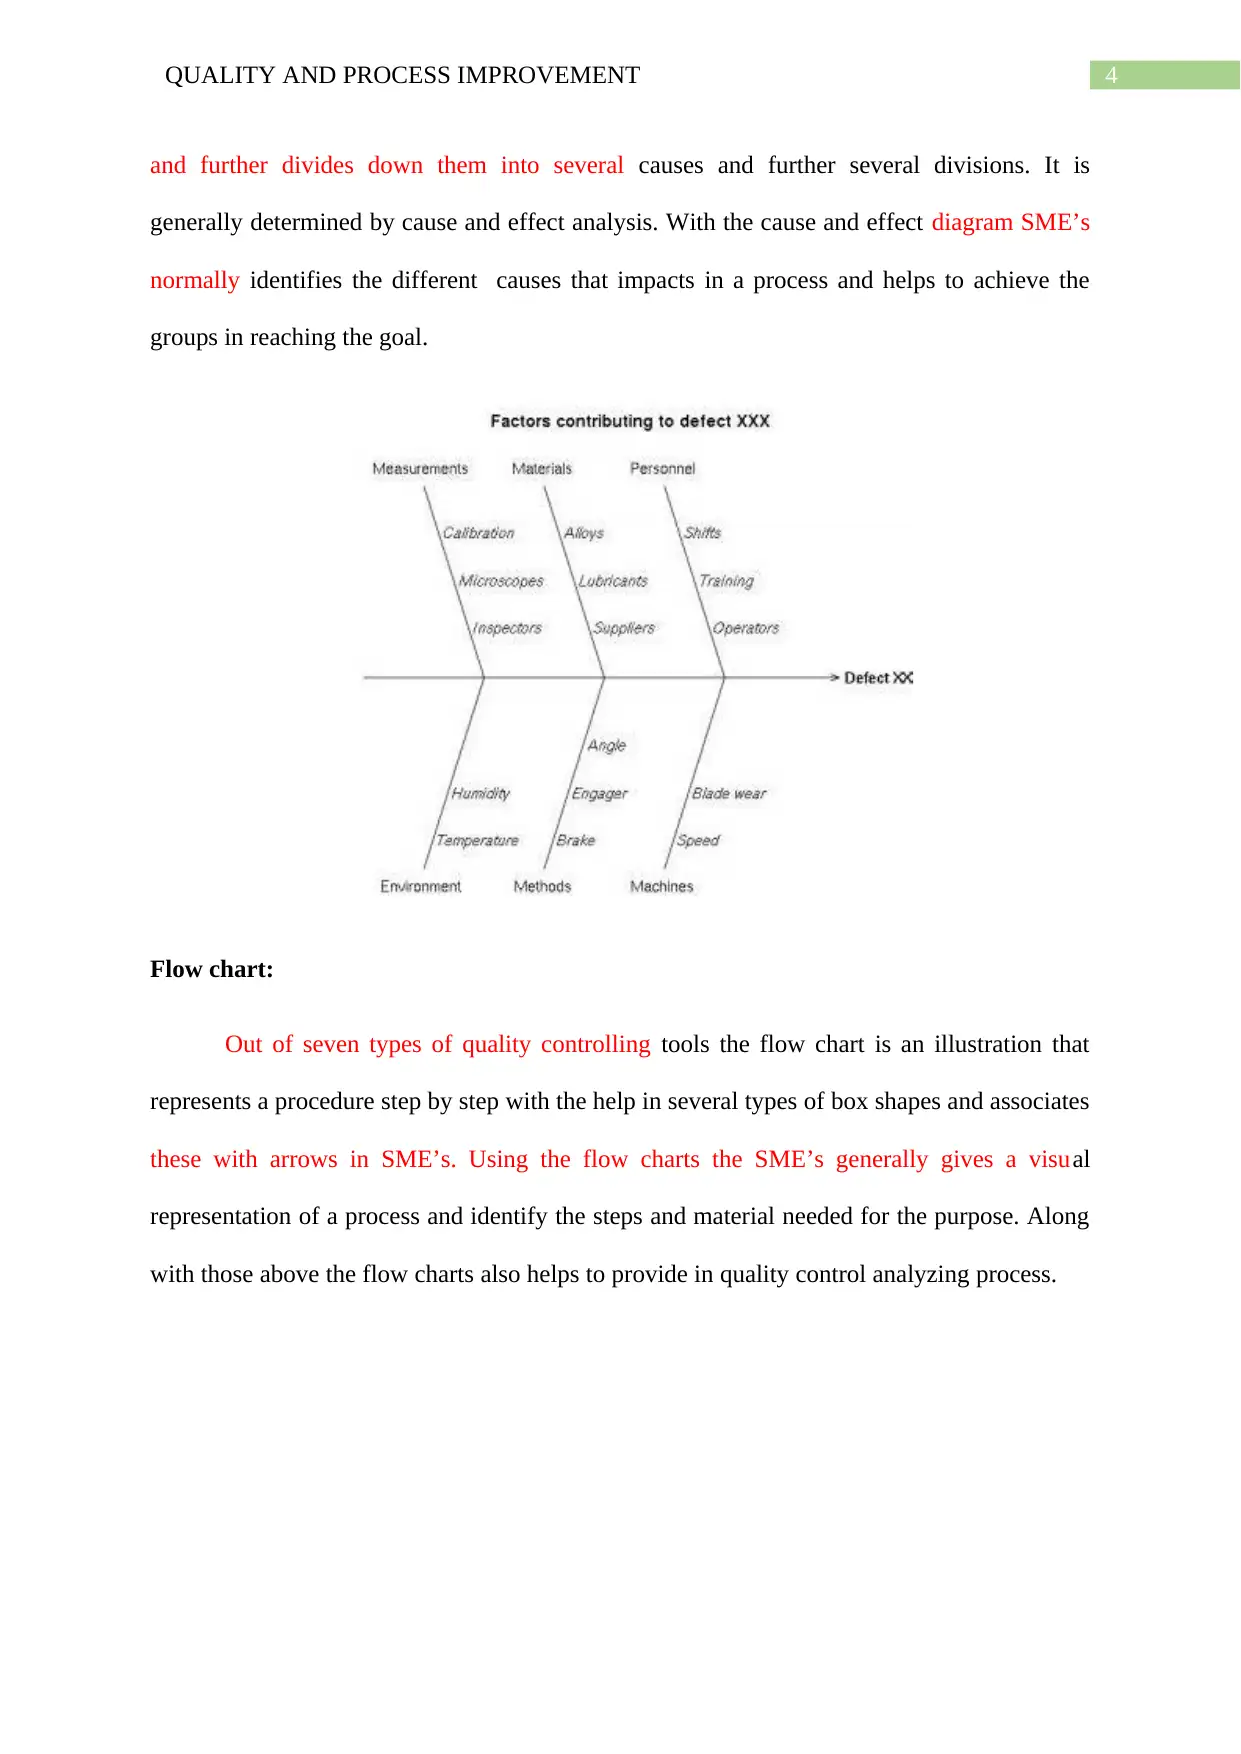
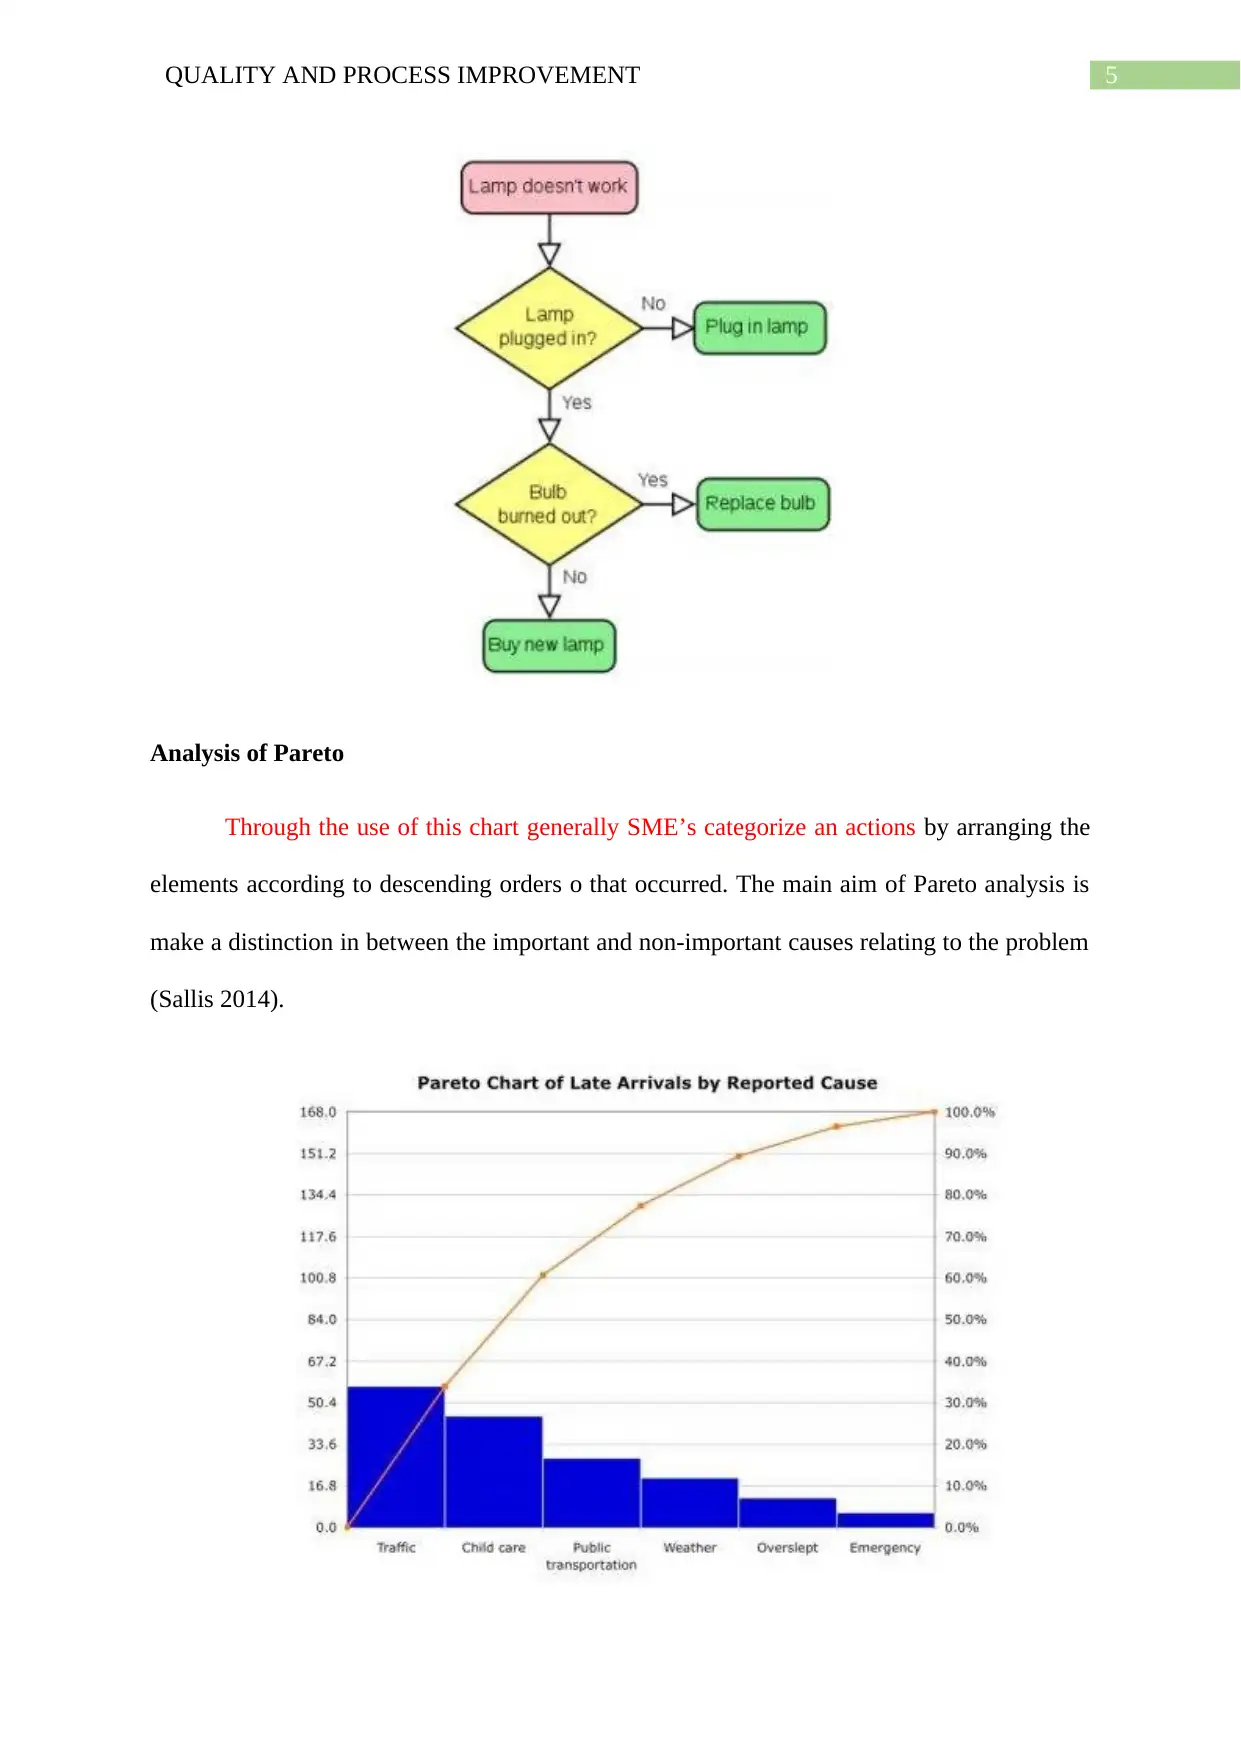
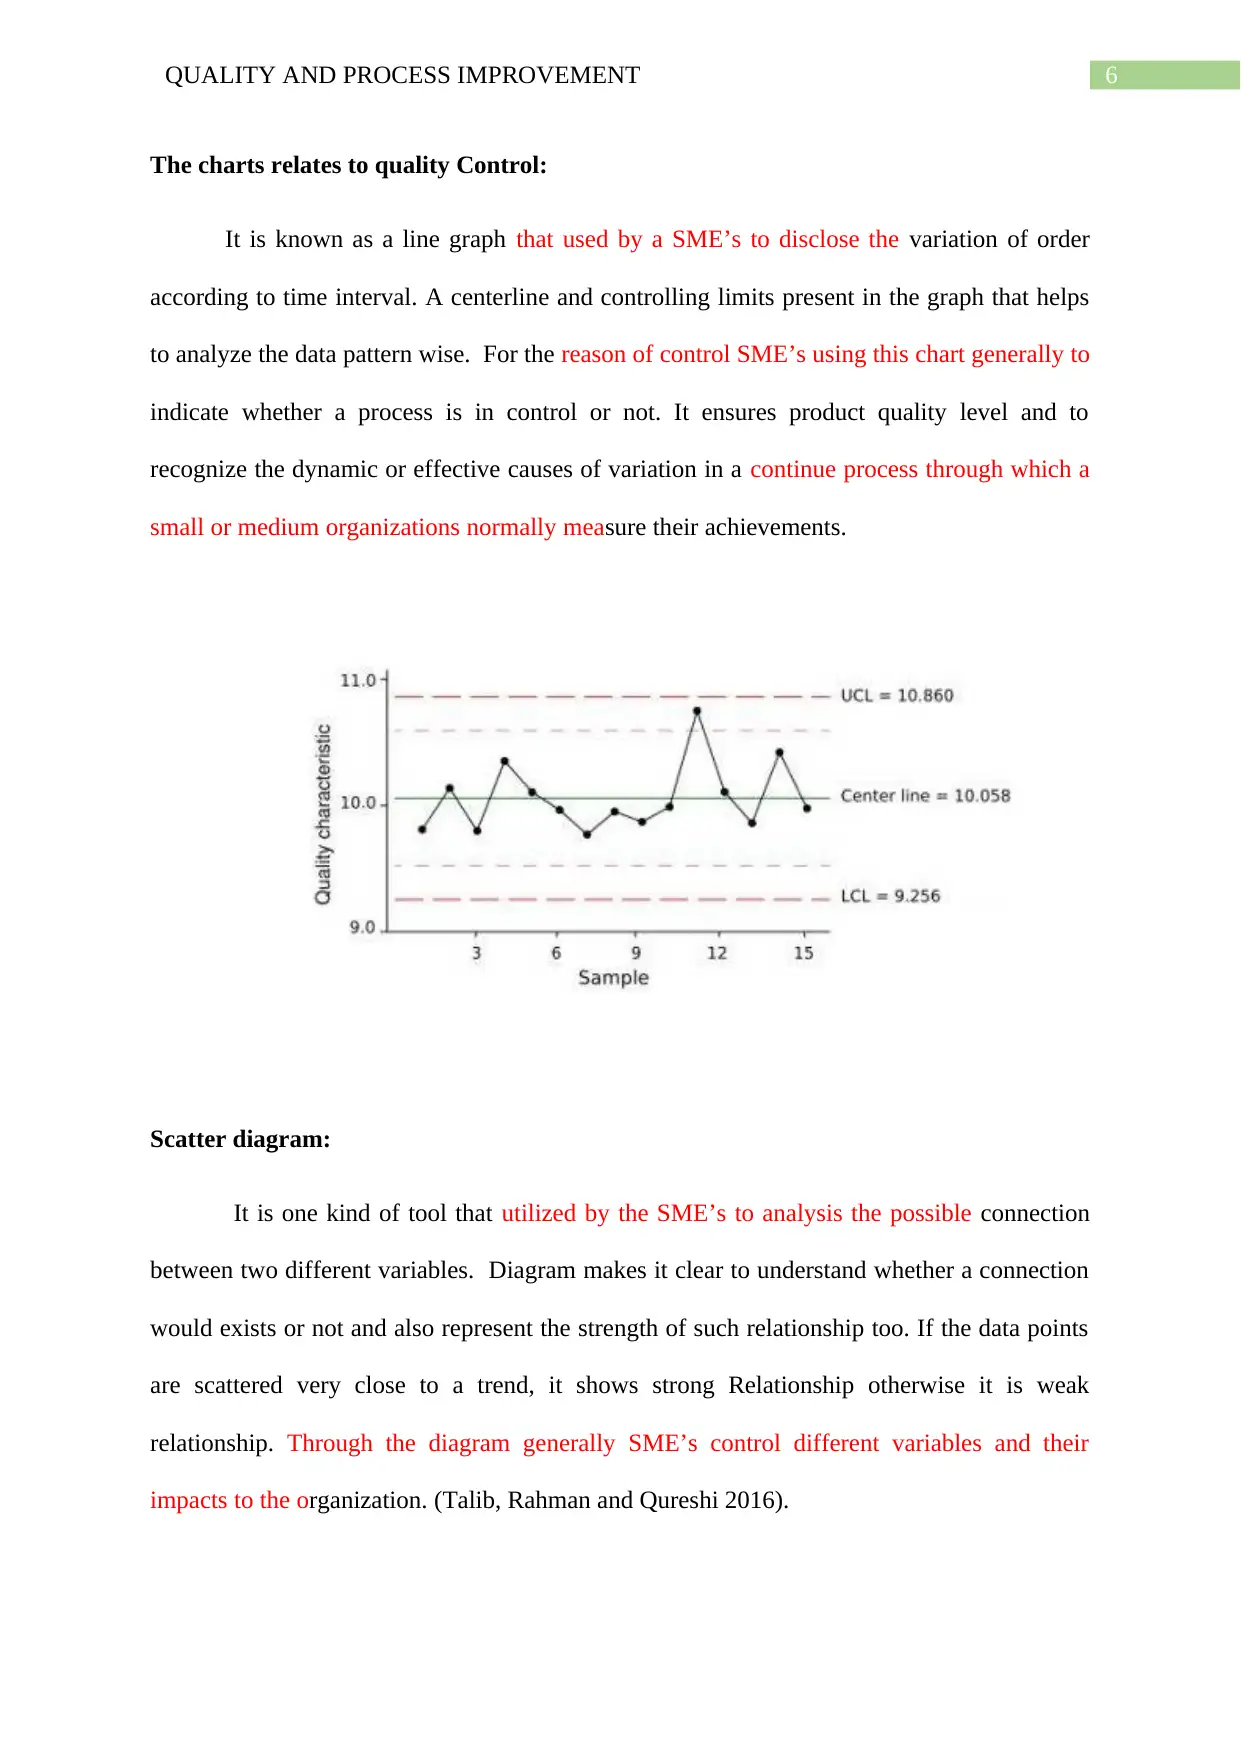
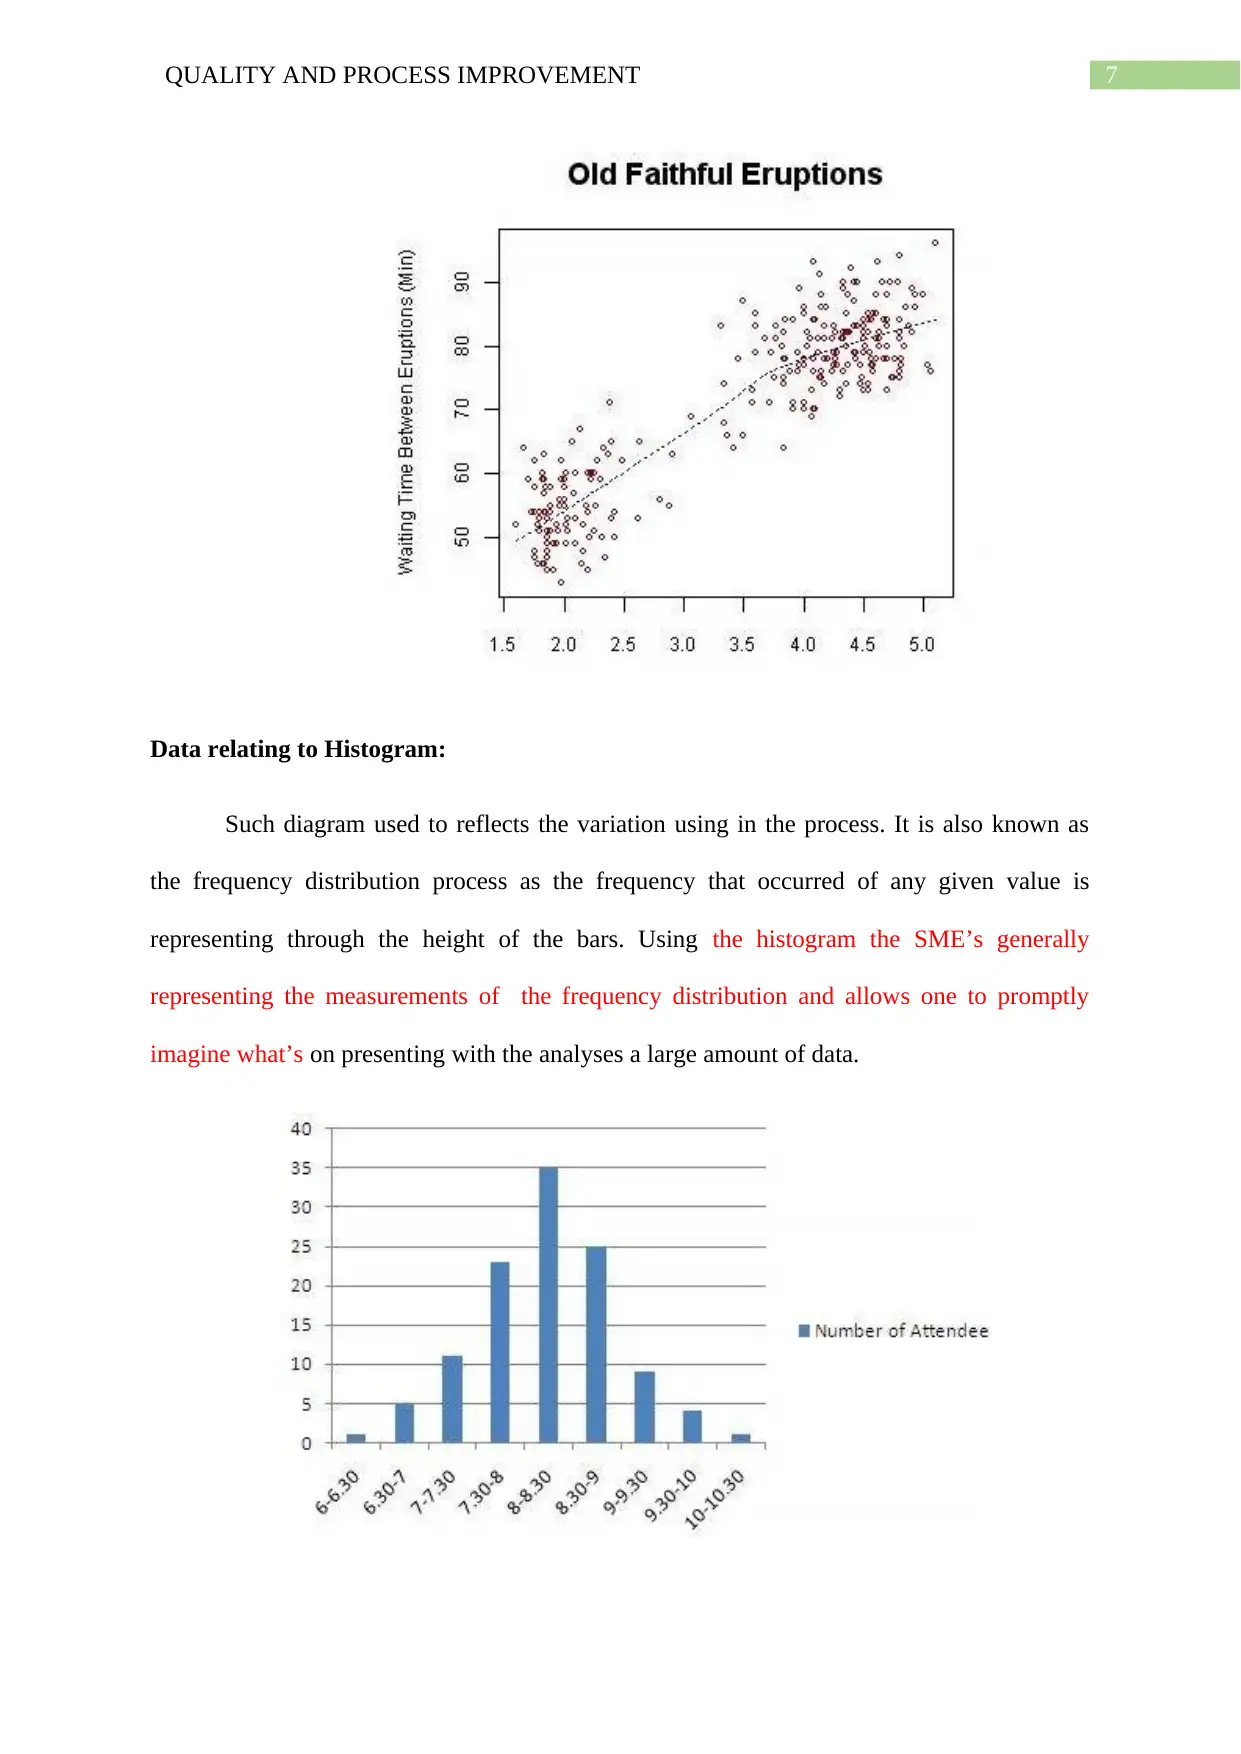
This report delves into the critical aspects of Total Quality Management (TQM) and continuous improvement (CI) within manufacturing and service environments. It emphasizes the significance of TQM in achieving customer satisfaction, improving employee motivation, and reducing production costs, particularly for Small and Medium Enterprises (SMEs). The report meticulously examines various quality control tools and techniques, including check sheets, cause-and-effect diagrams, flowcharts, Pareto analysis, control charts, scatter diagrams, and histograms, illustrating their practical applications in identifying root causes and measuring results. Furthermore, it explores quality initiatives for improving company performance, such as strong process discipline, quality inspections, and cost-of-quality understanding. The report also addresses barriers that companies face, such as quality costs and engineering limitations. Finally, the report advocates for the implementation of specific tools and techniques, including Six Sigma, to enhance product quality and streamline production processes, emphasizing the importance of TQM and CI for organizational excellence. The report includes a case study analysis of quality management practices within UK Six Sigma and non-Six Sigma manufacturing SMEs.
Contribute Materials
Your contribution can guide someone’s learning journey. Share your
documents today.

Running head: QUALITY AND PROCESS IMPROVEMENT
TQM and continuous improvement in manufacturing and service environments
Name of the student:
Name of the university:
Author notes:
TQM and continuous improvement in manufacturing and service environments
Name of the student:
Name of the university:
Author notes:
Secure Best Marks with AI Grader
Need help grading? Try our AI Grader for instant feedback on your assignments.

1QUALITY AND PROCESS IMPROVEMENT
Table of Contents
Introduction:...............................................................................................................................2
Discussion:.................................................................................................................................2
Importance of Total Quality Management.................................................................................2
The quality tools and techniques:...............................................................................................3
Check sheet:...........................................................................................................................3
Cause and effect diagram:......................................................................................................3
Flow chart:.............................................................................................................................4
Pareto analysis:.......................................................................................................................5
Control charts:........................................................................................................................6
Scatter diagram:.....................................................................................................................6
Histogram:..............................................................................................................................7
Further tools or techniques:........................................................................................................8
Quality initiatives for improving the performances of companies:...........................................8
Barriers that was met:.................................................................................................................8
Report:........................................................................................................................................9
Conclusion:................................................................................................................................9
Reference list:...........................................................................................................................10

2QUALITY AND PROCESS IMPROVEMENT
Introduction:
A good quality in manufacturing products and services is required to meet the
customer’s expectations. TQM is consider as the combination of methodical activities, which
is continued by the whole organization to efficiently and effectively achieve company’s
desired objectives through providing the quality of products and services that satisfies
customers at the appropriate time with reasonable price.
Discussion:
Relevant importance relating to Total quality Management:
Total quality management assist in providing the required quality of products
consciousness in the small and medium enterprises (SMEs) relating to leading
Productions of quality products.
TQMhelps in providing greater satisfaction for the SME’S through providing the
requirements of the customers. One of the main factor, which is Customer
satisfaction that helps in obtaining SME’S confidence. Through the customer
pleasure SME’s leads to increase their sales volume that ultimately leads to achieve
long term profits( Gnan etal. 2013)
TQM system helps to improve employee motivation for the SME’s. Motivating to the
employees of an organization helps to achieve the requirements to completions of
organization goals. Motivation increases job satisfaction and contribute positively
towards higher productivity that makes a position impacts for the SME’s.
TQM system aspires to achieve the highest quality relating to products .It is generally
attempts in developing the quality of new products of the SME’s.
Through the using of TQM system the SME’S are maintaining wastages of products.
As a result the cost of production is reduced and profitability is increased.

3QUALITY AND PROCESS IMPROVEMENT
The standard tools and techniques:
7 Quality control Tools on the basis of quality control tools which provide in solving quality
matters through analyzing the data collection and through the identification of root causes
and measuring results that analyzed.
Check sheet:
The first control tool for the quality control is the check sheet. The check sheet is
caused used for collecting data used in real time and at the location where data is generated.
Using the check sheet the SME’s provided how often certain events happening and making
information collection are easy from data. SME’s with the using of check sheets control of
the relevant data that is require maintain the proper quality control for the organization.
(Ramesh and Ravi 2013).
Cause and effect diagram:
Using such diagram SME’s reflects the relationship between all factors that is
relavant for the given situation. With such diagrams the SME’s identifies significant causes
Secure Best Marks with AI Grader
Need help grading? Try our AI Grader for instant feedback on your assignments.

4QUALITY AND PROCESS IMPROVEMENT
and further divides down them into several causes and further several divisions. It is
generally determined by cause and effect analysis. With the cause and effect diagram SME’s
normally identifies the different causes that impacts in a process and helps to achieve the
groups in reaching the goal.
Flow chart:
Out of seven types of quality controlling tools the flow chart is an illustration that
represents a procedure step by step with the help in several types of box shapes and associates
these with arrows in SME’s. Using the flow charts the SME’s generally gives a visual
representation of a process and identify the steps and material needed for the purpose. Along
with those above the flow charts also helps to provide in quality control analyzing process.

5QUALITY AND PROCESS IMPROVEMENT
Analysis of Pareto
Through the use of this chart generally SME’s categorize an actions by arranging the
elements according to descending orders o that occurred. The main aim of Pareto analysis is
make a distinction in between the important and non-important causes relating to the problem
(Sallis 2014).

6QUALITY AND PROCESS IMPROVEMENT
The charts relates to quality Control:
It is known as a line graph that used by a SME’s to disclose the variation of order
according to time interval. A centerline and controlling limits present in the graph that helps
to analyze the data pattern wise. For the reason of control SME’s using this chart generally to
indicate whether a process is in control or not. It ensures product quality level and to
recognize the dynamic or effective causes of variation in a continue process through which a
small or medium organizations normally measure their achievements.
Scatter diagram:
It is one kind of tool that utilized by the SME’s to analysis the possible connection
between two different variables. Diagram makes it clear to understand whether a connection
would exists or not and also represent the strength of such relationship too. If the data points
are scattered very close to a trend, it shows strong Relationship otherwise it is weak
relationship. Through the diagram generally SME’s control different variables and their
impacts to the organization. (Talib, Rahman and Qureshi 2016).
Paraphrase This Document
Need a fresh take? Get an instant paraphrase of this document with our AI Paraphraser

7QUALITY AND PROCESS IMPROVEMENT
Data relating to Histogram:
Such diagram used to reflects the variation using in the process. It is also known as
the frequency distribution process as the frequency that occurred of any given value is
representing through the height of the bars. Using the histogram the SME’s generally
representing the measurements of the frequency distribution and allows one to promptly
imagine what’s on presenting with the analyses a large amount of data.

8QUALITY AND PROCESS IMPROVEMENT
Further tools or techniques:
The others tools and techniques that could emphasis the quality control of an
organizations are, Managerial control, inspection, Efficiency of employees etc.
Quality initiatives for improving the performances of companies:
Strong process of discipline: employees of the organization should maintain consistency and
should well understand about the product and should make efforts for improvement of
product. Product should be defect less by use of Six Sigma Tool. This would help to maintain
the discipline process.
Quality inspection: there should be certain quality inspection techquies used to fix the defects
of the manufacturing process that would be possible through six sigma process of improving
efficiency of product. Fair solutions is needed to provide to solve problems and bring
improvements.
Understanding of cost of quality: There should be efficient cost of quality for manufacturing
staff that would improve the production. This can be done through six sigma process of
elimination of costly reworks as well as reduction of scrap. Proper cost should be invested for
fixing the source of the problem. Further this would lead to improvement.
Barriers that faced by the company:
Quality cost: Cost of a manufacturing product was not beneficial and neither the quality of
inventories were not as per satisfaction.
Quality Engineer: The quality engineer could not overcome the resistance. He is found to be
inefficient in terms of his skills as a leader and project manager. This lead to a barrier for
quality improvement of company.

9QUALITY AND PROCESS IMPROVEMENT
Report:
To,
The senior manager
Respected sir/madam,
This is hereby informed that specific tools like histogram, chart sheet as well as flowchart
should be used for total quality management of the product as well as for quality control
technique needs to be implemented. It is also brought into notice that six sigma tools should
be implemented for reduction of scrap, reduce the defect of product and improve the
production. Sir it should be further taken into consider that six sigma process should be
implemented for Just in Time production of SMEs.
Yours sincerely
Date:
Conclusion:
It is hereby notified from the report that has been analysis the Total quality
management (TQM) and their various tools and techniques. And also analysis the Quality
initiatives for improving the performances of companies that have been applied during the
application of the quality initiatives and tools and techniques have contributed to the
implementation of the quality initiatives.
Secure Best Marks with AI Grader
Need help grading? Try our AI Grader for instant feedback on your assignments.

10QUALITY AND PROCESS IMPROVEMENT
Reference list:
Awaj, Y.M., Singh, A.P. and Amedie, W.Y., 2013. QUALITY IMPROVEMENT USING
STATISTICAL PROCESS CONTROL TOOLS IN GLASS BOTTLES
MANUFACTURING COMPANY. International Journal for Quality Research, 7(1).
Gnan, L., Hinna, A., Monteduro, F. and Scarozza, D., 2013. Corporate governance and
management practices: stakeholder involvement, quality and sustainability tools adoption.
Journal of Management & Governance, 17(4), pp.907-937.
Goetsch, D.L. and Davis, S.B., 2014. Quality management for organizational excellence.
Upper Saddle River, NJ: pearson
Gonzalez, M.E., Quesada, G., Davis, J. and Mora-Monge, C., 2015. Application of quality
management tools in the evaluation of websites: The case of sports organizations. Quality
Management Journal, 22(1), pp.30-46.
Oakland, J.S., 2014. Total quality management and operational excellence: text with cases.
Routledge
Ramesh, N. and Ravi, A., 2013. TQM tools and techniques in promoting team working
culture in the manufacturing organisations. International Journal of Productivity and Quality
Management, 12(4), pp.466-479.
Sallis, E., 2014. Total quality management in education. Routledge.
Talib, F., Rahman, Z. and Qureshi, M.N., 2016. Survey on the usage of total quality
management tools and techniques in Indian service industries: an empirical analysis. Talib,
F., Rahman, Z. and Qureshi, MN (2013)‘Survey on the usage of total quality management
tools and techniques in Indian service industries: an empirical analysis’, Int. J. Quality and
Innovation, 2(2), pp.105-119.
1 out of 11
Related Documents

Your All-in-One AI-Powered Toolkit for Academic Success.
+13062052269
info@desklib.com
Available 24*7 on WhatsApp / Email
Unlock your academic potential
© 2024 | Zucol Services PVT LTD | All rights reserved.