Statistical Tools for Measuring Quality in Patient-Centred Healthcare

Verified

Added on  2023/06/04

|4
|710
|381
Report
AI Summary
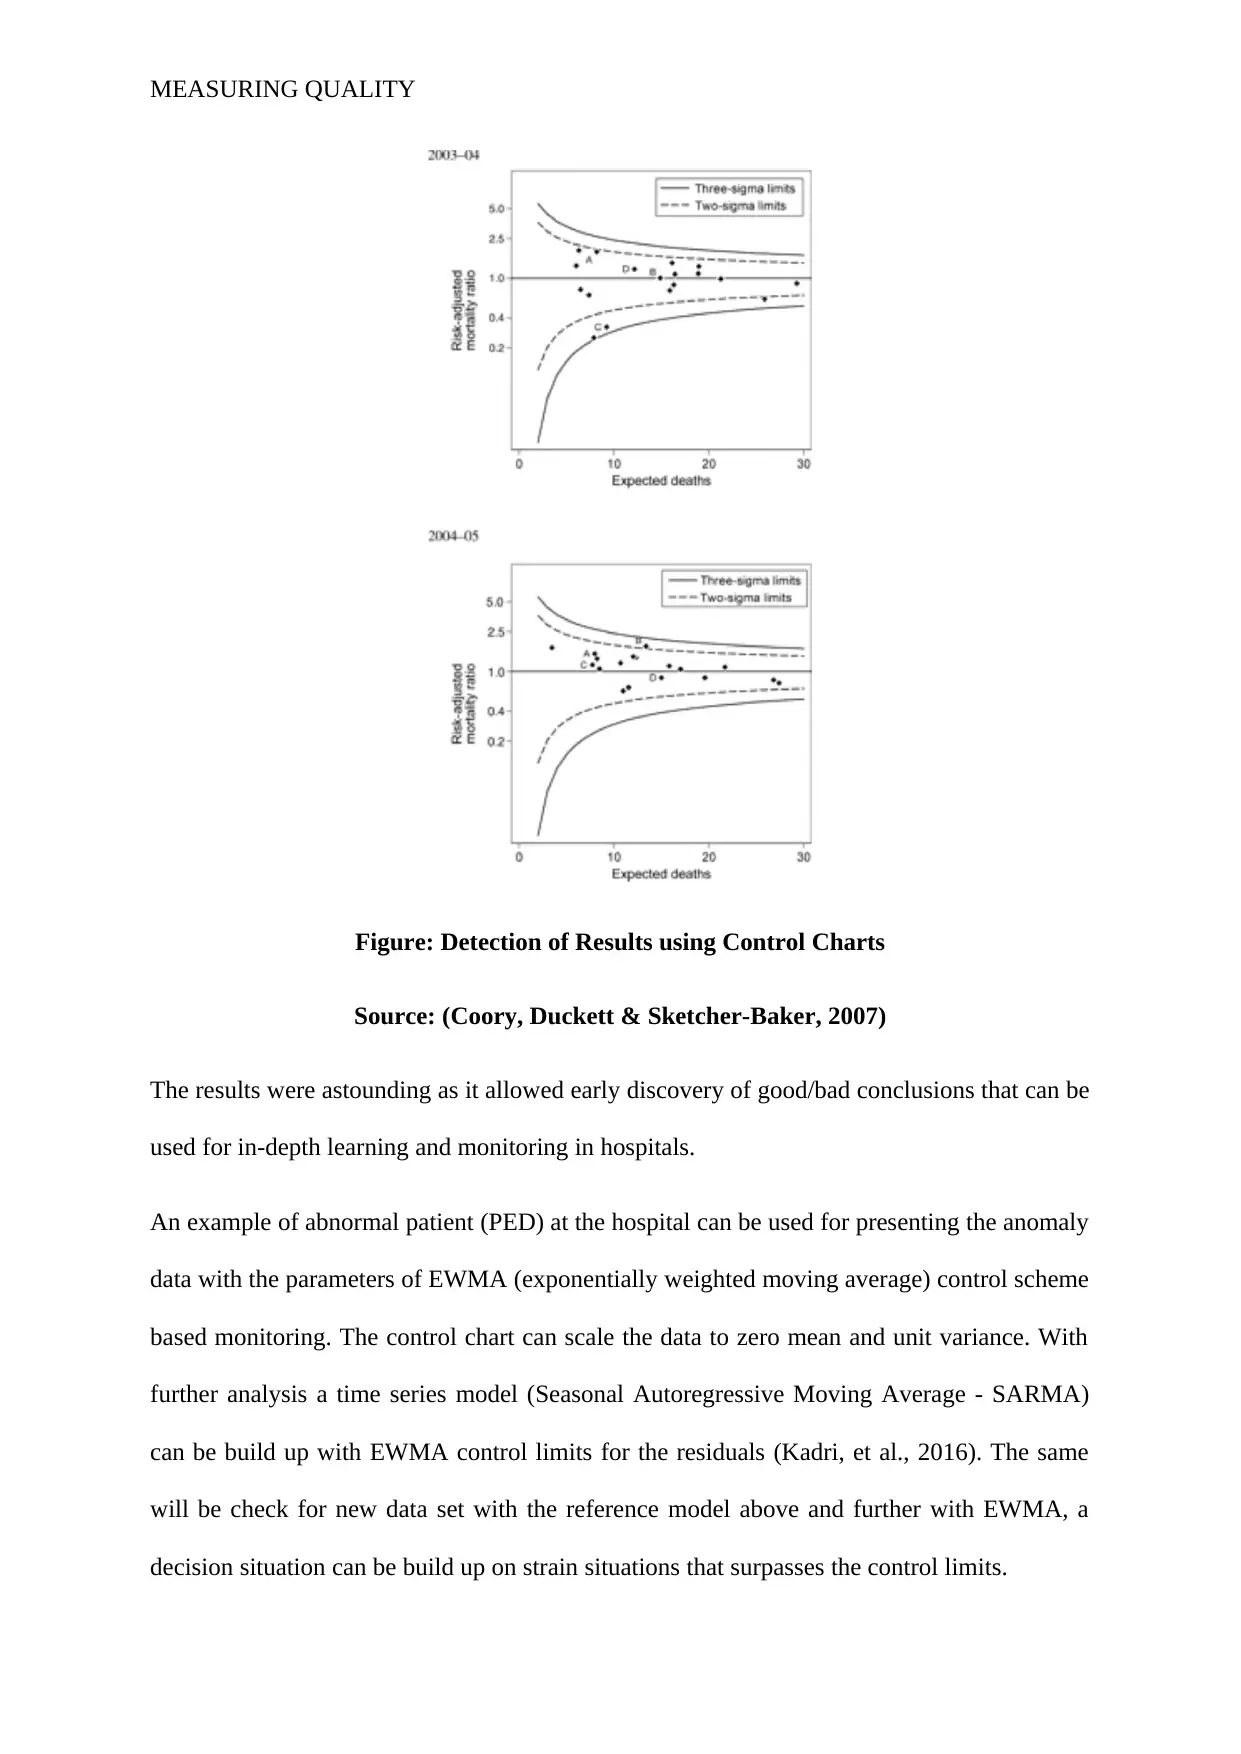
This report discusses the application of Statistical Process Control (SPC) and other quality tools in patient-centred healthcare to improve cost, quality, and patient experience. It highlights the use of seven basic quality tools, including Pareto charts, control charts, and cause-effect diagrams, emphasizing their role in process improvement. Control charts are particularly useful for detecting variations quickly. The report also provides examples of how control charts and anomaly detection methods, such as EWMA (exponentially weighted moving average), can be used to monitor patient data and identify potential issues in hospital settings, referencing studies that demonstrate the effectiveness of these tools in early detection and continuous monitoring of healthcare quality.
Document Page
Running head: MEASURING QUALITY
Measuring Quality: Statistical Tools, Qualitative and Quantitative Measures
Name of the Student:
Name of the University:
Author’s Note:
tabler-icon-diamond-filled.svg

Paraphrase This Document

Need a fresh take? Get an instant paraphrase of this document with our AI Paraphraser
Document Page
MEASURING QUALITY
Statistical Process Control in patient-centred control home aims not only improve the cost,
quality, provider and patient experience but also helps in analysing the theory of variation
measured over time with high level of performance (Magar & Shinde, 2014). However, in
research the quality stools including SPC for process improvements has 7 tools are often
called as “The Basic Seven” or “The Old Seven” as emphasized by Ishikawa.
1. Pareto Chart – the significant factors are highlighted
2. Control Chart –time series charts often used in health care with control limits for
expected random variation
3. Cause/ effect Diagram/ Fishbone Chart –strategizes and recognizes the causes for a
problem by sorting them in categories
4. Histogram –shows the set of data happens in a time using frequency distribution
5. Check Sheet –for collecting and examining the data
6. Stratification/ Run Chart –the data is separated from sources so that a pattern an be
seen for analysis
7. Scatter Plot –quantitative variables that are plotted on x and y axis to examine for a
relationship between the two
Broadly in healthcare, control charts are used as they detect variations faster than any other
statistical method. Also, as per Medline database found, the hits are for 1951–88, two for
1989–91, 26 for 1992–5, and 71 for 1996–2004 with many recent publications (Leclère, et
al., 2017). For example, in hours a particular lab procedure is followed, ARL (Average run
length) is the common performance metric that is used. Coory, Duckett & Sketcher-Baker
(2007) gathered a comparative analysis of cross sectional analysis to monitor quality of
hospital care with administrative data had seen no outliers for 2 years UCL (3σ and 3-low-
outliers) and LCL (2σ and 1-high-outlier).
Document Page
MEASURING QUALITY
Figure: Detection of Results using Control Charts
Source: (Coory, Duckett & Sketcher-Baker, 2007)
The results were astounding as it allowed early discovery of good/bad conclusions that can be
used for in-depth learning and monitoring in hospitals.
An example of abnormal patient (PED) at the hospital can be used for presenting the anomaly
data with the parameters of EWMA (exponentially weighted moving average) control scheme
based monitoring. The control chart can scale the data to zero mean and unit variance. With
further analysis a time series model (Seasonal Autoregressive Moving Average - SARMA)
can be build up with EWMA control limits for the residuals (Kadri, et al., 2016). The same
will be check for new data set with the reference model above and further with EWMA, a
decision situation can be build up on strain situations that surpasses the control limits.
Document Page
MEASURING QUALITY
References
Coory, M., Duckett, S., & Sketcher-Baker, K. (2007). Using control charts to monitor quality
of hospital care with administrative data. International Journal for Quality in Health
Care, 20(1), 31-39.
Kadri, F., Harrou, F., Chaabane, S., Sun, Y., & Tahon, C. (2016). Seasonal ARMA-based
SPC charts for anomaly detection: Application to emergency department systems.
Neurocomputing, 173, 2102-2114.
Leclère, B., Buckeridge, D. L., Boëlle, P. Y., Astagneau, P., & Lepelletier, D. (2017).
Automated detection of hospital outbreaks: A systematic review of methods. PloS
one, 12(4), e0176438.
Magar, V. M., & Shinde, V. B. (2014). Application of 7 quality control (7 QC) tools for
continuous improvement of manufacturing processes. International Journal of
Engineering Research and General Science, 2(4), 364-371.
chevron_up_icon
1 out of 4
circle_padding
hide_on_mobile
zoom_out_icon
[object Object]