Exploring Alcohol Consumption in the UK: A Research Report
VerifiedAdded on 2022/12/27
|29
|4173
|63
Report
AI Summary
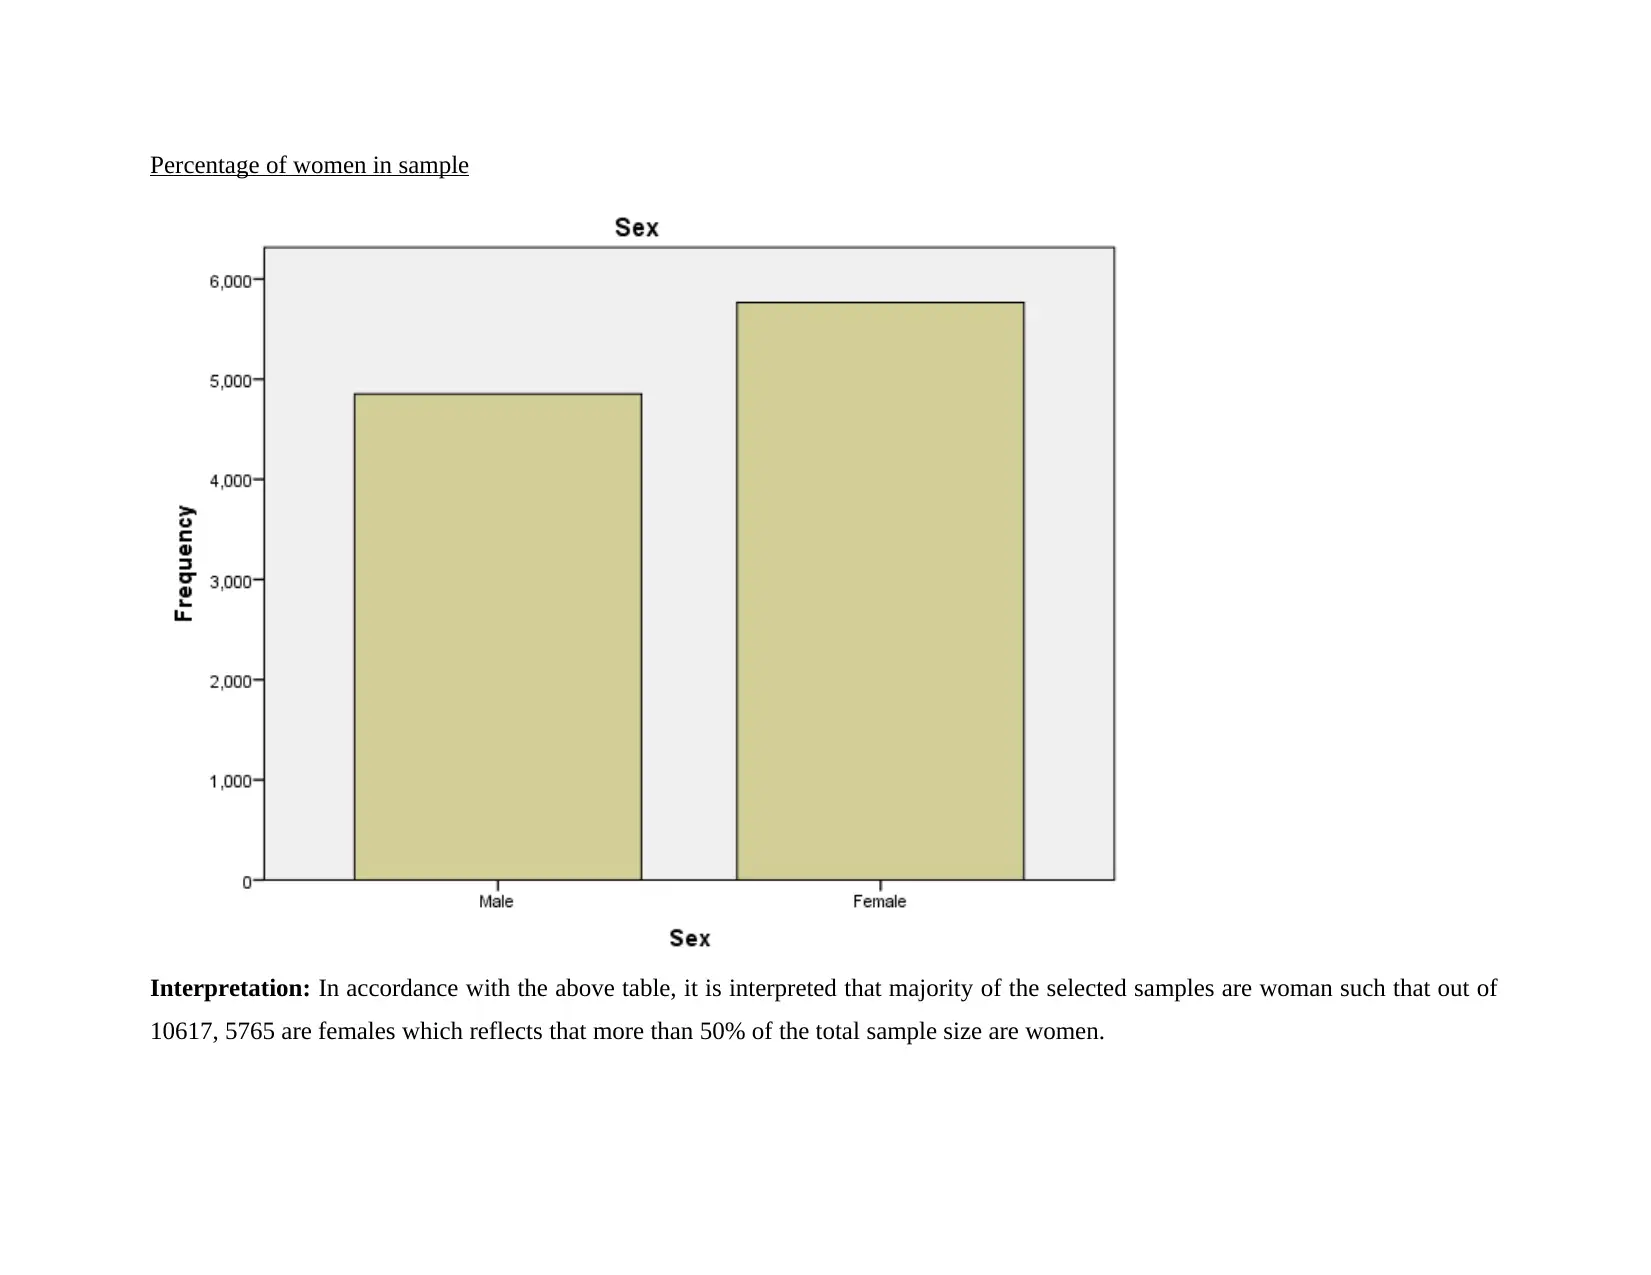
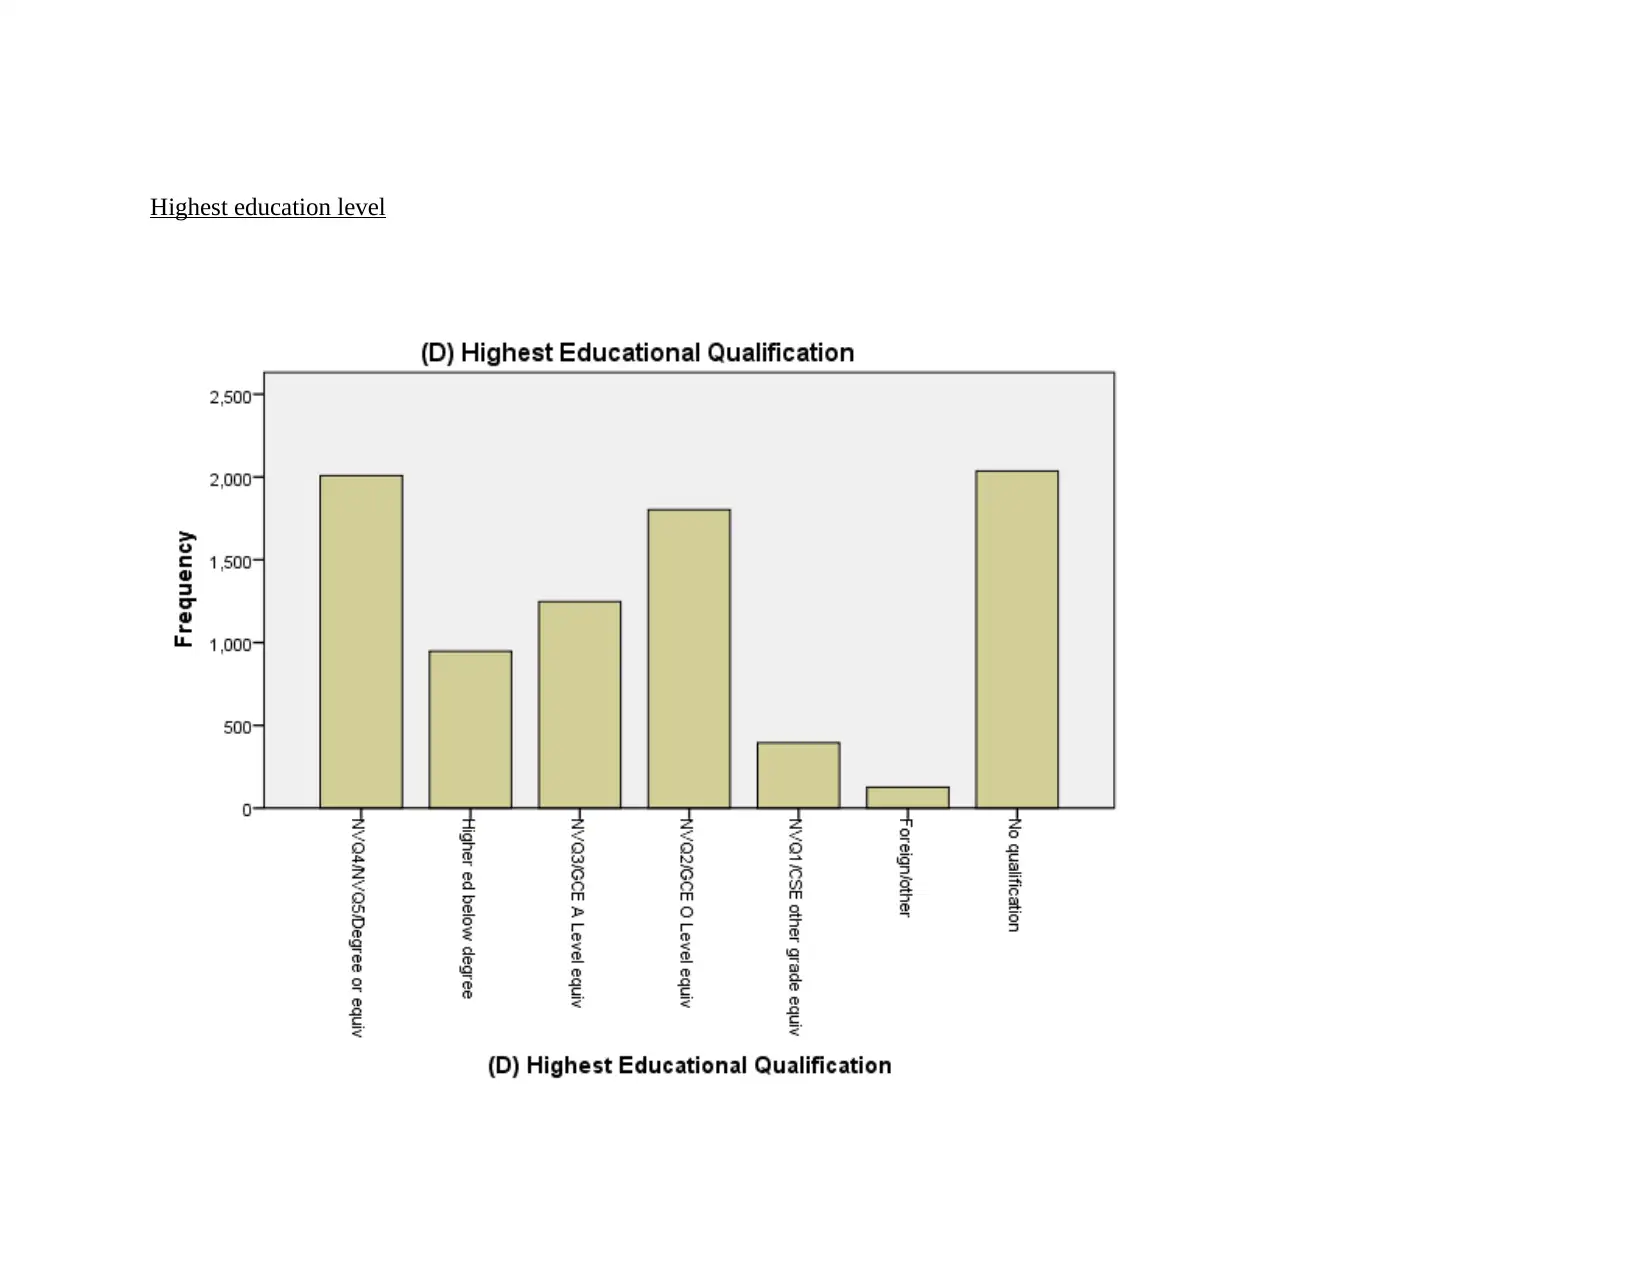
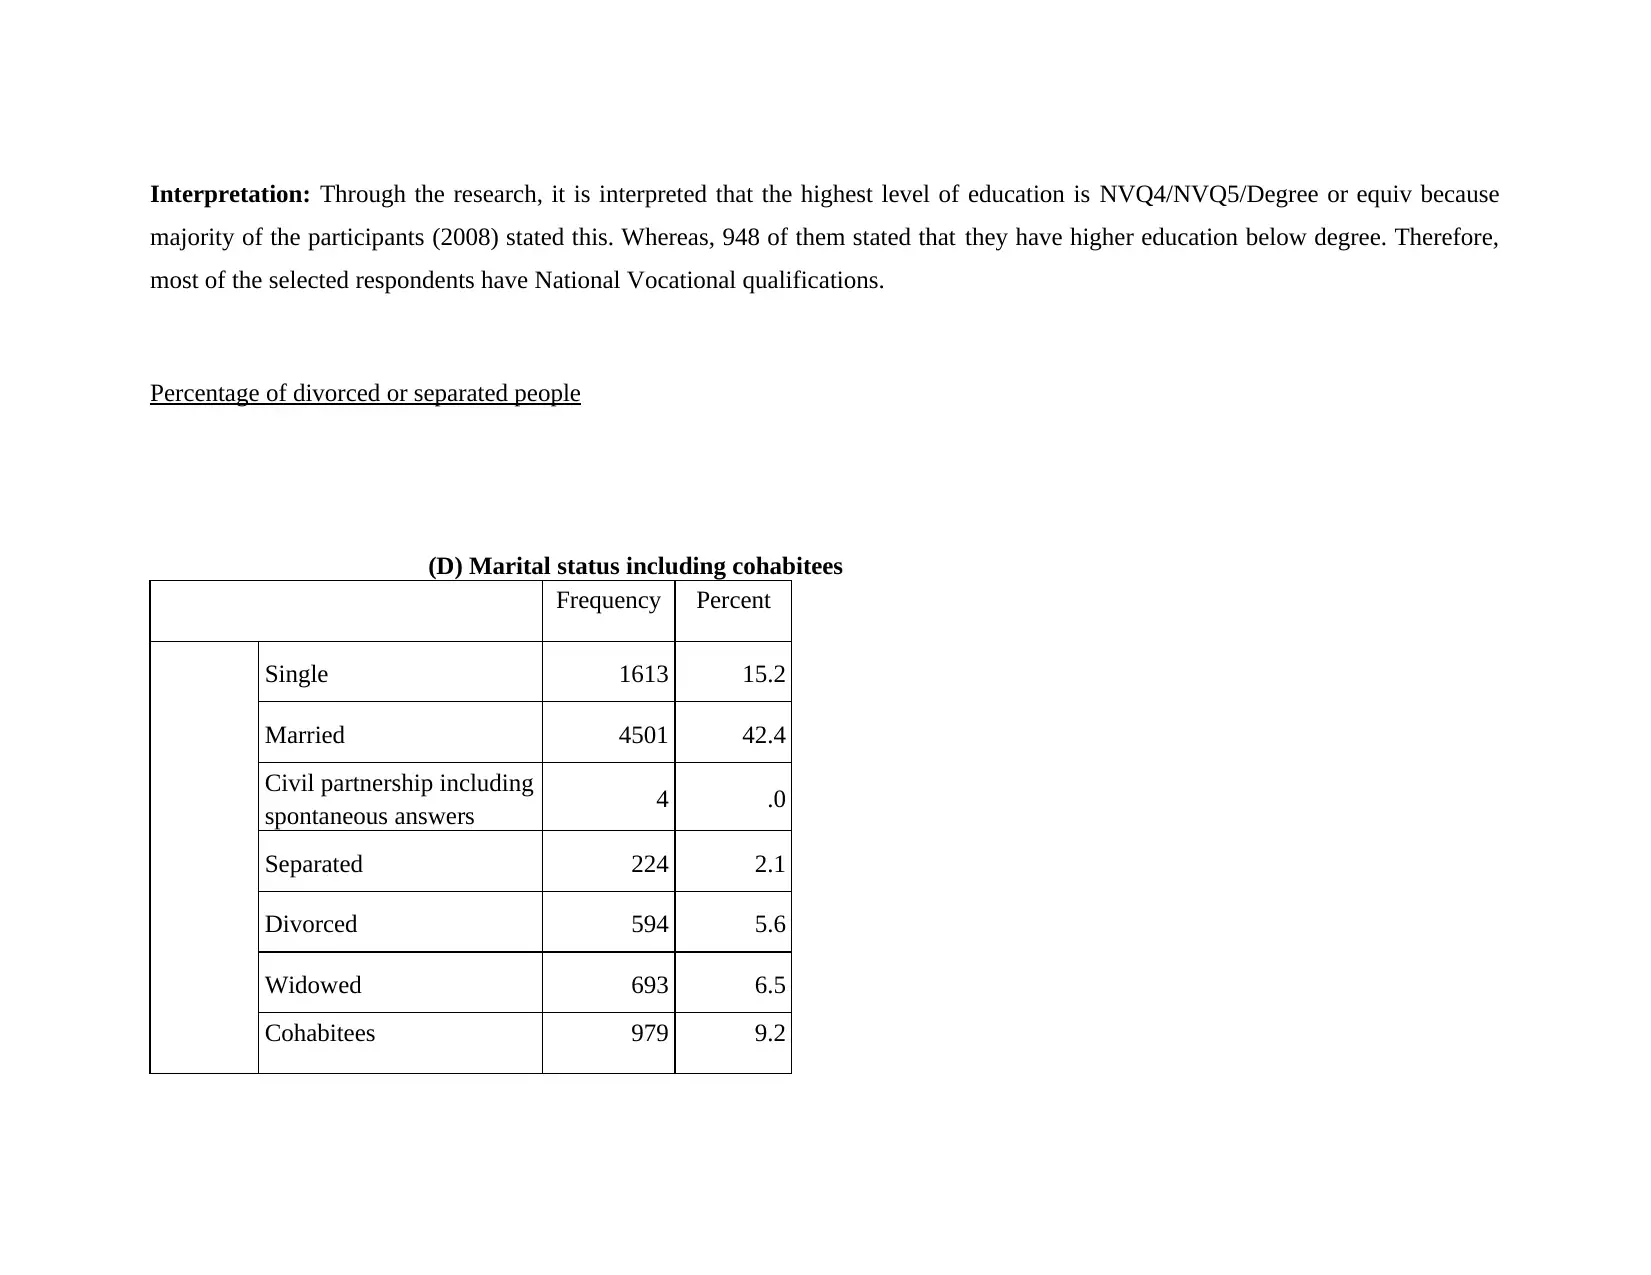
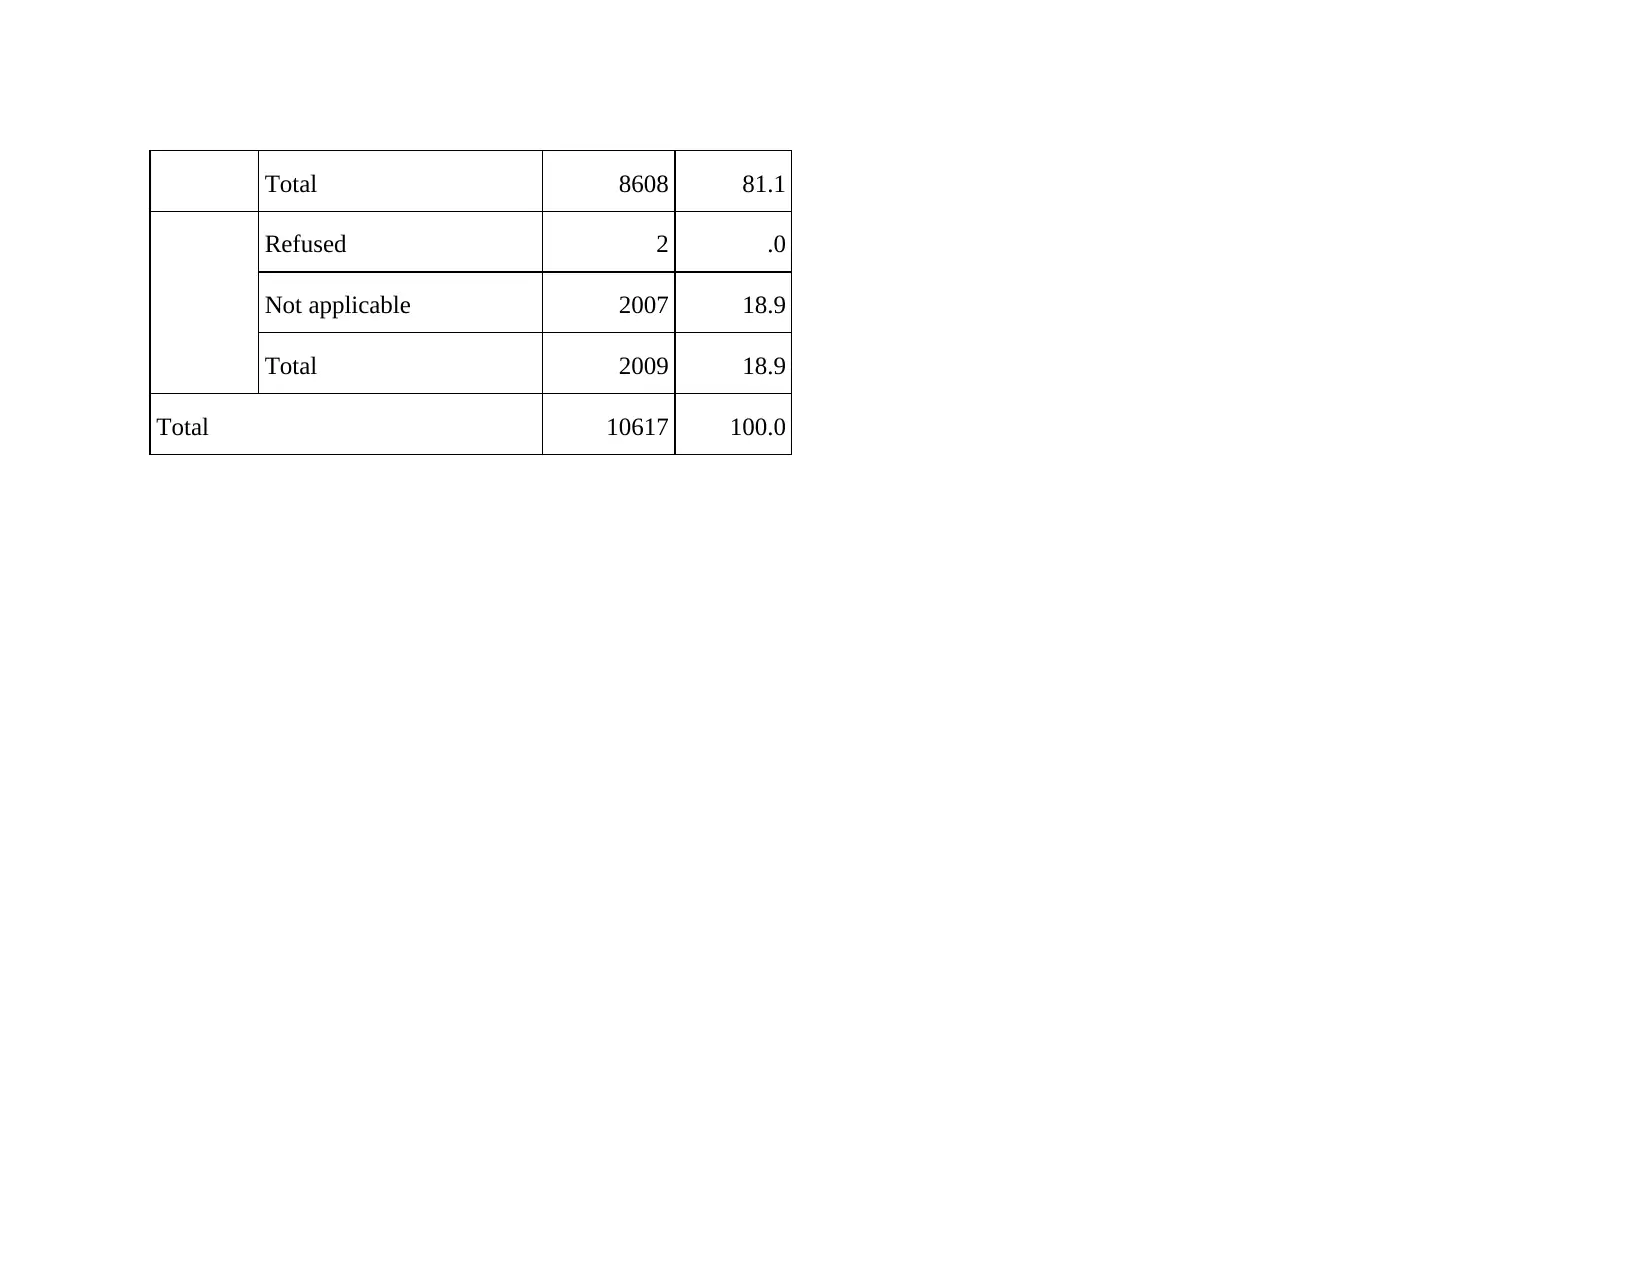
This research report analyzes data from the Health Survey for England 2011 to explore alcohol consumption patterns in the UK. The study examines a sample of 10,617 participants, providing insights into the percentage of people who drink alcohol, the gender distribution, educational levels, marital status, and ethnic origin. The report presents statistical measures such as mean, median, mode, minimum, maximum, and range for household size and age. Cross-tabulation analysis reveals which gender and region consume alcohol most frequently. Furthermore, the report investigates correlations between various factors, including gender, income, and age, and their relationship to alcohol consumption. The discussion section interprets the findings and considers the implications for preventing and controlling alcohol use in the UK, culminating in conclusions and recommendations for future interventions.

Research report analysing data from the
Health Survey of England 2011
Secure Best Marks with AI Grader
Need help grading? Try our AI Grader for instant feedback on your assignments.

TABLE OF CONTENTS
Sample size..............................................................................................................................................................................................3
Percentage of people who drink alcohol..................................................................................................................................................3
Percentage of women in sample..............................................................................................................................................................5
Highest education level............................................................................................................................................................................6
Percentage of divorced or separated people............................................................................................................................................7
Percentage of White people.....................................................................................................................................................................9
Presenting mean, median, mode, minimum, maximum, and the range of household size....................................................................12
Mean, median, mode, minimum, maximum, and the range of age at last birthday...............................................................................14
Region drinks alcohol most...................................................................................................................................................................17
Correlation between different aspects...................................................................................................................................................22
Discussion..............................................................................................................................................................................................24
Implications for prevention or control of alcohol use in the UK...........................................................................................................25
Conclusion and recommendations.........................................................................................................................................................26
REFERENCES..........................................................................................................................................................................................28

Sample size
In this project, there are 10617 people who participated within a study.
Percentage of people who drink alcohol
In this project, there are 10617 people who participated within a study.
Percentage of people who drink alcohol

Interpretation: Through the above table, it is interpreted that there are 6712 people who drink alcohol which reflects that around
63.2% of the total population consume alcohol out of 100%. On the other side, only 17% of them do not intake alcohol i.e. 1822 out of
10617.
63.2% of the total population consume alcohol out of 100%. On the other side, only 17% of them do not intake alcohol i.e. 1822 out of
10617.
Secure Best Marks with AI Grader
Need help grading? Try our AI Grader for instant feedback on your assignments.

Percentage of women in sample
Interpretation: In accordance with the above table, it is interpreted that majority of the selected samples are woman such that out of
10617, 5765 are females which reflects that more than 50% of the total sample size are women.
Interpretation: In accordance with the above table, it is interpreted that majority of the selected samples are woman such that out of
10617, 5765 are females which reflects that more than 50% of the total sample size are women.

Highest education level

Interpretation: Through the research, it is interpreted that the highest level of education is NVQ4/NVQ5/Degree or equiv because
majority of the participants (2008) stated this. Whereas, 948 of them stated that they have higher education below degree. Therefore,
most of the selected respondents have National Vocational qualifications.
Percentage of divorced or separated people
(D) Marital status including cohabitees
Frequency Percent
Single 1613 15.2
Married 4501 42.4
Civil partnership including
spontaneous answers 4 .0
Separated 224 2.1
Divorced 594 5.6
Widowed 693 6.5
Cohabitees 979 9.2
Paraphrase This Document
Need a fresh take? Get an instant paraphrase of this document with our AI Paraphraser

Total 8608 81.1
Refused 2 .0
Not applicable 2007 18.9
Total 2009 18.9
Total 10617 100.0
Refused 2 .0
Not applicable 2007 18.9
Total 2009 18.9
Total 10617 100.0

Interpretation: As per the above table and graph, it is interpreted that out of 100%, 2.1% of the respondents are separated whereas,
only 5.6% of them are divorced.

Percentage of White people
Ethnic origin of individual
Frequency Percent
White -
English/Welsh/Scottish/N
orthern Irish/British
8671 81.7
White - Irish 84 .8
White - Gypsy or Irish
Traveller 4 .0
Any other white
background 496 4.7
White and Black
Caribbean 50 .5
White and Black African 26 .2
White and Asian 64 .6
Any other mixed/multiple
ethnic background 73 .7
Indian 266 2.5
Pakistani 210 2.0
Bangladeshi 70 .7
Secure Best Marks with AI Grader
Need help grading? Try our AI Grader for instant feedback on your assignments.

Chinese 40 .4
Any other Asian
background 126 1.2
African 202 1.9
Caribbean 97 .9
Any other
Black/African/Caribbean
background
32 .3
Arab 26 .2
Any other ethnic group
(please describe) 35 .3
Total 10572 99.6
Refusal 19 .2
Don't Know 3 .0
Item not applicable 23 .2
Total 45 .4
Total 10617 100.0
Any other Asian
background 126 1.2
African 202 1.9
Caribbean 97 .9
Any other
Black/African/Caribbean
background
32 .3
Arab 26 .2
Any other ethnic group
(please describe) 35 .3
Total 10572 99.6
Refusal 19 .2
Don't Know 3 .0
Item not applicable 23 .2
Total 45 .4
Total 10617 100.0

Interpretation: Through the above table, it is interpreted that majority of the sample are white collar people. Such that out of 100%,
81.7% of them are white English people, whereas, 0.8% of them are White-Irish. On the other side, 496 out of total sample are
belongs to any other white background and 73 of them are White and Asian. Apart from this, it is also identified from a table that 26
of them are white and black African and this clearly indicate that most of the selected respondents are White collar people.

Presenting mean, median, mode, minimum, maximum, and the range of household size
Statistics
(D) Household size
Mean 2.85
Median 3.00
Mode 2
Range 9
Minimum 1
Maximum 10
Statistics
(D) Household size
Mean 2.85
Median 3.00
Mode 2
Range 9
Minimum 1
Maximum 10
Paraphrase This Document
Need a fresh take? Get an instant paraphrase of this document with our AI Paraphraser

Interpretation: Through the above graph, it is interpreted that average number of household size is 2.85, whereas 50% of the
household size is decreases. Moreover, the mode value from the chart reflected that size is repetitive at every 2 years. Whereas, the
difference between the household sizes reflected that there is a wide difference between its maximum and minimum values.
household size is decreases. Moreover, the mode value from the chart reflected that size is repetitive at every 2 years. Whereas, the
difference between the household sizes reflected that there is a wide difference between its maximum and minimum values.

Mean, median, mode, minimum, maximum, and the range of age at last birthday
Statistics
Age birthday
Mean 41.56
Median 42.00
Mode 42
Range 100
Minimum 0
Maximum 100
Statistics
Age birthday
Mean 41.56
Median 42.00
Mode 42
Range 100
Minimum 0
Maximum 100

Interpretation: In accordance with the above table, it is interpreted that majority of selected respondents are agreed that their last
birthday is fall under the age category of 41. Whereas, 50% of them are also agreed with the statement that most of the selected
respondents are fall under this age group last year. Whereas, maximum number of the selected respondents are 100.
birthday is fall under the age category of 41. Whereas, 50% of them are also agreed with the statement that most of the selected
respondents are fall under this age group last year. Whereas, maximum number of the selected respondents are 100.
Secure Best Marks with AI Grader
Need help grading? Try our AI Grader for instant feedback on your assignments.

Alcohol drink
Case Processing Summary
Cases
Valid Missing Total
N Percent N Percent N Percent
Whether drink nowadays
* Sex 8534 80.4% 2083 19.6% 10617 100.0%
Whether drink nowadays * Sex Crosstabulation
Sex Total
Male Female
Whether drink nowadays
Yes
Count 3172 3540 6712
% within Whether drink
nowadays 47.3% 52.7% 100.0%
% within Sex 84.0% 74.4% 78.7%
% of Total 37.2% 41.5% 78.7%
No
Count 605 1217 1822
% within Whether drink
nowadays 33.2% 66.8% 100.0%
% within Sex 16.0% 25.6% 21.3%
% of Total 7.1% 14.3% 21.3%
Total Count 3777 4757 8534
% within Whether drink
nowadays
44.3% 55.7% 100.0%

% within Sex 100.0% 100.0% 100.0%
% of Total 44.3% 55.7% 100.0%
Interpretation: Through the above table, it is interpreted that female drinks more as compared to male because out of 6712, 3540 of
the sample (female) agreed that they consume alcohol. Whereas, out of 1822 who stated they did not intake alcohol, only 66.8% of the
female are not agreed. So, it is clearly identified that females are highly consumed alcohol as compared to man.
Region drinks alcohol most
Case Processing Summary
Cases
Valid Missing Total
N Percent N Percent N Percent
Whether drink nowadays *
Ethnic origin of individual 8522 80.3% 2095 19.7% 10617 100.0%

Wheth
er
drink
nowad
ays *
Ethnic
origin
of
indivi
dual
Crosst
abulat
ion
Ethnic origin
of individual
T
o
t
a
l
er
drink
nowad
ays *
Ethnic
origin
of
indivi
dual
Crosst
abulat
ion
Ethnic origin
of individual
T
o
t
a
l
Paraphrase This Document
Need a fresh take? Get an instant paraphrase of this document with our AI Paraphraser

White -
English/Welsh/S
cottish/Northern
Irish/British
W
hit
e -
Iri
sh
W
hit
e -
Gy
psy
or
Iris
h
Tra
vel
ler
Any
othe
r
whit
e
back
grou
nd
Wh
ite
and
Bla
ck
Car
ibb
ean
W
hit
e
an
d
Bl
ac
k
Af
ric
an
W
hit
e
an
d
As
ia
n
Any
other
mixed
/multi
ple
ethnic
backg
round
In
di
an
Pa
kis
tan
i
Ban
glad
eshi
Ch
ine
se
Any
othe
r
Asia
n
back
grou
nd
Af
ric
an
Car
ibb
ean
Any other
Black/Afri
can/Caribb
ean
backgroun
d
Ar
ab
An
y
oth
er
eth
nic
gro
up
(pl
eas
e
des
cri
be)
Wheth
er
drink
nowad
ays
Y
e
s
Co
unt 5925 62 2 326 23 8 17 18 10
0 6 5 26 52 46 53 18 4 11 67
02
%
wit
hin
Wh
eth
er
drin
k
no
wa
day
s
88.4% 0.
9
%
0.0
%
4.9
%
0.3
%
0.
1
%
0.
3
%
0.3% 1.
5
%
0.1
%
0.1
%
0.
4
%
0.8
%
0.
7
%
0.8
%
0.3% 0.
1
%
0.2
%
10
0.
0
%

%
wit
hin
Eth
nic
orig
in
of
indi
vid
ual
82.9%
80
.5
%
66.
7%
78.7
%
88.
5%
80
.0
%
56
.7
%
58.1
%
48
.8
%
4.3
%
10.9
%
76
.5
%
53.6
%
39
.0
%
67.
9% 81.8%
19
.0
%
42.
3%
78
.6
%
%
of
Tot
al
69.5%
0.
7
%
0.0
%
3.8
%
0.3
%
0.
1
%
0.
2
%
0.2%
1.
2
%
0.1
%
0.1
%
0.
3
%
0.6
%
0.
5
%
0.6
% 0.2%
0.
0
%
0.1
%
78
.6
%
N
o
Co
unt 1219 15 1 88 3 2 13 13 10
5
13
4 41 8 45 72 25 4 17 15 18
20
%
wit
hin
Wh
eth
er
drin
k
no
wa
day
s
67.0% 0.
8
%
0.1
%
4.8
%
0.2
%
0.
1
%
0.
7
%
0.7% 5.
8
%
7.4
%
2.3
%
0.
4
%
2.5
%
4.
0
%
1.4
%
0.2% 0.
9
%
0.8
%
10
0.
0
%
wit
hin
Eth
nic
orig
in
of
indi
vid
ual
82.9%
80
.5
%
66.
7%
78.7
%
88.
5%
80
.0
%
56
.7
%
58.1
%
48
.8
%
4.3
%
10.9
%
76
.5
%
53.6
%
39
.0
%
67.
9% 81.8%
19
.0
%
42.
3%
78
.6
%
%
of
Tot
al
69.5%
0.
7
%
0.0
%
3.8
%
0.3
%
0.
1
%
0.
2
%
0.2%
1.
2
%
0.1
%
0.1
%
0.
3
%
0.6
%
0.
5
%
0.6
% 0.2%
0.
0
%
0.1
%
78
.6
%
N
o
Co
unt 1219 15 1 88 3 2 13 13 10
5
13
4 41 8 45 72 25 4 17 15 18
20
%
wit
hin
Wh
eth
er
drin
k
no
wa
day
s
67.0% 0.
8
%
0.1
%
4.8
%
0.2
%
0.
1
%
0.
7
%
0.7% 5.
8
%
7.4
%
2.3
%
0.
4
%
2.5
%
4.
0
%
1.4
%
0.2% 0.
9
%
0.8
%
10
0.
0
%

%
wit
hin
Eth
nic
orig
in
of
indi
vid
ual
17.1%
19
.5
%
33.
3%
21.3
%
11.
5%
20
.0
%
43
.3
%
41.9
%
51
.2
%
95.
7%
89.1
%
23
.5
%
46.4
%
61
.0
%
32.
1% 18.2%
81
.0
%
57.
7%
21
.4
%
%
of
Tot
al
14.3%
0.
2
%
0.0
%
1.0
%
0.0
%
0.
0
%
0.
2
%
0.2%
1.
2
%
1.6
%
0.5
%
0.
1
%
0.5
%
0.
8
%
0.3
% 0.0%
0.
2
%
0.2
%
21
.4
%
Total Co
unt 7144 77 3 414 26 10 30 31 20
5
14
0 46 34 97 11
8 78 22 21 26 85
22
%
wit
hin
Wh
eth
er
drin
k
no
wa
day
s
83.8% 0.
9
%
0.0
%
4.9
%
0.3
%
0.
1
%
0.
4
%
0.4% 2.
4
%
1.6
%
0.5
%
0.
4
%
1.1
%
1.
4
%
0.9
%
0.3% 0.
2
%
0.3
%
10
0.
0
%
wit
hin
Eth
nic
orig
in
of
indi
vid
ual
17.1%
19
.5
%
33.
3%
21.3
%
11.
5%
20
.0
%
43
.3
%
41.9
%
51
.2
%
95.
7%
89.1
%
23
.5
%
46.4
%
61
.0
%
32.
1% 18.2%
81
.0
%
57.
7%
21
.4
%
%
of
Tot
al
14.3%
0.
2
%
0.0
%
1.0
%
0.0
%
0.
0
%
0.
2
%
0.2%
1.
2
%
1.6
%
0.5
%
0.
1
%
0.5
%
0.
8
%
0.3
% 0.0%
0.
2
%
0.2
%
21
.4
%
Total Co
unt 7144 77 3 414 26 10 30 31 20
5
14
0 46 34 97 11
8 78 22 21 26 85
22
%
wit
hin
Wh
eth
er
drin
k
no
wa
day
s
83.8% 0.
9
%
0.0
%
4.9
%
0.3
%
0.
1
%
0.
4
%
0.4% 2.
4
%
1.6
%
0.5
%
0.
4
%
1.1
%
1.
4
%
0.9
%
0.3% 0.
2
%
0.3
%
10
0.
0
%
Secure Best Marks with AI Grader
Need help grading? Try our AI Grader for instant feedback on your assignments.

%
wit
hin
Eth
nic
orig
in
of
indi
vid
ual
100.0%
10
0.
0
%
10
0.0
%
100.
0%
100
.0%
10
0.
0
%
10
0.
0
%
100.0
%
10
0.
0
%
10
0.0
%
100.
0%
10
0.
0
%
100.
0%
10
0.
0
%
100
.0% 100.0%
10
0.
0
%
10
0.0
%
10
0.
0
%
%
of
Tot
al
83.8%
0.
9
%
0.0
%
4.9
%
0.3
%
0.
1
%
0.
4
%
0.4%
2.
4
%
1.6
%
0.5
%
0.
4
%
1.1
%
1.
4
%
0.9
% 0.3%
0.
2
%
0.3
%
10
0.
0
%
Interpretation: Through the above table, it is interpreted that any other white background people drink alcohol the most because they
are completed agreed to consume alcohol frequently. Such that out of 10617, 326 of them are in taking alcohol, even it is not
beneficial for their health as well.
Correlation between different aspects
Correlations

Sex (D) Total
Household
Income
Age last birthday Whether drink
nowadays
Sex
Pearson Correlation 1 .005 .033** .116**
Sig. (2-tailed) .630 .001 .000
N 10617 10302 10617 8534
(D) Total Household Income
Pearson Correlation .005 1 .050** .073**
Sig. (2-tailed) .630 .000 .000
N 10302 10302 10302 8259
Age last birthday
Pearson Correlation .033** .050** 1 .069**
Sig. (2-tailed) .001 .000 .000
N 10617 10302 10617 8534
Whether drink nowadays
Pearson Correlation .116** .073** .069** 1
Sig. (2-tailed) .000 .000 .000
N 8534 8259 8534 8534
**. Correlation is significant at the 0.01 level (2-tailed).
Interpretation: As per the above table, it is exhibit that there is a significant relationship between sex and total household income
because as per the standard criteria, value of p (0.005) is lower than 0.05. Therefore, there is a correlation between these factor and if
changes in sex, then there is 63% change in the household income. On the other side, it is also identified from the above output table
that there is no significant difference between the total household size and other aspects because it rejects the alternative hypothesis
over null. In addition to this, there is a correlation between age last birthday and other aspects because the value of p is lower than the
standard criteria which reflects that if there is any change between age last birthday then it affects other components as well.

Moreover, there is no interrelationship between drink now a day between other aspects because all values are greater than the defined
criteria.
Discussion
From the above data analysis, it can be analyzed that wider female gender has been found to be using alcohol where percentage
of female is 54.3 more than male alcohol users. Based on sex ratio divide females are more addicted to alcohol within recent years
when health risks have been increasingly at risk. The alcohol users in UK are at an increasing rate where results have examined that at
present female alcohol users are more, also analysis shows prevention measures needs to be taken actively. Implications of analysis
also explains prevention and control of alcohol use in UK has to be done for generating new scale advancement. The analysis has also
examined females are more addicted to alcohol, where it shows that there has been constant increase in female alcohol users at UK, as
5765 alcohol users are females and also there has been constant growth within health risk factors. This factor explains interpretation
to be accurately predicting wide users of alcohol are females, where percentage is lower than male users (Clarke and et.al, 2017).
It can be also understood that health factors of women are at risk due to high alcohol addiction and also there has been constant
rise in addiction towards alcohol, bringing use of alcohol widely spread. The above data also explains that females of UK are at
wider risk from daily alcohol addiction bringing wide health risk factors and increased negative downfall in regular addiction. The
pictorial data also explains that there has been constant rise in alcohol addiction within females and also this factor explains health risk
factors among females making it the biggest health risk factor for females. Thus it can be analyzed that addiction of alcohol impacts
female health where addiction has been found to be widely increasing at latest scenarios, on which research has shown wide range of
large increase at UK. Alcohol addiction grows psychologically, where female’s health being at risk needs immediate action by
government. The Latest research should be also used to reduce addiction of alcohol among females, where this also explains
immediate need by government, also there is varied growth towards female alcohol abuse which also increases risk factor. Thus it can
be analyzed that recent results have been depicting UK female drinkers to be also having high health risk where this involves wider
scale demand of effective actions to be taken by government for reducing. Alcohol addiction. There has been also constant rise in
Paraphrase This Document
Need a fresh take? Get an instant paraphrase of this document with our AI Paraphraser

female addiction where there are various cases among people facing huge challenging reduction in health factors. Females are at
continuous risk when it comes to obesity, other implications from alcohol addiction and there has been constant risk within medical
health factors, where alcohol addiction has been found to be constantly rising at UK. Thus it can be understood that alcohol addiction
widely reduces life longevity among females, also there is keen requirement within health factors for keeping up with wider scale,
80% of women in England reported drinking in the last twelve months. Recently it has been also analyzed that Great Britain, between
the majority of women surveyed. (Alcohol Consumption UK 2019).
Implications for prevention or control of alcohol use in the UK
On the basis of above data, it can clearly be said that more than 60% of total people of sample of the UK drink alcohol. This
rate of alcohol consumption is affecting them in both physical and mental manner. It is important to discuss some strategies or ways
by which this rate of alcohol consumption can be reduced and getting better outcomes. One of the best way of controlling alcohol use
in the UK is: developing alcohol prevention programme. Many people do not know consequences of alcohol consumption, so, by
making them aware about consequences, this rate can be reduced (Rehm and Barbosa, 2018). It can help them out in improving
quality of life. Other main reason of developing alcohol prevention programme is to make parents aware about importance of building
relation with their children. It is found that people of the UK start consuming alcohol at the age of 5 at home. Children at the age of 5
are allowed to drink alcohol at home, but parents need to make themselves aware about consequences and problems that alcohol
consumption can have on them. It is also found that lack of attention by parents and busy schedule of parents lead this situation.
Children at the age of 1 5 starts drinking this. So, it can be said that by building relation with children and guiding them in a right
direction can help in controlling this rate. This preventive strategy can improve parent’s children relations and develop an improved
society.
By implementing strict drink-driving polices, rate of alcohol use can be controlled. By taking strict actions if someone found
drunk while driving, can also reduce alcohol and accident rate (Watterson and et.al., 2020). Alcohol impaired driving is the major

public health problems that affects drinker and innocent people sometimes. Some actions measurements can be used in this situation
such as: sobriety check points, breath testing, suspension of driving licence, using an ignition interlock and others. All these can
decrease accident as well as motility rate, happens with drink-driving. Other main strategy that can help to the great extent in
preventing alcohol use and improving quality of lives in the UK is: strict regulations or policies regarding availability of alcohol.
Public availability of alcohol via laws and programmes is one of the best way for reducing harmful use of alcohol that affect people
physically and mentally. Such strategies and policies provide better measures to prevent easy access to alcohol by high risk group of
people. So, it can be said that restriction on alcohol availability may promote development of parallel illicit market. In addition, strict
policies on marketing of alcoholic beverages can also reduce this rate. Targeting young people is too easy for companies in this
context because at this age, people get influenced easily. So, by implementing or introducing policies for companies that market its
beverages and alcohol and specially target young people, this rate can be controlled (Casswell and et.al., 2018). By regulating new
forms of alcohol marketing techniques such as social media can also help out in preventing alcohol use in the UK.
Conclusion and recommendations
Conclusion
By summing up above report it has been concluded that majority of the selected respondents consume alcohol and among all,
female drink alcohol more as compared to men. The report also reflected that the percentage of women in the sample is higher than
others and most of them are divorced as well. Through the secondary research it is also analyzed that female are consuming alcohol
and this in turn affect their health too in adverse manner. Therefore, literature also indicate that there is a negative consequence of
excessive consuming alcohol and that is why, government also develop strategies in order to minimize the issues. Due to over in
taking of Alcohol, it leads to accidents and many illness issues. That is why, there is a need to make actions immediately or else draw
attention of many people towards this issue as well. Further, it is also summarized that there is a need to make valid methods in order
to overcome the problem, otherwise it enhanced the death rate among UK people.

Recommendations
From the above research it can be recommended that all alcohol related services should aim to provide increased viability of
improved access to women, where UK has to take the best strategies shaping new advanced standards for reducing female
users within alcohol at UK. Research should be undertaken to identify interventions including small scale, local activities and
at wider digital level for promoting health risks factors due to alcohol. There shall be in depth analysis towards effective longer
scale interventions for reducing alcohol usage among people. Digital media platforms need to be used for communicating
health risk factors among females due to regular intake of alcohol, also attempt to reduce supplies government needs to take
strategies (Fan and et.al, 2017).
Rigorous research should be undertaken to improve understanding of how alcohol impacts health, by using social media for
connecting with wider people. It can be also analyzed that leadership, awareness and commitment within Health services'
responses plays crucial role, where strategies to reduce availability of alcohol in market should be implemented. Also, negative
consequences of drinking alcohol need to be displayed among people for divergent scope to evolve towards reduced usage.
Alcohol is psychologically and physically addictive where government tries to prevent alcohol abuse and alcoholism through
laws and public awareness.
Awareness campaigns are aimed at preventing young people from drinking before they turn 18 for harmful alcohol
consumption, preventing people from becoming psychologically or physically dependent on alcohol within UK. Harm caused
by alcohol abuse, such as public antisocial behavior, domestic violence and traffic accidents should be monitored and also
wider usage of innovative digital platforms shall be used. It is essential that people recognize the signs of alcoholism at an
early stage where drinking too much has impact on psychological scenarios within females. (Inan-Eroglu and et.al., 2020).
Secure Best Marks with AI Grader
Need help grading? Try our AI Grader for instant feedback on your assignments.

REFERENCES
Books and Journals
Casswell, S. and et.al., 2018. The Alcohol Environment Protocol: A new tool for alcohol policy.Drug and alcohol review. 37. pp.S18-
S26.
Clarke, T. K., and et.al, 2017. Genome-wide association study of alcohol consumption and genetic overlap with other health-related
traits in UK Biobank (N= 112 117). Molecular psychiatry.. 22(10). pp.1376-1384.
Fan, D., and et.al, 2017. Female alcohol consumption and fecundability: a systematic review and dose-response meta-
analysis. Scientific reports. 7(1). pp.1-12.
Inan-Eroglu, E. and et.al., 2020. Is There a Link between Different Types of Alcoholic Drinks and Obesity? An Analysis of 280,183
UK Biobank Participants. International journal of environmental research and public health. 17(14). p.5178.
Rehm, J. and Barbosa, C., 2018. The cost-effectiveness of therapies to treat alcohol use disorders. Expert review of
pharmacoeconomics & outcomes research. 18(1). pp.43-49.
Watterson, J.R. and et.al., 2020. Workplace intervention programmes for decreasing alcohol use in military personnel: a systematic
review. BMJ Mil Health.
Online
Alcohol Consumption UK. 2019.[Online]. Available Through : <https://www.drinkaware.co.uk/research/research-and-evaluation-
reports/alcohol-consumption-uk>.
1 out of 29

Your All-in-One AI-Powered Toolkit for Academic Success.
+13062052269
info@desklib.com
Available 24*7 on WhatsApp / Email
Unlock your academic potential
© 2024 | Zucol Services PVT LTD | All rights reserved.