Economics and Quantitative Analysis: Graduation and Retention Report
VerifiedAdded on 2020/01/28
|9
|1792
|375
Report
AI Summary
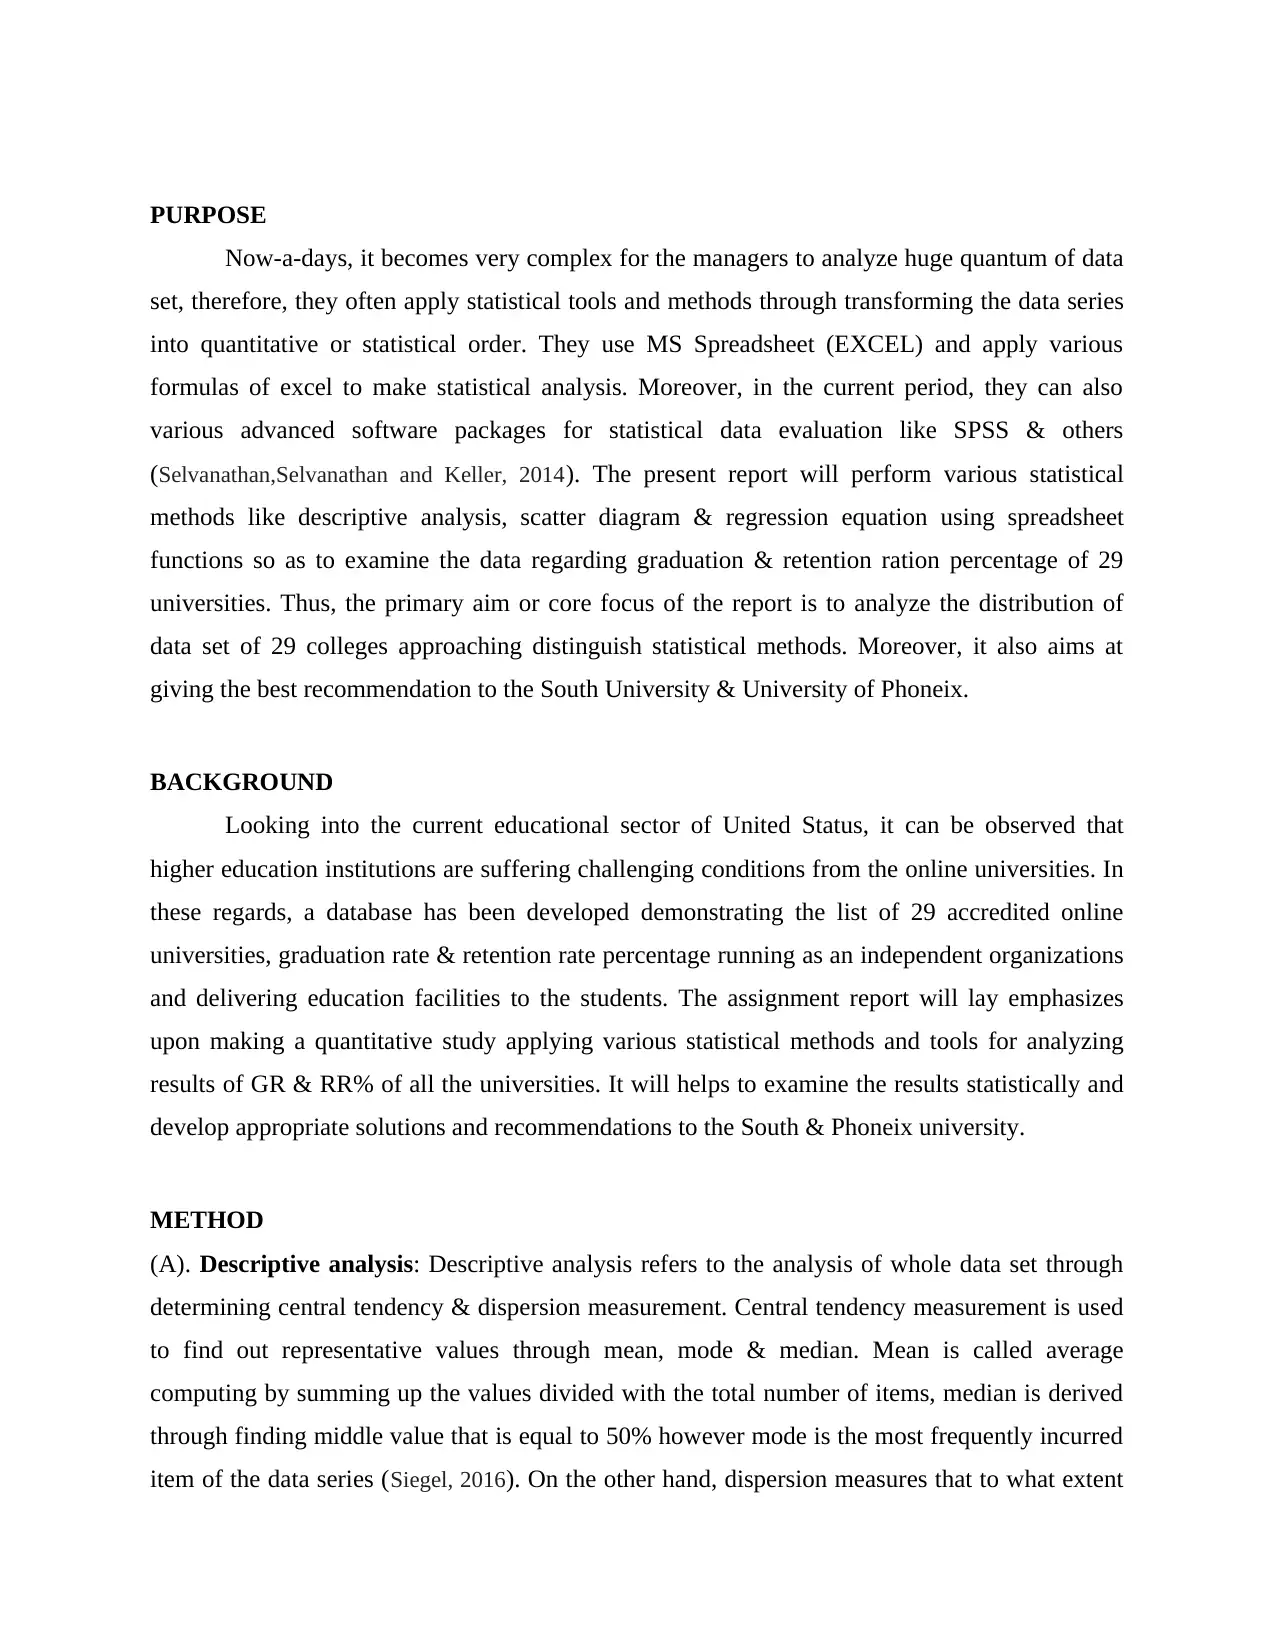
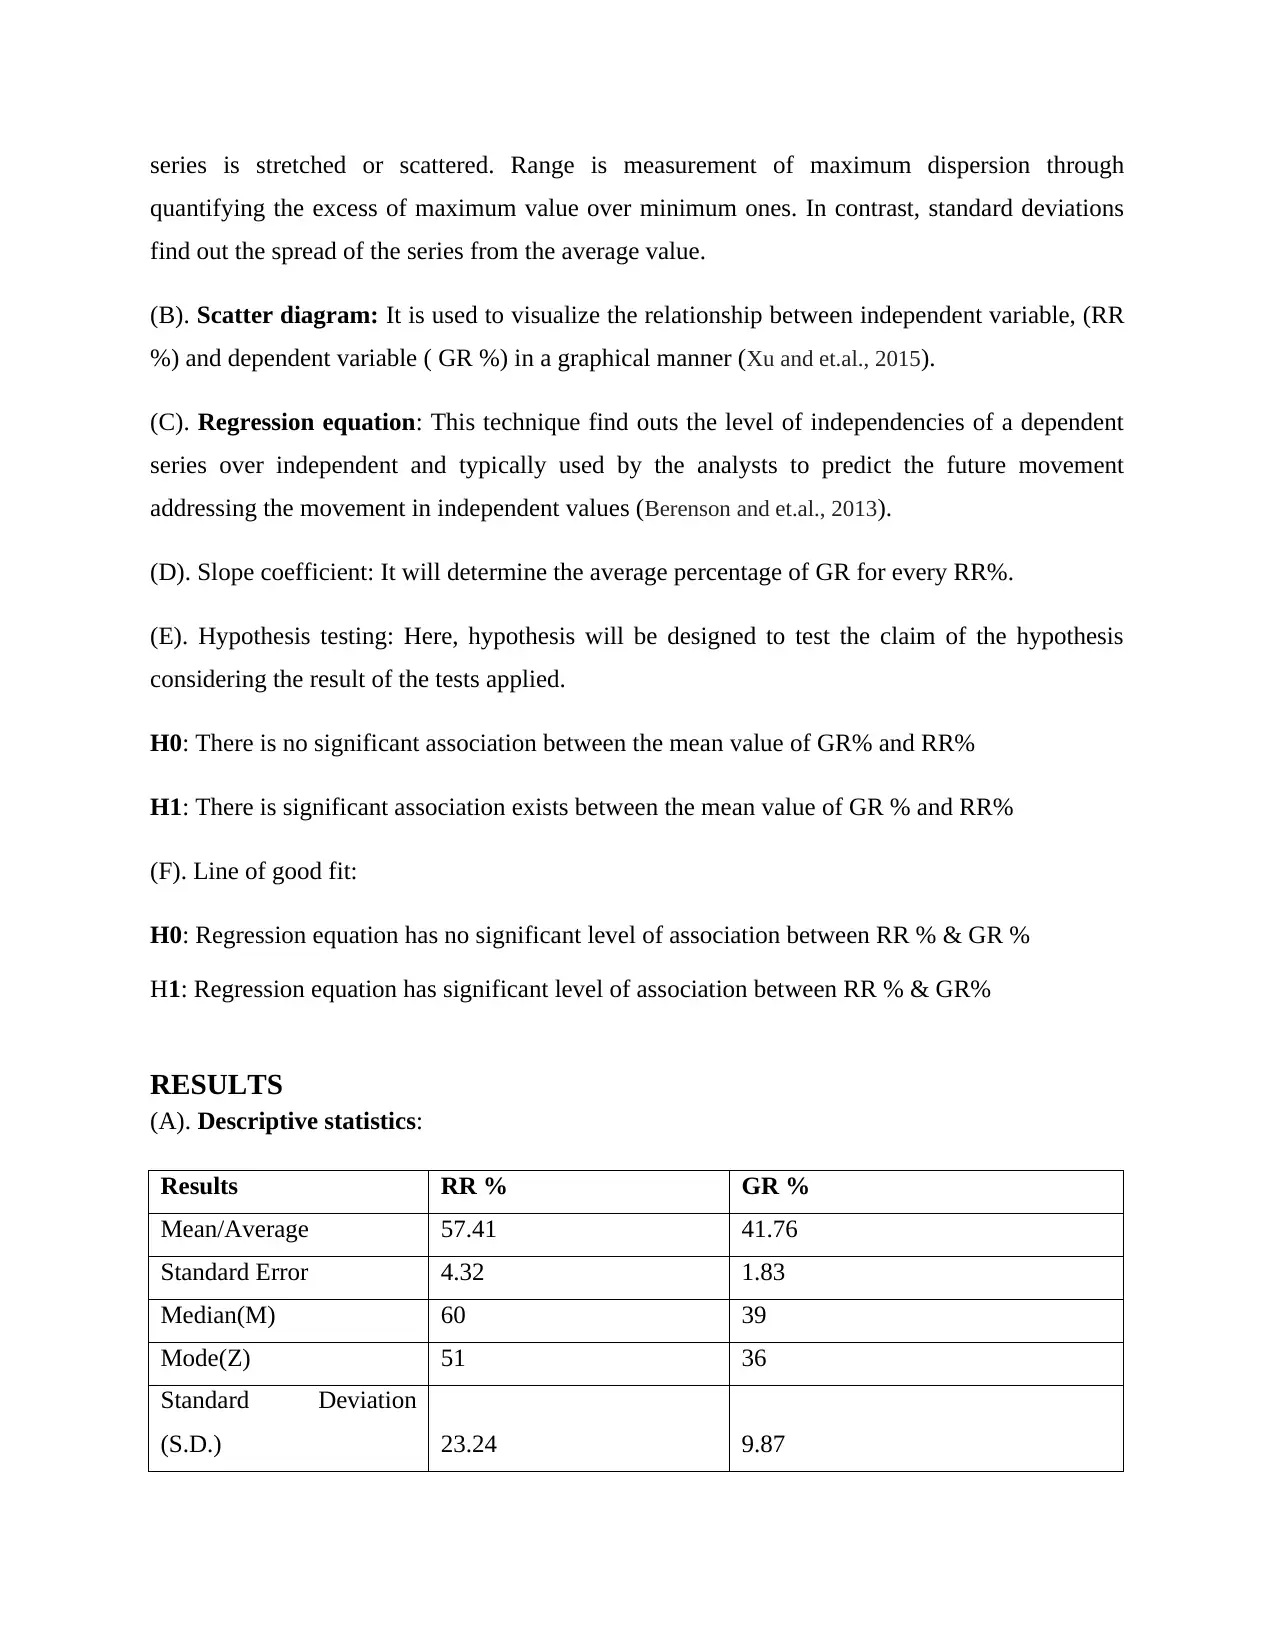
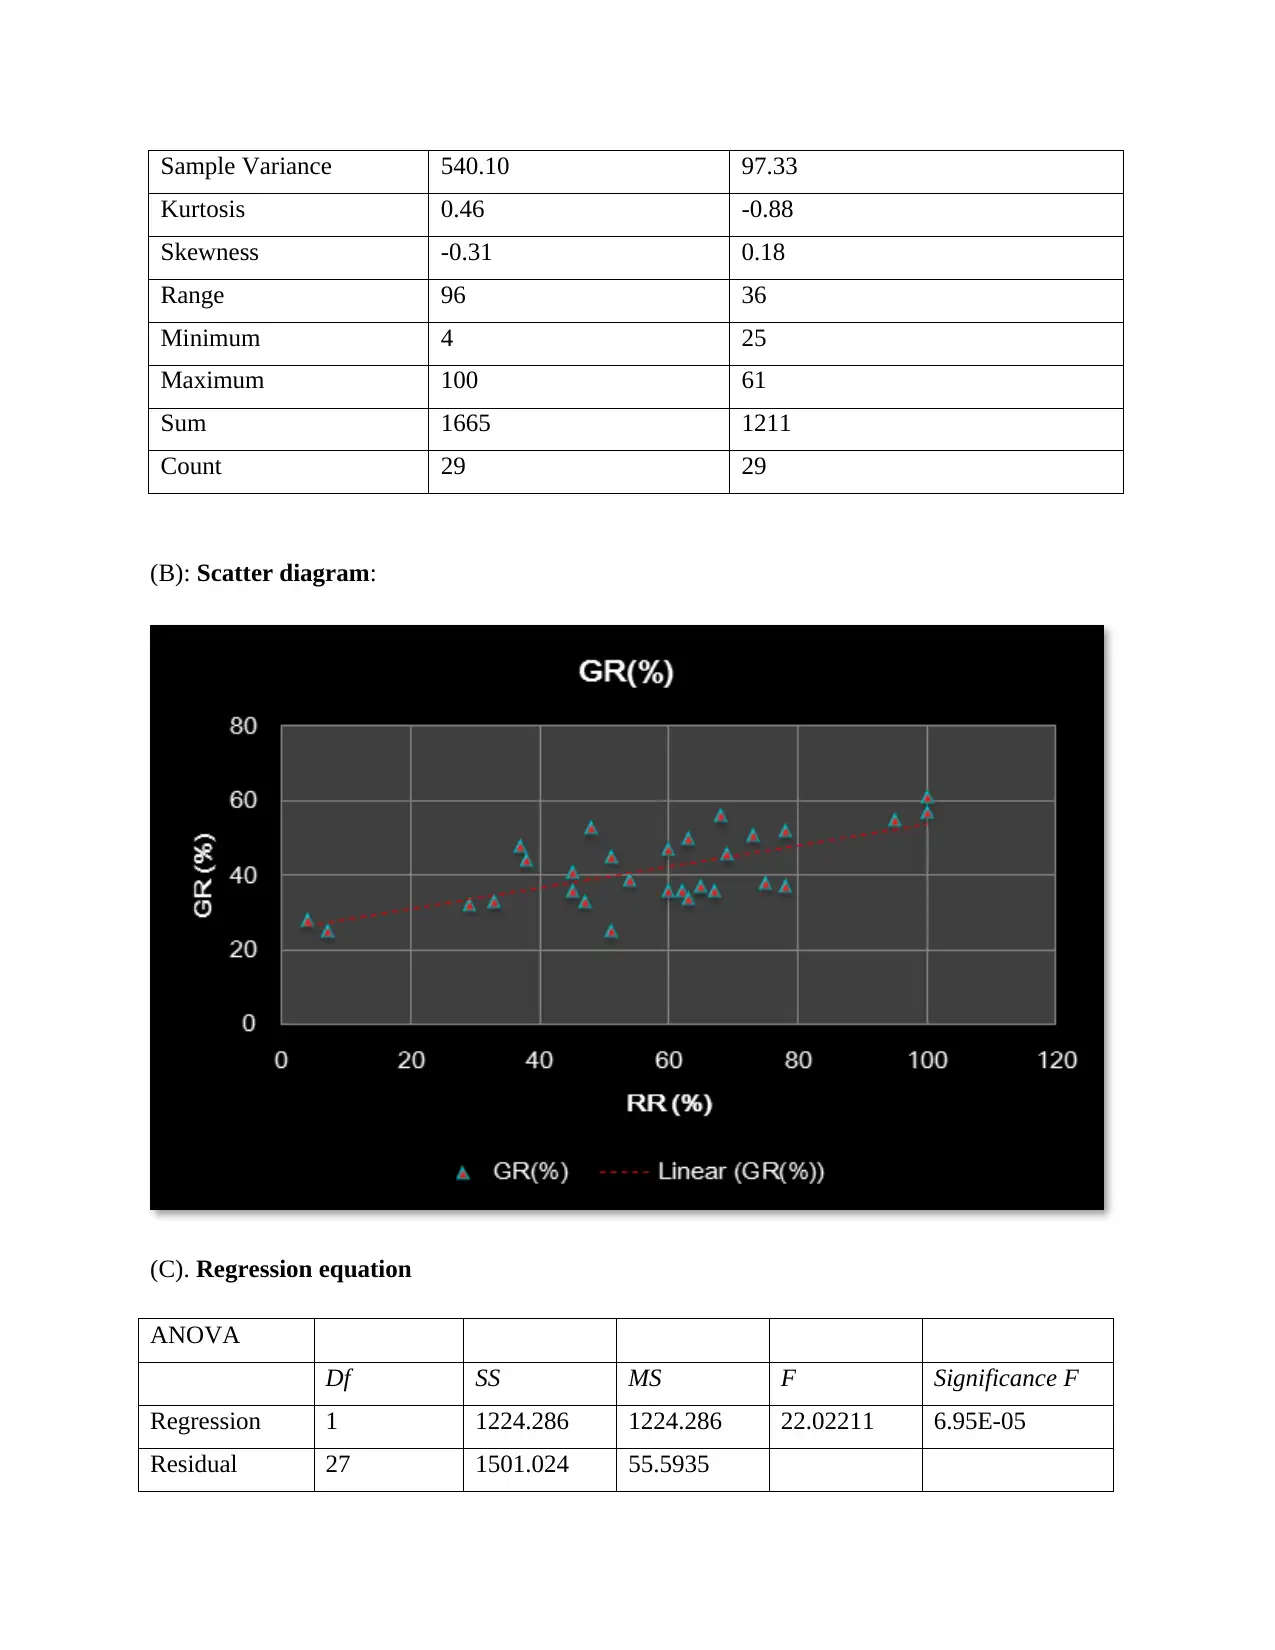
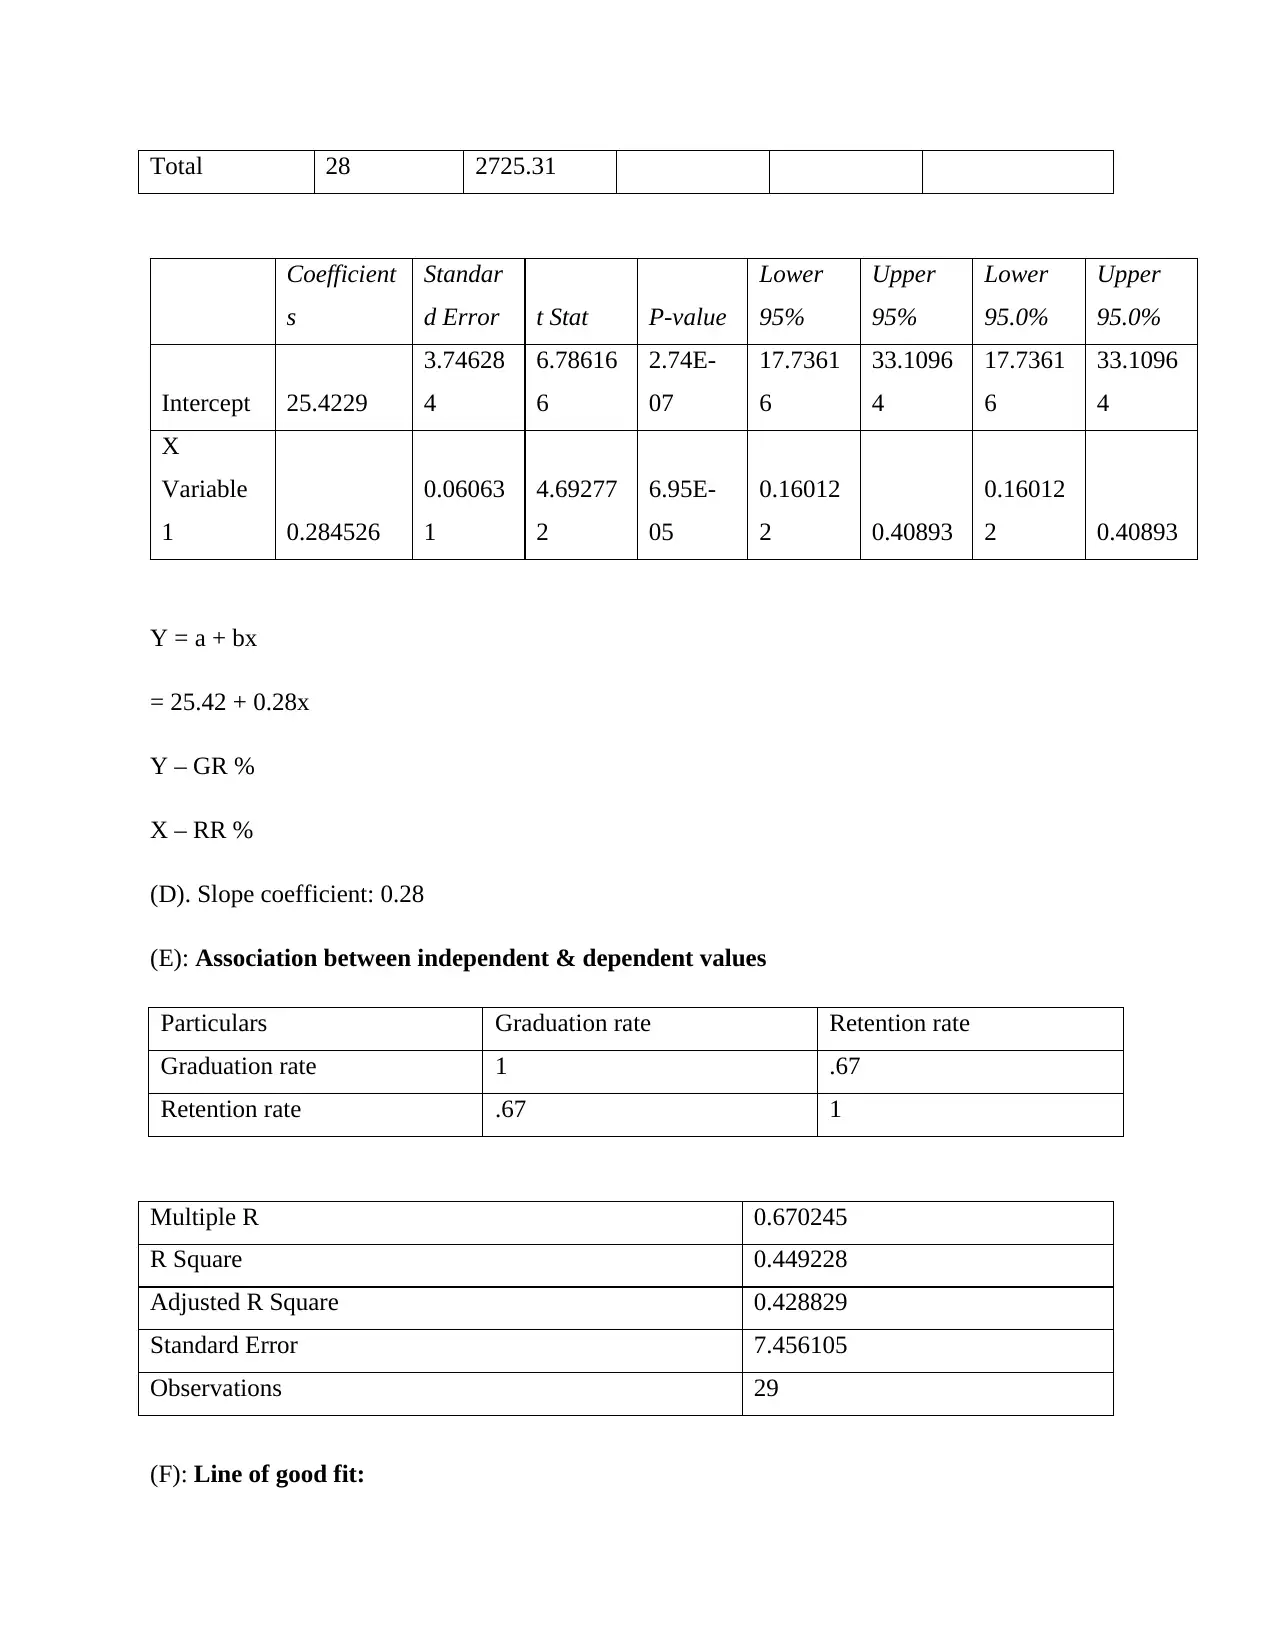
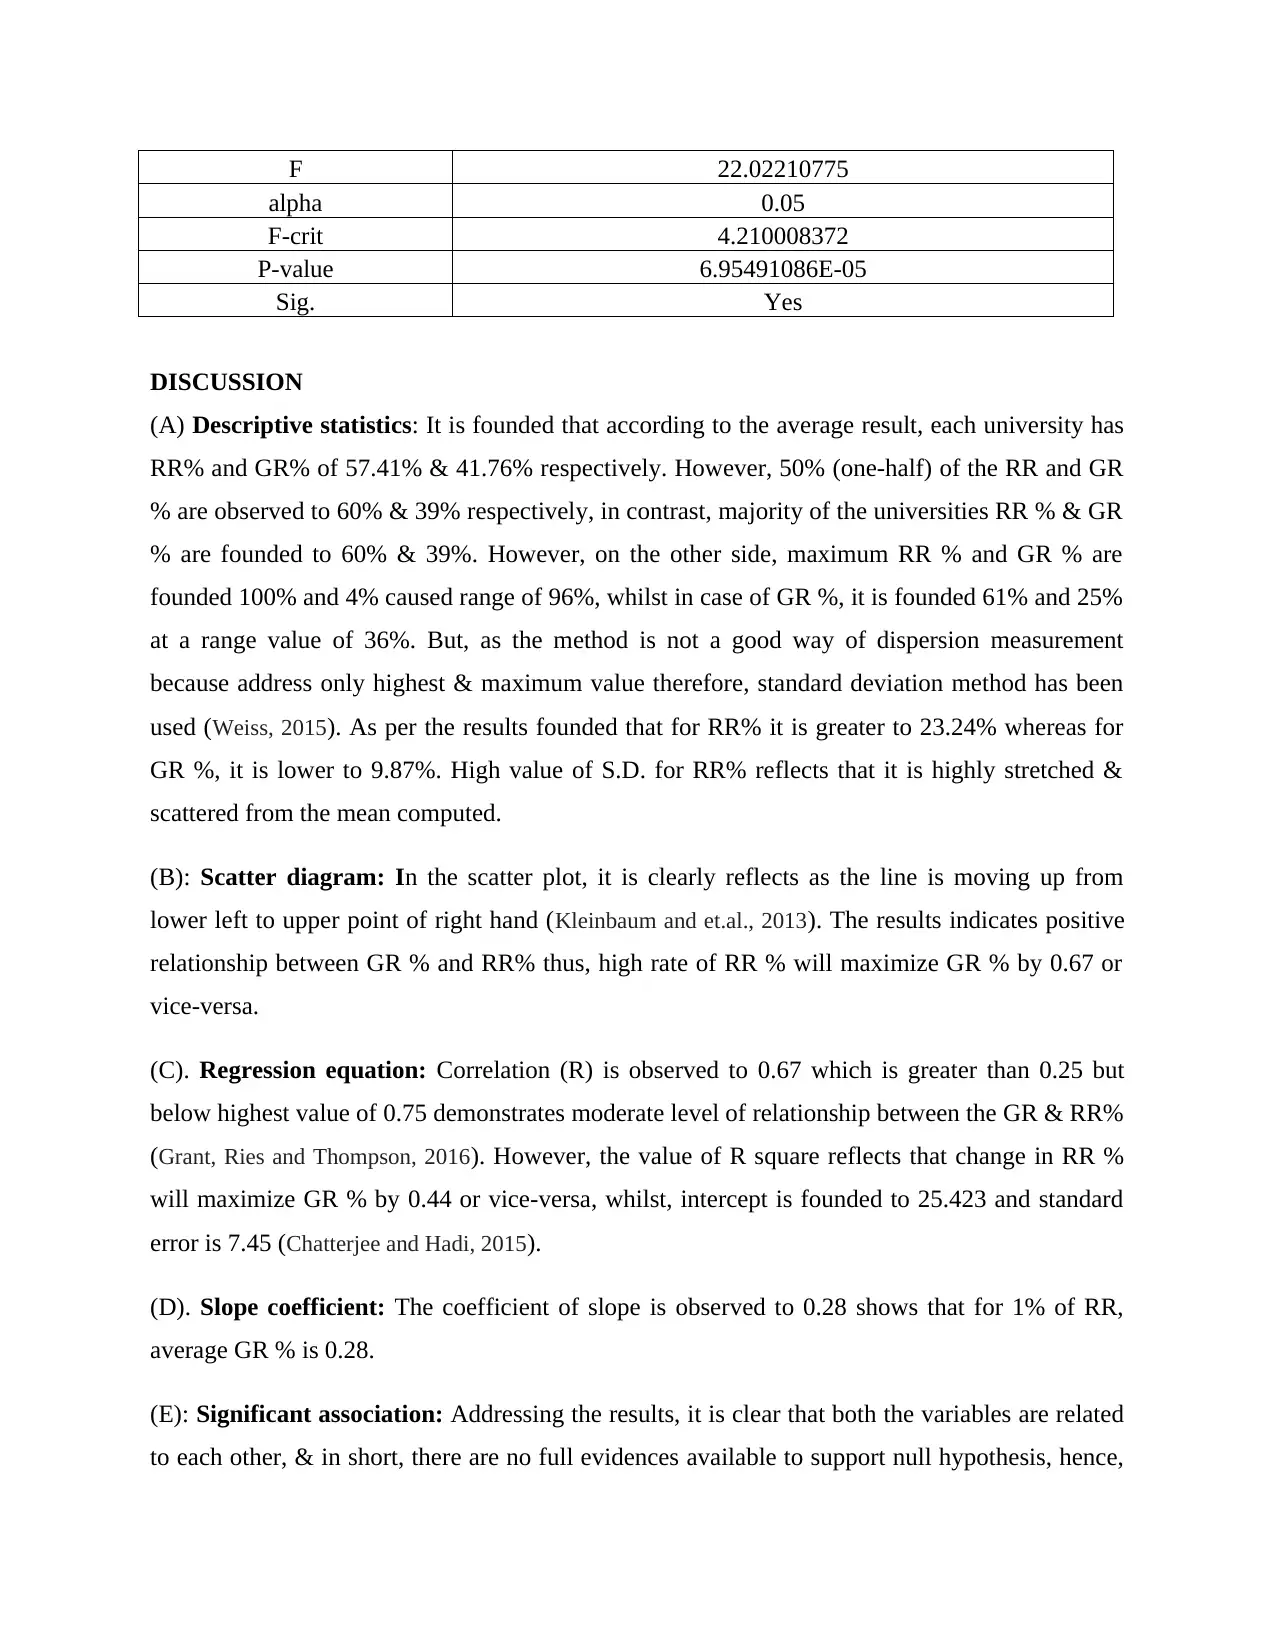
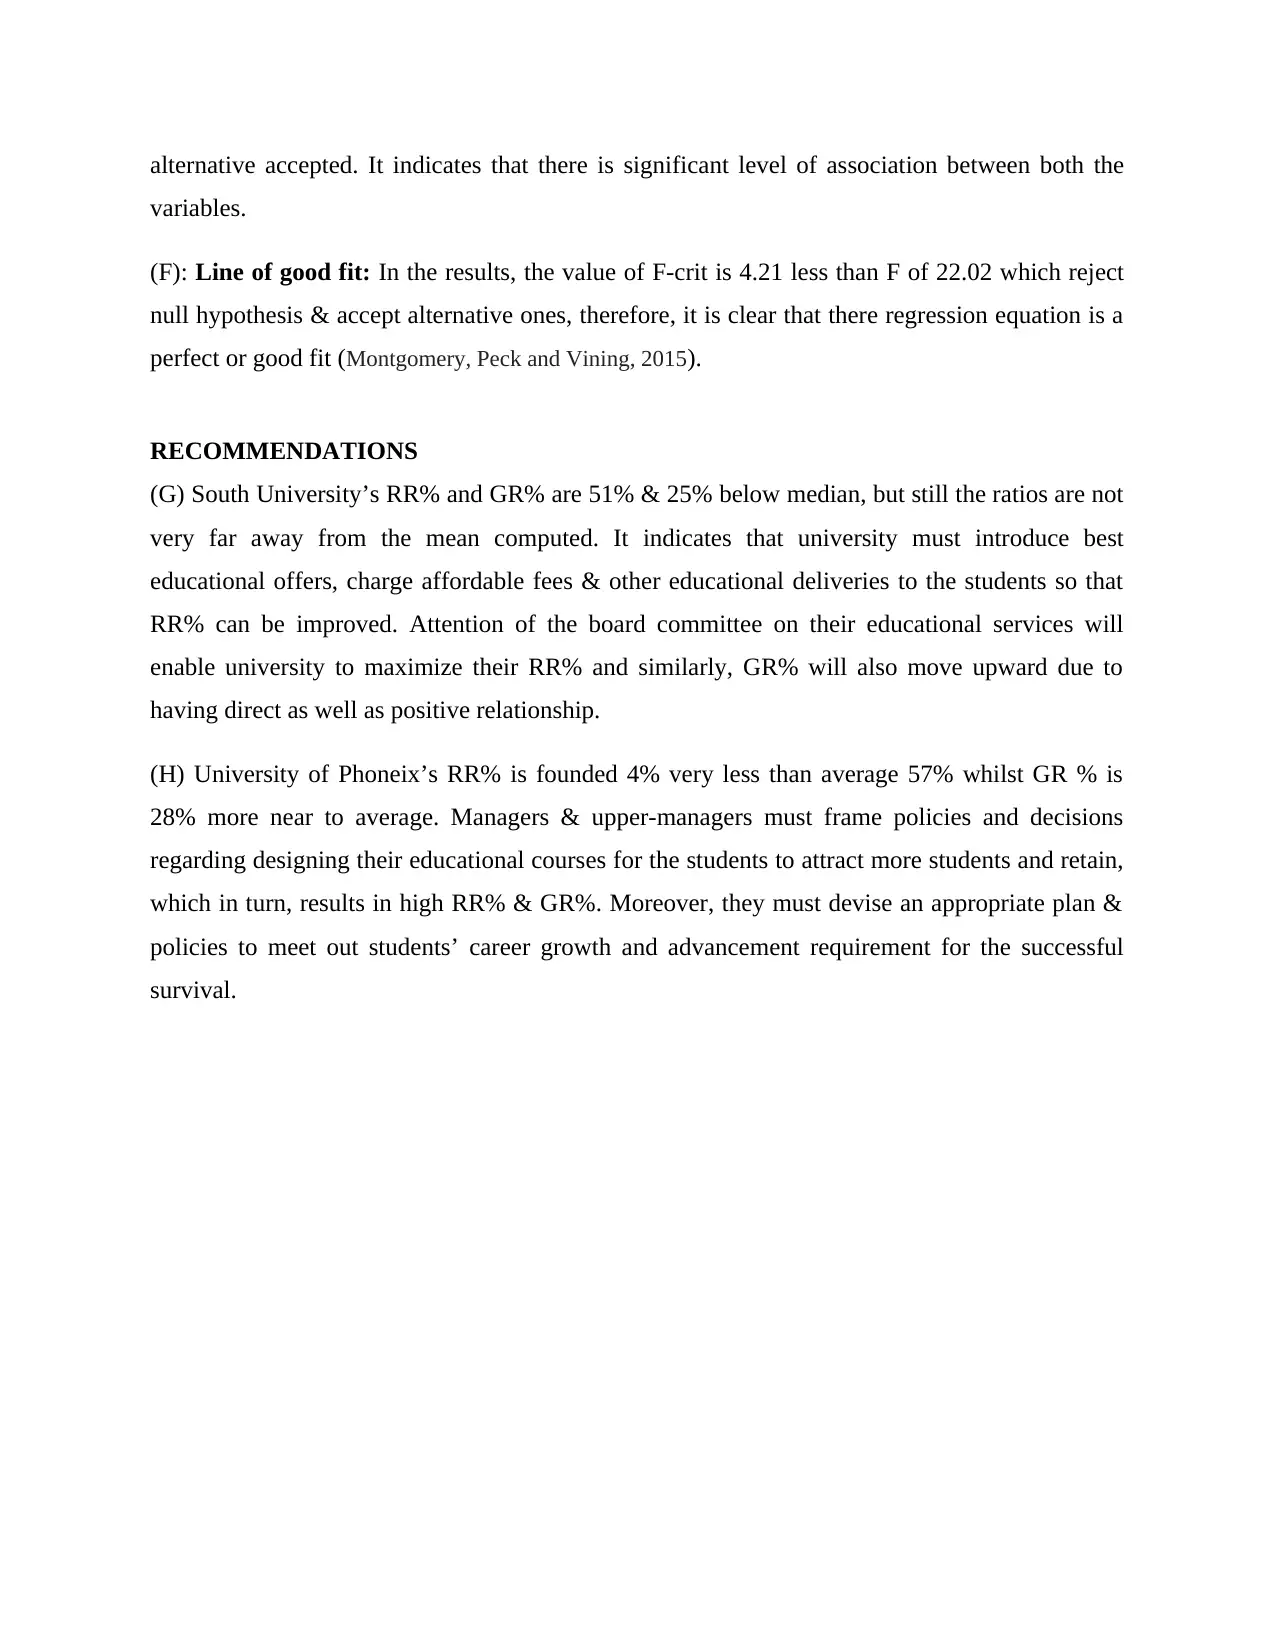
This report presents a quantitative analysis of graduation and retention rates for 29 universities. It employs various statistical methods, including descriptive analysis, scatter diagrams, and regression equations, to examine the relationships between these variables. The analysis includes calculating mean, median, mode, standard deviation, and other descriptive statistics. A scatter plot visualizes the relationship between retention and graduation rates, while regression analysis determines the correlation and the impact of retention rates on graduation rates. The report also conducts hypothesis testing and evaluates the line of best fit. Findings reveal insights into the performance of the universities, with specific recommendations for South University and University of Phoenix to improve their retention and graduation rates based on the statistical outcomes.

ECONOMICS AND QUANTITATIVE
ANALYSIS
ANALYSIS
Paraphrase This Document
Need a fresh take? Get an instant paraphrase of this document with our AI Paraphraser

Table of Contents
PURPOSE.....................................................................................................................................................3
BACKGROUND.............................................................................................................................................3
METHOD......................................................................................................................................................3
RESULTS.......................................................................................................................................................4
DISCUSSION.................................................................................................................................................7
RECOMMENDATIONS..................................................................................................................................8
REFERENCES................................................................................................................................................9

PURPOSE
Now-a-days, it becomes very complex for the managers to analyze huge quantum of data
set, therefore, they often apply statistical tools and methods through transforming the data series
into quantitative or statistical order. They use MS Spreadsheet (EXCEL) and apply various
formulas of excel to make statistical analysis. Moreover, in the current period, they can also
various advanced software packages for statistical data evaluation like SPSS & others
(Selvanathan,Selvanathan and Keller, 2014). The present report will perform various statistical
methods like descriptive analysis, scatter diagram & regression equation using spreadsheet
functions so as to examine the data regarding graduation & retention ration percentage of 29
universities. Thus, the primary aim or core focus of the report is to analyze the distribution of
data set of 29 colleges approaching distinguish statistical methods. Moreover, it also aims at
giving the best recommendation to the South University & University of Phoneix.
BACKGROUND
Looking into the current educational sector of United Status, it can be observed that
higher education institutions are suffering challenging conditions from the online universities. In
these regards, a database has been developed demonstrating the list of 29 accredited online
universities, graduation rate & retention rate percentage running as an independent organizations
and delivering education facilities to the students. The assignment report will lay emphasizes
upon making a quantitative study applying various statistical methods and tools for analyzing
results of GR & RR% of all the universities. It will helps to examine the results statistically and
develop appropriate solutions and recommendations to the South & Phoneix university.
METHOD
(A). Descriptive analysis: Descriptive analysis refers to the analysis of whole data set through
determining central tendency & dispersion measurement. Central tendency measurement is used
to find out representative values through mean, mode & median. Mean is called average
computing by summing up the values divided with the total number of items, median is derived
through finding middle value that is equal to 50% however mode is the most frequently incurred
item of the data series (Siegel, 2016). On the other hand, dispersion measures that to what extent
⊘ This is a preview!⊘
Do you want full access?
Subscribe today to unlock all pages.

Trusted by 1+ million students worldwide

series is stretched or scattered. Range is measurement of maximum dispersion through
quantifying the excess of maximum value over minimum ones. In contrast, standard deviations
find out the spread of the series from the average value.
(B). Scatter diagram: It is used to visualize the relationship between independent variable, (RR
%) and dependent variable ( GR %) in a graphical manner (Xu and et.al., 2015).
(C). Regression equation: This technique find outs the level of independencies of a dependent
series over independent and typically used by the analysts to predict the future movement
addressing the movement in independent values (Berenson and et.al., 2013).
(D). Slope coefficient: It will determine the average percentage of GR for every RR%.
(E). Hypothesis testing: Here, hypothesis will be designed to test the claim of the hypothesis
considering the result of the tests applied.
H0: There is no significant association between the mean value of GR% and RR%
H1: There is significant association exists between the mean value of GR % and RR%
(F). Line of good fit:
H0: Regression equation has no significant level of association between RR % & GR %
H1: Regression equation has significant level of association between RR % & GR%
RESULTS
(A). Descriptive statistics:
Results RR % GR %
Mean/Average 57.41 41.76
Standard Error 4.32 1.83
Median(M) 60 39
Mode(Z) 51 36
Standard Deviation
(S.D.) 23.24 9.87
Paraphrase This Document
Need a fresh take? Get an instant paraphrase of this document with our AI Paraphraser

Sample Variance 540.10 97.33
Kurtosis 0.46 -0.88
Skewness -0.31 0.18
Range 96 36
Minimum 4 25
Maximum 100 61
Sum 1665 1211
Count 29 29
(B): Scatter diagram:
(C). Regression equation
ANOVA
Df SS MS F Significance F
Regression 1 1224.286 1224.286 22.02211 6.95E-05
Residual 27 1501.024 55.5935
Kurtosis 0.46 -0.88
Skewness -0.31 0.18
Range 96 36
Minimum 4 25
Maximum 100 61
Sum 1665 1211
Count 29 29
(B): Scatter diagram:
(C). Regression equation
ANOVA
Df SS MS F Significance F
Regression 1 1224.286 1224.286 22.02211 6.95E-05
Residual 27 1501.024 55.5935

Total 28 2725.31
Coefficient
s
Standar
d Error t Stat P-value
Lower
95%
Upper
95%
Lower
95.0%
Upper
95.0%
Intercept 25.4229
3.74628
4
6.78616
6
2.74E-
07
17.7361
6
33.1096
4
17.7361
6
33.1096
4
X
Variable
1 0.284526
0.06063
1
4.69277
2
6.95E-
05
0.16012
2 0.40893
0.16012
2 0.40893
Y = a + bx
= 25.42 + 0.28x
Y – GR %
X – RR %
(D). Slope coefficient: 0.28
(E): Association between independent & dependent values
Particulars Graduation rate Retention rate
Graduation rate 1 .67
Retention rate .67 1
Multiple R 0.670245
R Square 0.449228
Adjusted R Square 0.428829
Standard Error 7.456105
Observations 29
(F): Line of good fit:
⊘ This is a preview!⊘
Do you want full access?
Subscribe today to unlock all pages.

Trusted by 1+ million students worldwide

F 22.02210775
alpha 0.05
F-crit 4.210008372
P-value 6.95491086E-05
Sig. Yes
DISCUSSION
(A) Descriptive statistics: It is founded that according to the average result, each university has
RR% and GR% of 57.41% & 41.76% respectively. However, 50% (one-half) of the RR and GR
% are observed to 60% & 39% respectively, in contrast, majority of the universities RR % & GR
% are founded to 60% & 39%. However, on the other side, maximum RR % and GR % are
founded 100% and 4% caused range of 96%, whilst in case of GR %, it is founded 61% and 25%
at a range value of 36%. But, as the method is not a good way of dispersion measurement
because address only highest & maximum value therefore, standard deviation method has been
used (Weiss, 2015). As per the results founded that for RR% it is greater to 23.24% whereas for
GR %, it is lower to 9.87%. High value of S.D. for RR% reflects that it is highly stretched &
scattered from the mean computed.
(B): Scatter diagram: In the scatter plot, it is clearly reflects as the line is moving up from
lower left to upper point of right hand (Kleinbaum and et.al., 2013). The results indicates positive
relationship between GR % and RR% thus, high rate of RR % will maximize GR % by 0.67 or
vice-versa.
(C). Regression equation: Correlation (R) is observed to 0.67 which is greater than 0.25 but
below highest value of 0.75 demonstrates moderate level of relationship between the GR & RR%
(Grant, Ries and Thompson, 2016). However, the value of R square reflects that change in RR %
will maximize GR % by 0.44 or vice-versa, whilst, intercept is founded to 25.423 and standard
error is 7.45 (Chatterjee and Hadi, 2015).
(D). Slope coefficient: The coefficient of slope is observed to 0.28 shows that for 1% of RR,
average GR % is 0.28.
(E): Significant association: Addressing the results, it is clear that both the variables are related
to each other, & in short, there are no full evidences available to support null hypothesis, hence,
Paraphrase This Document
Need a fresh take? Get an instant paraphrase of this document with our AI Paraphraser

alternative accepted. It indicates that there is significant level of association between both the
variables.
(F): Line of good fit: In the results, the value of F-crit is 4.21 less than F of 22.02 which reject
null hypothesis & accept alternative ones, therefore, it is clear that there regression equation is a
perfect or good fit (Montgomery, Peck and Vining, 2015).
RECOMMENDATIONS
(G) South University’s RR% and GR% are 51% & 25% below median, but still the ratios are not
very far away from the mean computed. It indicates that university must introduce best
educational offers, charge affordable fees & other educational deliveries to the students so that
RR% can be improved. Attention of the board committee on their educational services will
enable university to maximize their RR% and similarly, GR% will also move upward due to
having direct as well as positive relationship.
(H) University of Phoneix’s RR% is founded 4% very less than average 57% whilst GR % is
28% more near to average. Managers & upper-managers must frame policies and decisions
regarding designing their educational courses for the students to attract more students and retain,
which in turn, results in high RR% & GR%. Moreover, they must devise an appropriate plan &
policies to meet out students’ career growth and advancement requirement for the successful
survival.

REFERENCES
Books and Journals
Berenson, M. and et.al., 2013. Basic Business Statistics: Global Edition. Pearson Higher Ed.
Chatterjee, S. and Hadi, A.S., 2015. Regression analysis by example. John Wiley & Sons.
Grant, A., Ries, R. and Thompson, C., 2016. Quantitative approaches in life cycle assessment—
part 1—descriptive statistics and factor analysis. The International Journal of Life Cycle
Assessment. 21(6). pp.903-911.
Kleinbaum, D. and et.al., 2013. Applied regression analysis and other multivariable methods.
Nelson Education.
Montgomery, D.C., Peck, E.A. and Vining, G.G., 2015. Introduction to linear regression
analysis. John Wiley & Sons.
Selvanathan, S., Selvanathan, S. and Keller, G., 2014. Business Statistics: Australia/New
Zealand. Cengage Learning.
Siegel, A., 2016. Practical business statistics. Academic Press.
Weiss, N.A., 2015. Introductory statistics. Pearson.
Xu, Y. and et.al., 2015. Study on the changes of peripheral blood lymphocyte scatter diagram in
patients newly diagnosed with hepatitis B. International Journal of Laboratory Medicine.
10(3). pp.2524-2525.
⊘ This is a preview!⊘
Do you want full access?
Subscribe today to unlock all pages.

Trusted by 1+ million students worldwide
1 out of 9
Related Documents

Your All-in-One AI-Powered Toolkit for Academic Success.
+13062052269
info@desklib.com
Available 24*7 on WhatsApp / Email
Unlock your academic potential
© 2024 | Zucol Services PVT LTD | All rights reserved.