BU5.05 Quantitative Analysis Assignment: Data Analysis and Statistics

Verified

Added on  2023/03/31

|9
|1103
|88
Homework Assignment
AI Summary
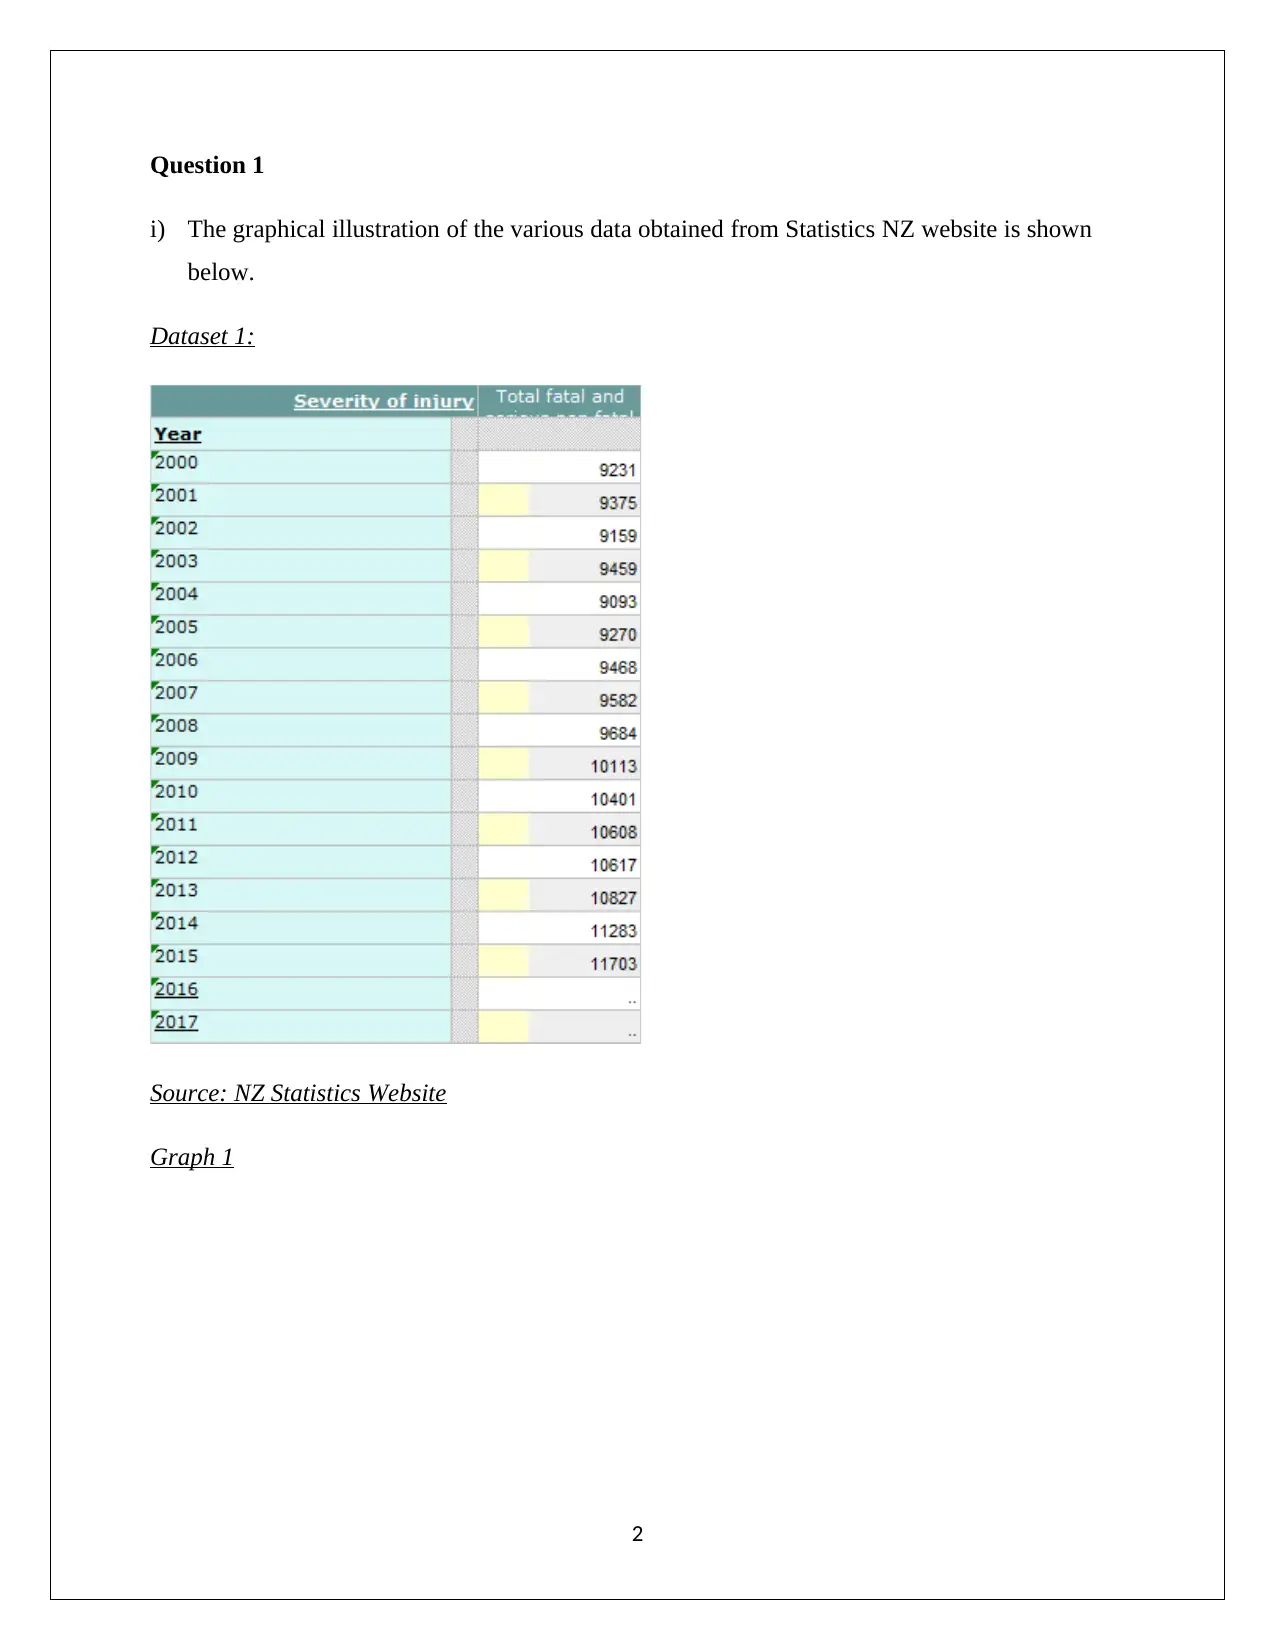
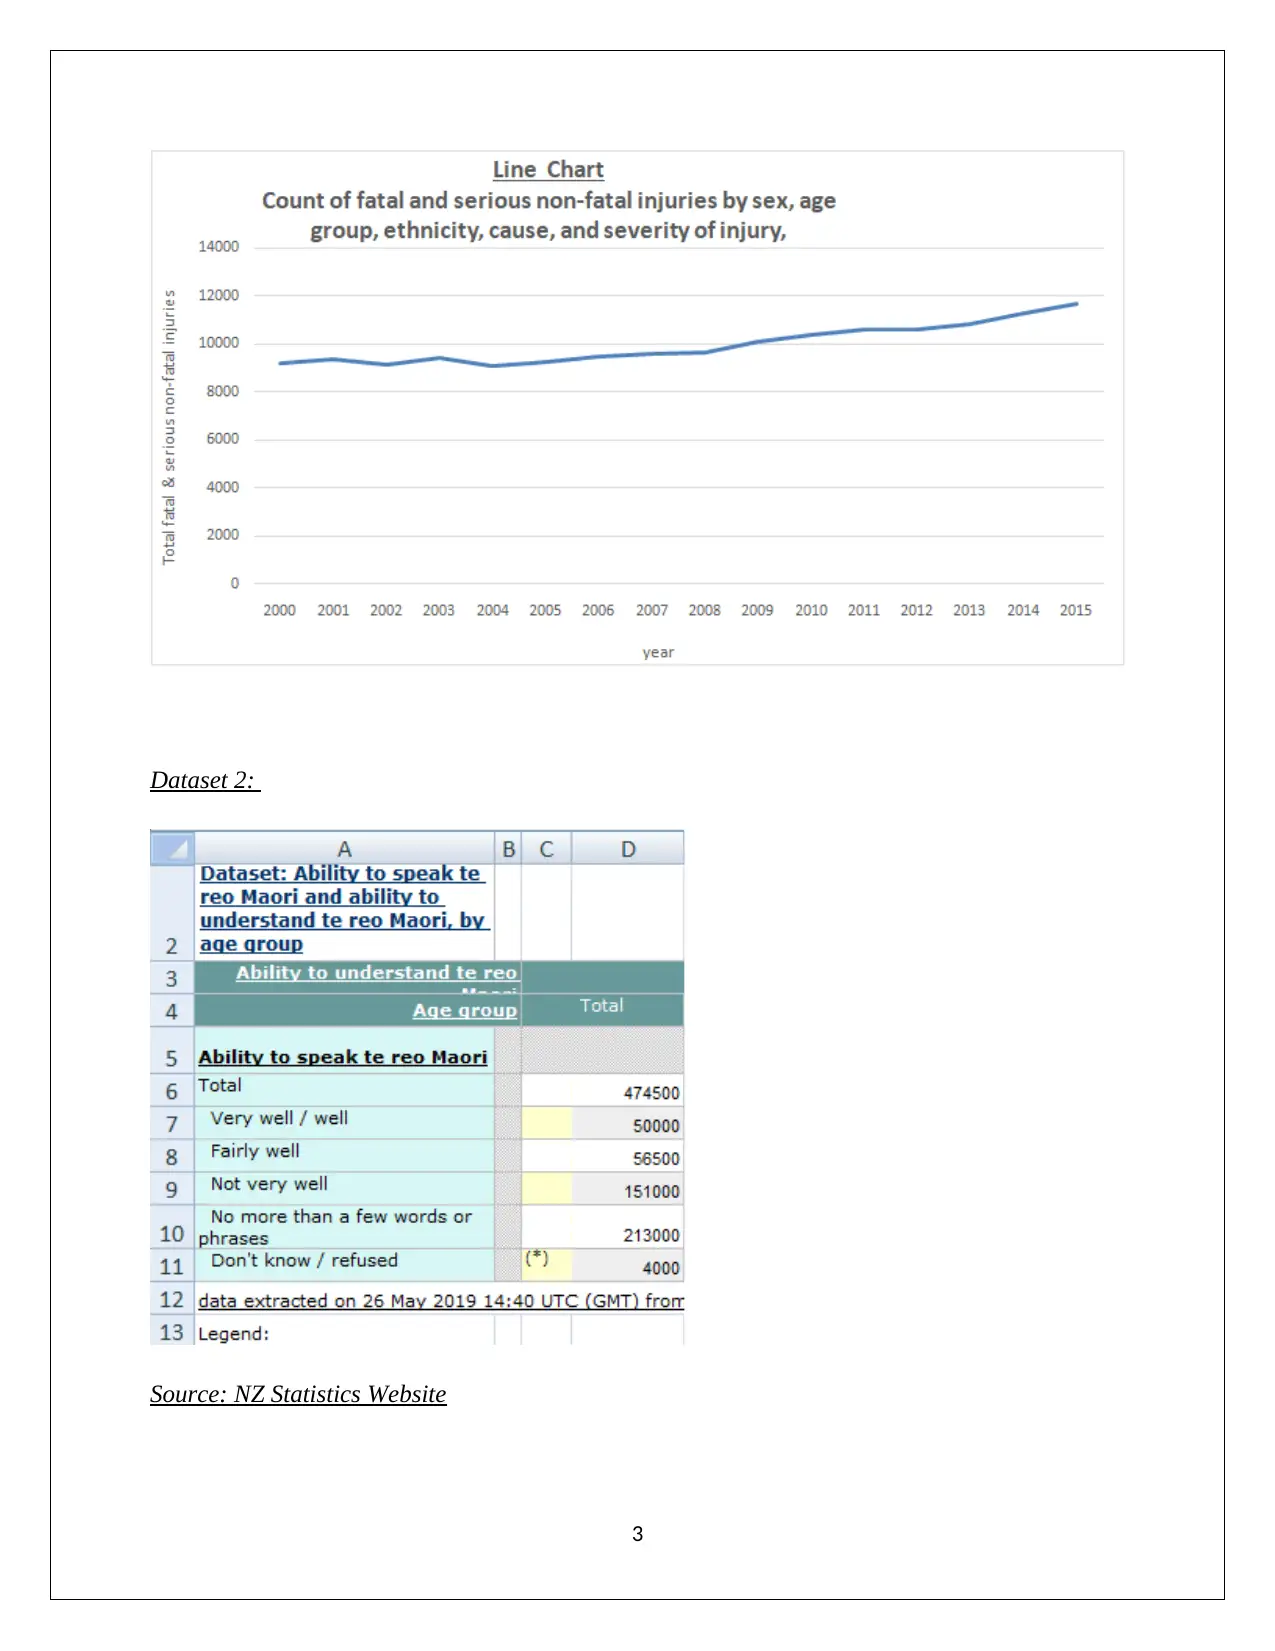
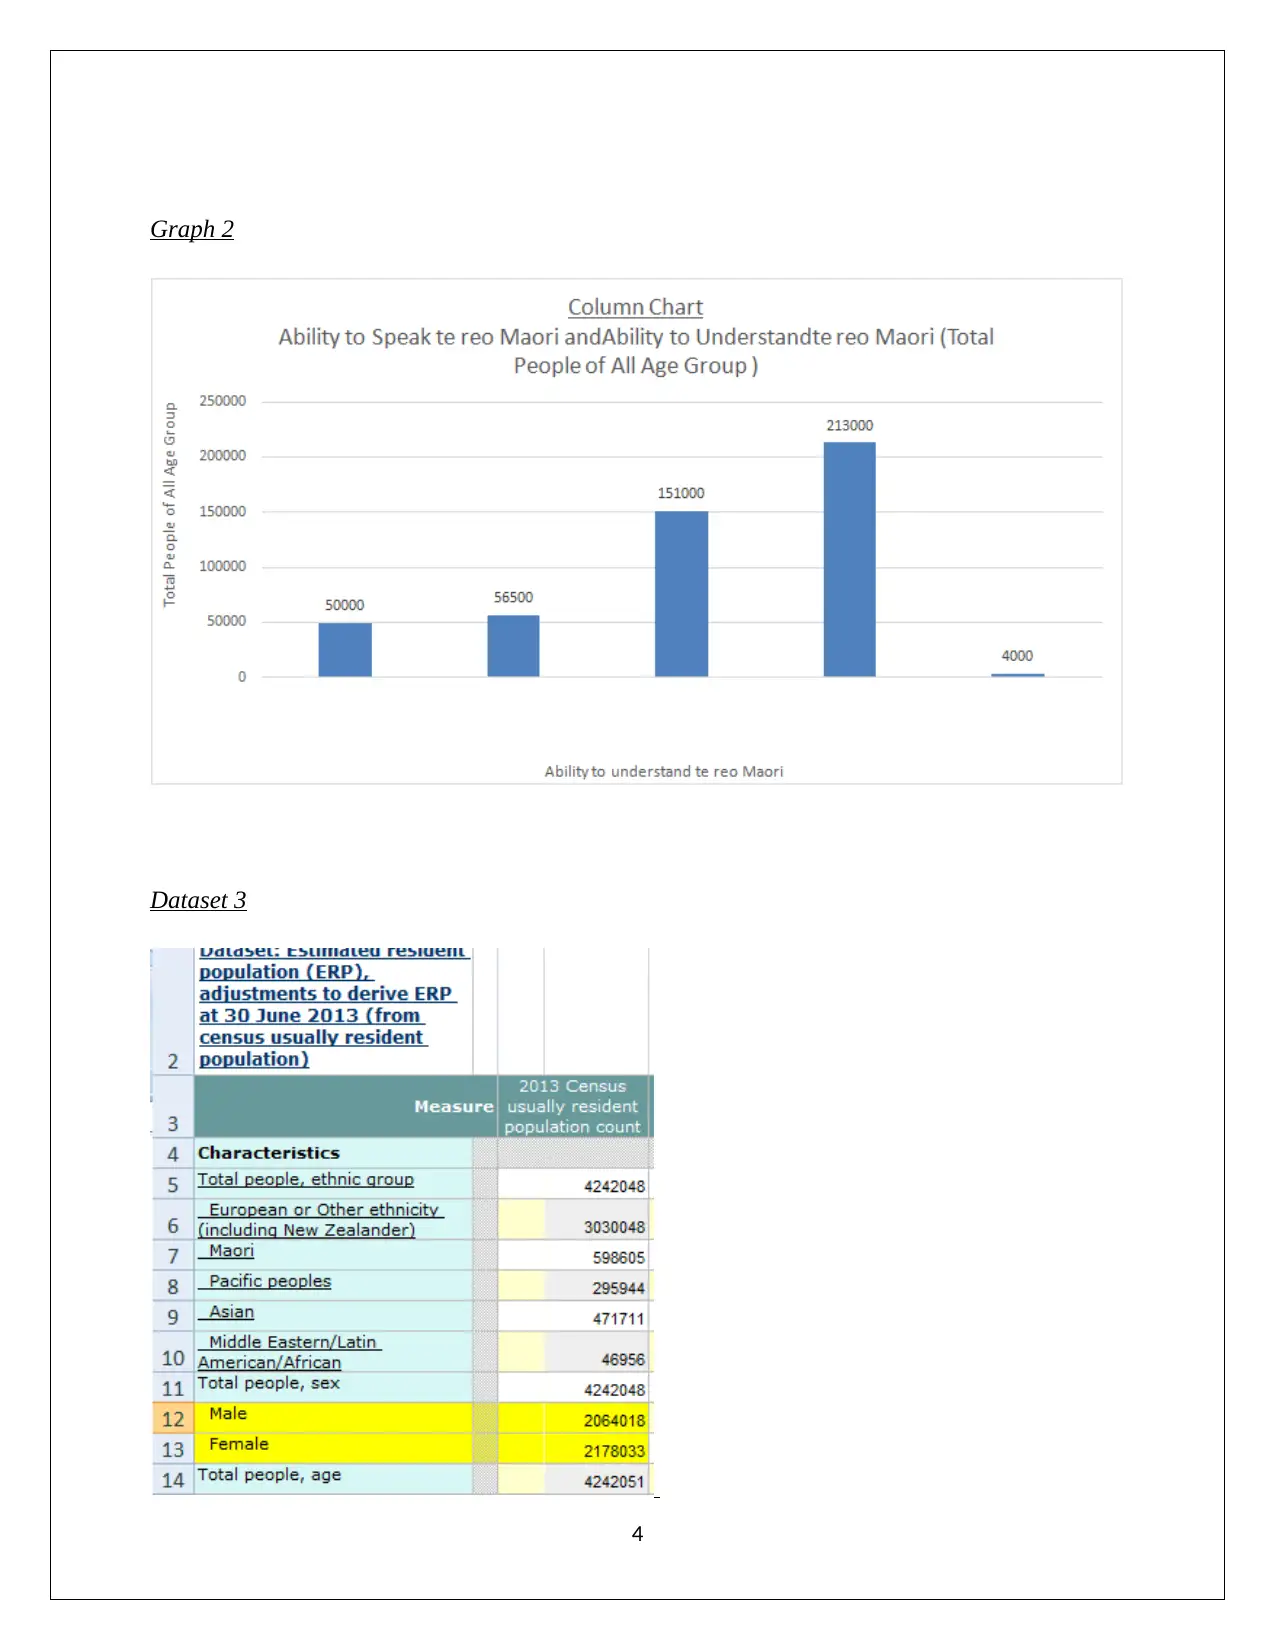
This assignment solution for a quantitative analysis course, BU5.05, addresses several key areas of statistical analysis. The solution begins with a graphical data analysis, interpreting trends and patterns from various datasets sourced from the NZ Statistics website. The solution then delves into descriptive statistics, calculating and explaining the mean, median, range, and inter-quartile range for a given dataset. This section includes analysis of age and marks obtained in assignment, test and exam. The assignment also explores different sampling methods, including simple random sampling, stratified random sampling, systematic random sampling, and convenience sampling, while also addressing potential biases in sampling techniques. Finally, the solution examines measures of variation, comparing the coefficient of variation, inter-quartile range, and range to assess data dispersion across different variables. The assignment adheres to the guidelines set for Term 2, 2019 and is a valuable resource for students studying quantitative analysis.
Document Page
QUANTITATIVE ANALYSIS
STUDENT ID:
[Pick the date]
tabler-icon-diamond-filled.svg

Secure Best Marks with AI Grader

Need help grading? Try our AI Grader for instant feedback on your assignments.
Document Page
Question 1
i) The graphical illustration of the various data obtained from Statistics NZ website is shown
below.
Dataset 1:
Source: NZ Statistics Website
Graph 1
2
Document Page
Dataset 2:
Source: NZ Statistics Website
3
Document Page
Graph 2
Dataset 3
4
tabler-icon-diamond-filled.svg

Secure Best Marks with AI Grader

Need help grading? Try our AI Grader for instant feedback on your assignments.
Document Page
Source: NZ Statistics Website
Graph 3
ii) The observations about each graph are shown below.
Graph1
There is an overall increasing trend of total injuries over the years.
The rate of increase seems to have increased from 2011 onwards as compared to the
previous years.
Graph 2
There are very limited people who can speak and understand very well/well.
The observations tend to increase with regards to Maori language as the level of ability is
reduced.
Graph 3
5
Document Page
The sex ratio is in favor of females who have more representation
The overall population is quite small and not large.
Question 2
(i) The requisite descriptive statistics pertaining to the given data is shown below.
(ii) The chosen four statistics are mean, median, range and inter-quartile range. The definition
and explanation of these statistics is as offered below (Flick,2015).
Mean – This indicates the average value of the given variable. It is apparent that mean
age of the test takers is 27.25 years. With regards to marks, lowest mean score are visible
for test while the highest average marks are visible for assignment.
Median – This indicates the value which 50% of the sample observations do not cross.
Hence in context of the age, 12 test takers do not exceed 25 years in age. Highest median
with regards to marks is visible for exam
Range – It is difference between the maximum and minimum value for a given variable.
The range for age is 36 years which is quite high and indicative of high dispersion. The
final mark has the lowest range amongst all the marks as the difference between the
highest and lowest mark is the least. This may be on account of final mark being the
weighted average of marks in assignment, test and exam.
Inter-quartile range- This represents the range within which the middle 50% of the values
of the variables lie. This is a measure of the dispersion in the underlying variable. With
regards to age, it is evident that the middle 50% of the age values would lie in an interval
6
Document Page
of 8.50 years. In case of marks, the minimum IQR is witnessed for final work where the
middle 50% of the values lie within 21.06 marks.
Question 3
(i) The various four sampling methods are highlighted below (Eriksson & Kovalainen, 2015).
Simple random sampling - In this case, on random basis samples are selected from the
population. A key aspect is that every element in the population has equal chance of
being selection. Selecting 10 students randomly from a class of 100 students is simple
random sampling.
Stratified random sampling - In this case, the first step is to divide the population as per
key attributes. In the second step, random selection is done from the different groups in
proportion to their representation in the population. For instance, in a class of 100
students , there are 40 females and 60 males. As a result, 4 students are randomly selected
from females and 6 students are randomly selected from males.
Systematic random sampling – This is also a type of random sampling whereby random
objects are selected but in a systematic manner. For instance, for selecting 10 students out
of 100, the students would be arranged in rows of 10 students each and last person in
each row would be selected.
Convenience sampling – This is a non-probability sampling technique where the samples
are selected on availability or convenience. Thereby , if in a school, 10 students from a
particular class are to be selected for a survey, then these would be first 10 students of
that class which the researcher meets irrespective of other criterion and attributes.
(ii) Bias in sampling is caused when the resultant sample does not faithfully represent the
underlying population. There may be different types of bias that can be potentially
introduced at different stages such as choosing sample, collecting data etc. In order to
reduce the bias in sampling, it is advisable that probability based sampling technique must
be used (Hillier, 2016).
7
tabler-icon-diamond-filled.svg

Paraphrase This Document

Need a fresh take? Get an instant paraphrase of this document with our AI Paraphraser
Document Page
Question 4
Three measure of variation are indicated below.
1) Coefficient of variation – This is a superior measure in comparison to standard deviation
as this highlights standard deviation per unit mean. As a result, for different variables
while standard deviation cannot be compared to compare variation but this is not true for
coefficient of variation (Hair, Wolfinbarger, Money, Samouel & Page, 2015). For the
given data, coefficient of variation is compared across different variables such as age and
marks. The conclusion is that the minimum variation is observed for Final marks while
maximum variation is observed for assignment marks.
2) Inter-quartile range - This represents the range within which the middle 50% of the
values of the variables lie. This is quite useful for variables whose distribution is skewed
as standard deviation is quite sensitive to extreme values on either side. This is not the
case with inter-quartile range (Flick, 2015). With regards to age, it is evident that the
middle 50% of the age values would lie in an interval of 8.50 years. In case of marks, the
minimum IQR is witnessed for final work where the middle 50% of the values lie within
21.06 marks.
3) Range - It is difference between the maximum and minimum value for a given variable.
The range for age is 36 years which is quite high and indicative of high dispersion. The
final mark has the lowest range amongst all the marks as the difference between the
highest and lowest mark is the least. This may be on account of final mark being the
weighted average of marks in assignment, test and exam (Hastie, Tibshirani & Friedman,
2016).
8
Document Page
References
Eriksson, P. & Kovalainen, A. (2015). Quantitative methods in business research (3rded.).
London: Sage Publications.
Flick, U. (2015). Introducing research methodology: A beginner's guide to doing a research
project (4thed.). New York: Sage Publications.
Hair, J. F., Wolfinbarger, M., Money, A. H., Samouel, P., & Page, M. J. (2015). Essentials of
business research methods (2nded.). New York: Routledge.
Hastie, T., Tibshirani, R. & Friedman, J. (2016). The Elements of Statistical Learning
(4thed.). New York: Springer Publications.
Hillier, F. (2016).Introduction to Operations Research.(6thed.). New York: McGraw Hill
Publications.
9
chevron_up_icon
1 out of 9
circle_padding
hide_on_mobile
zoom_out_icon
[object Object]