Detailed Quantitative Analysis Report: Footwear User Study Data
VerifiedAdded on 2021/06/14
|8
|1944
|29
Report
AI Summary
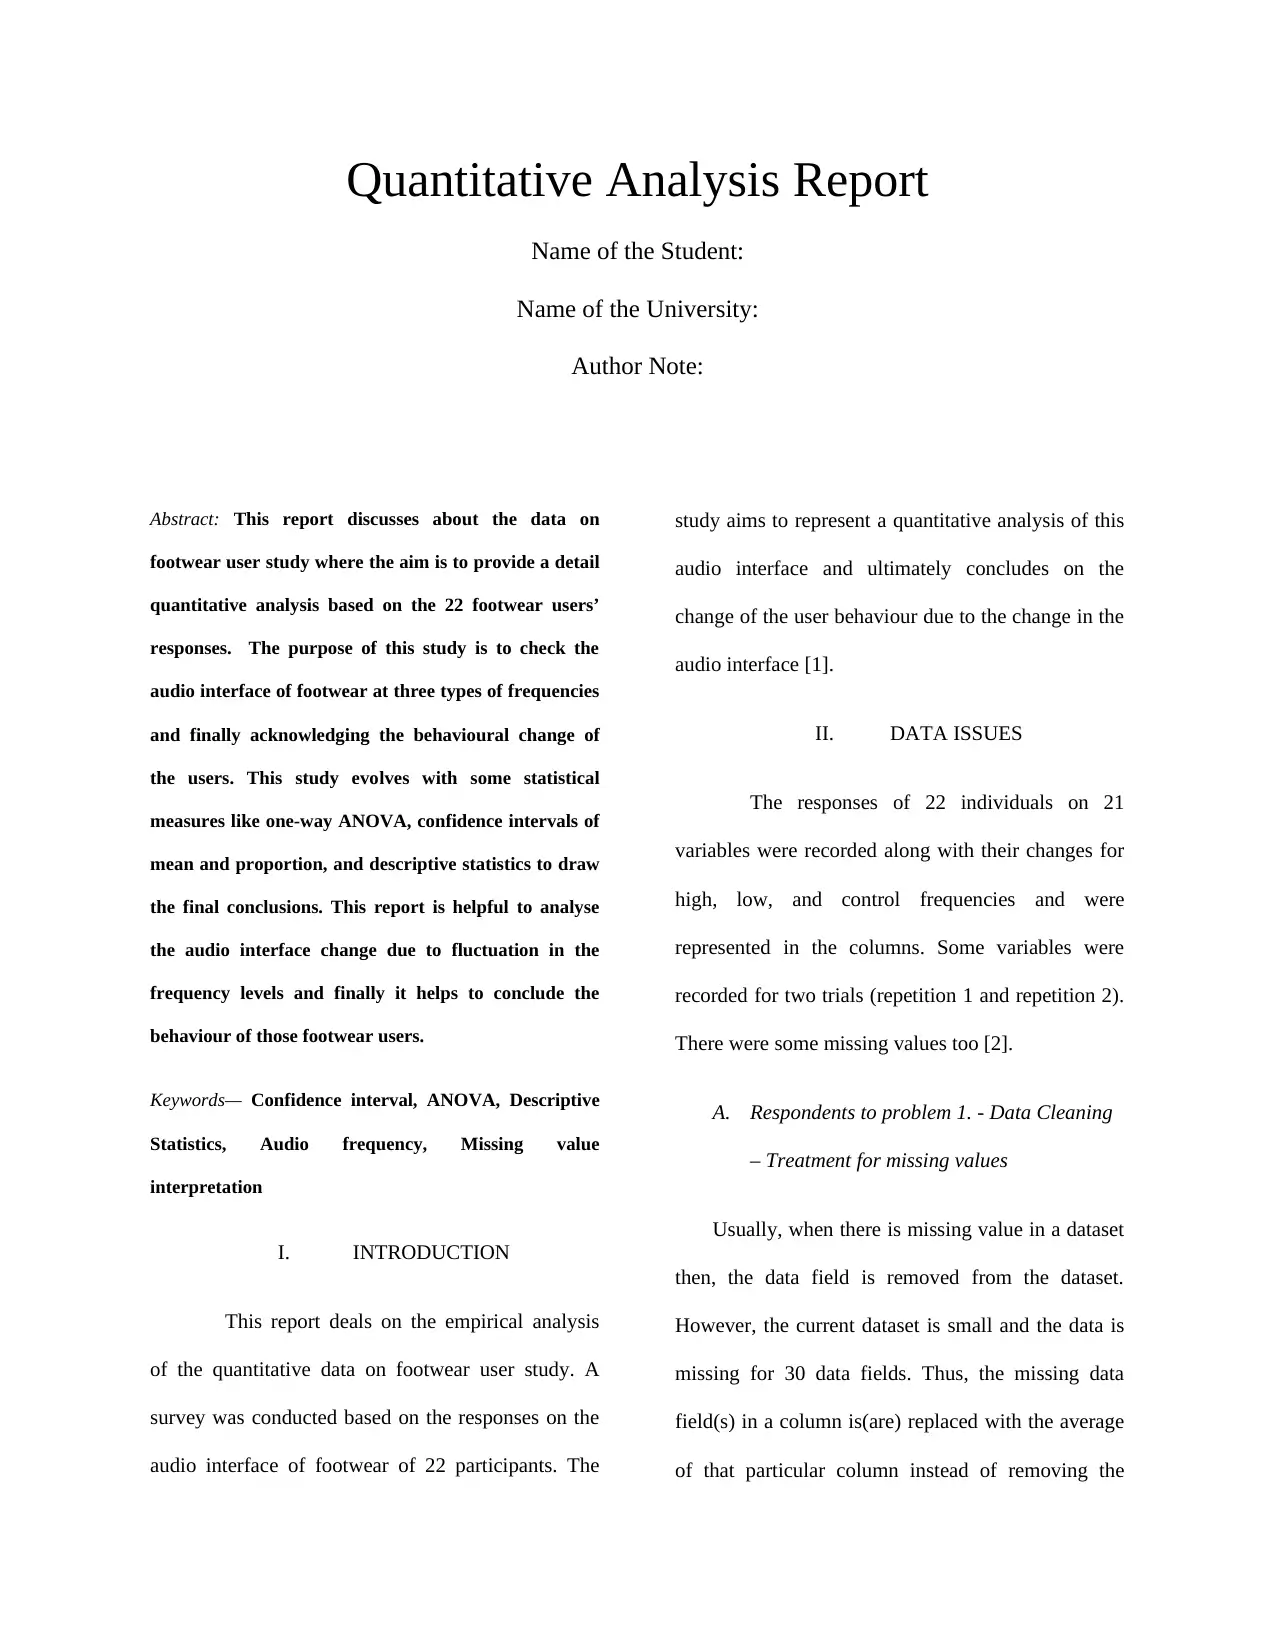
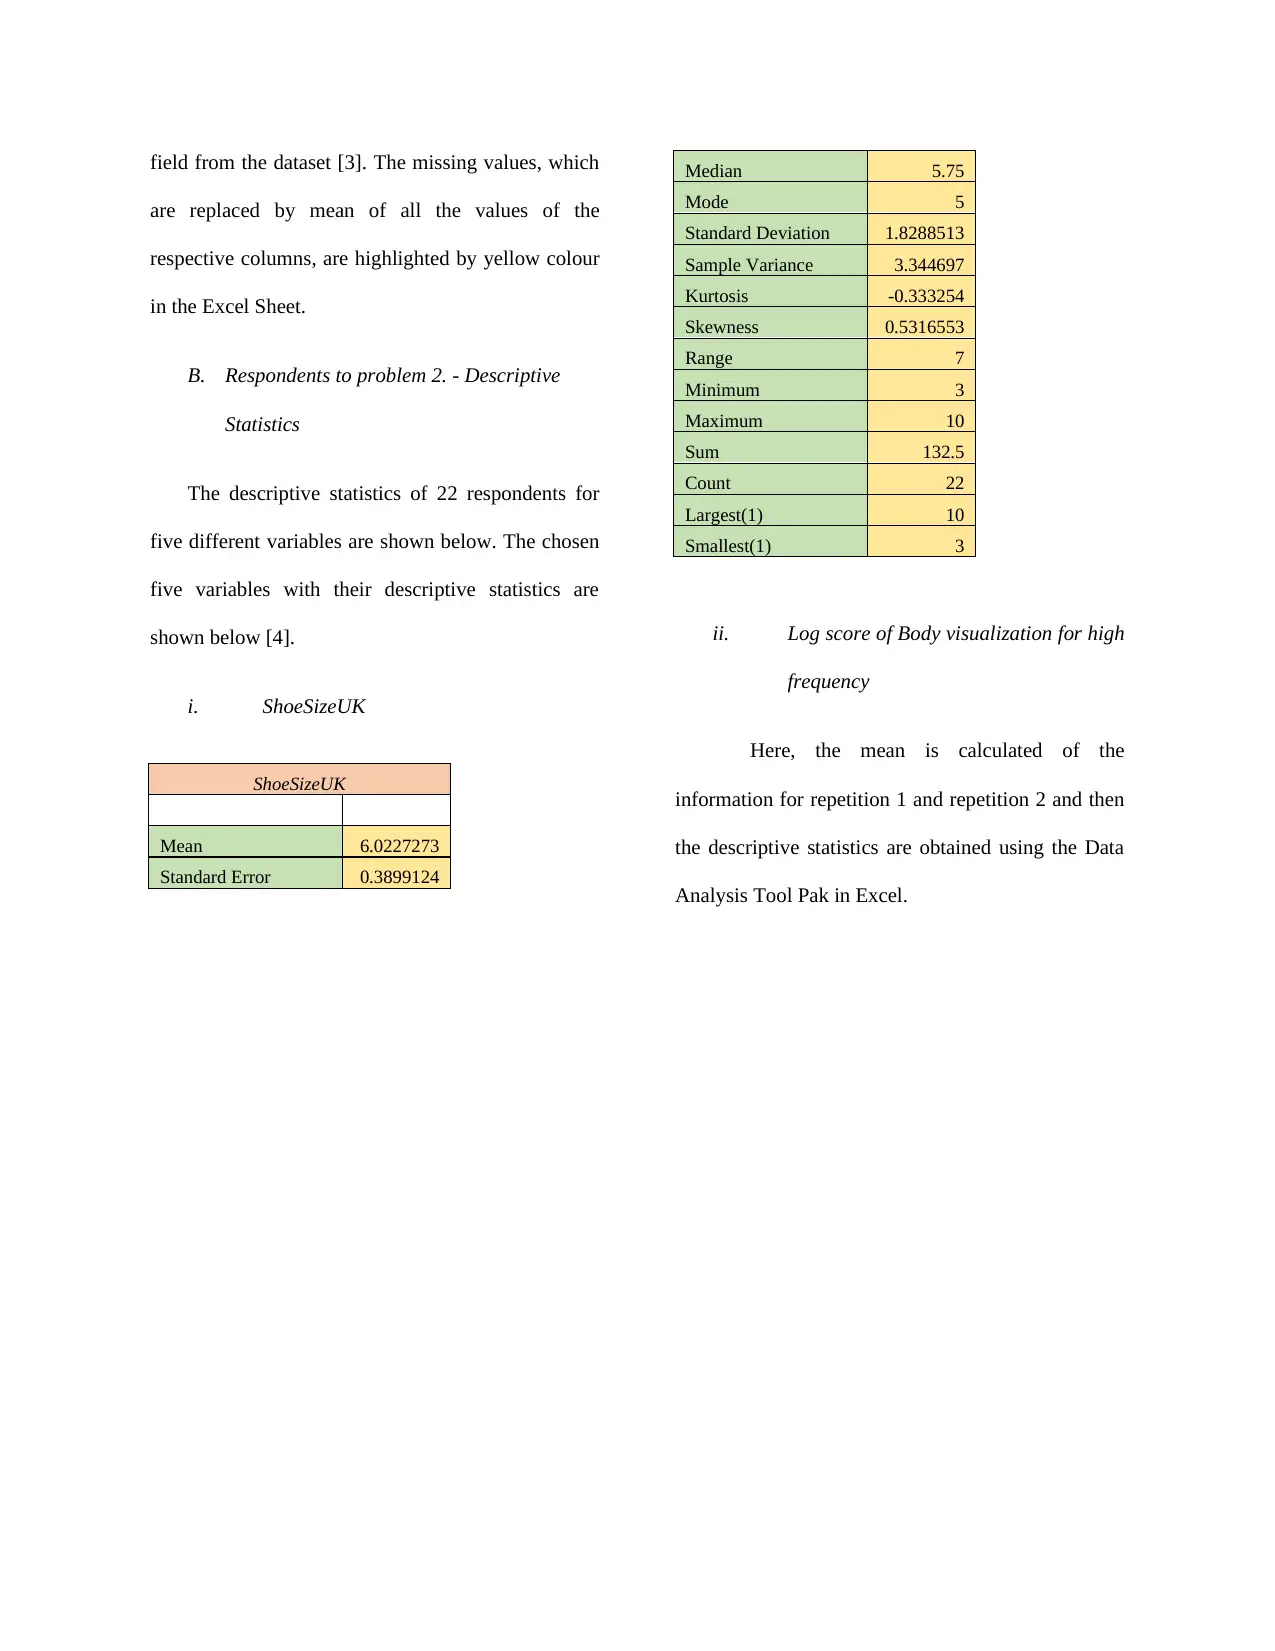
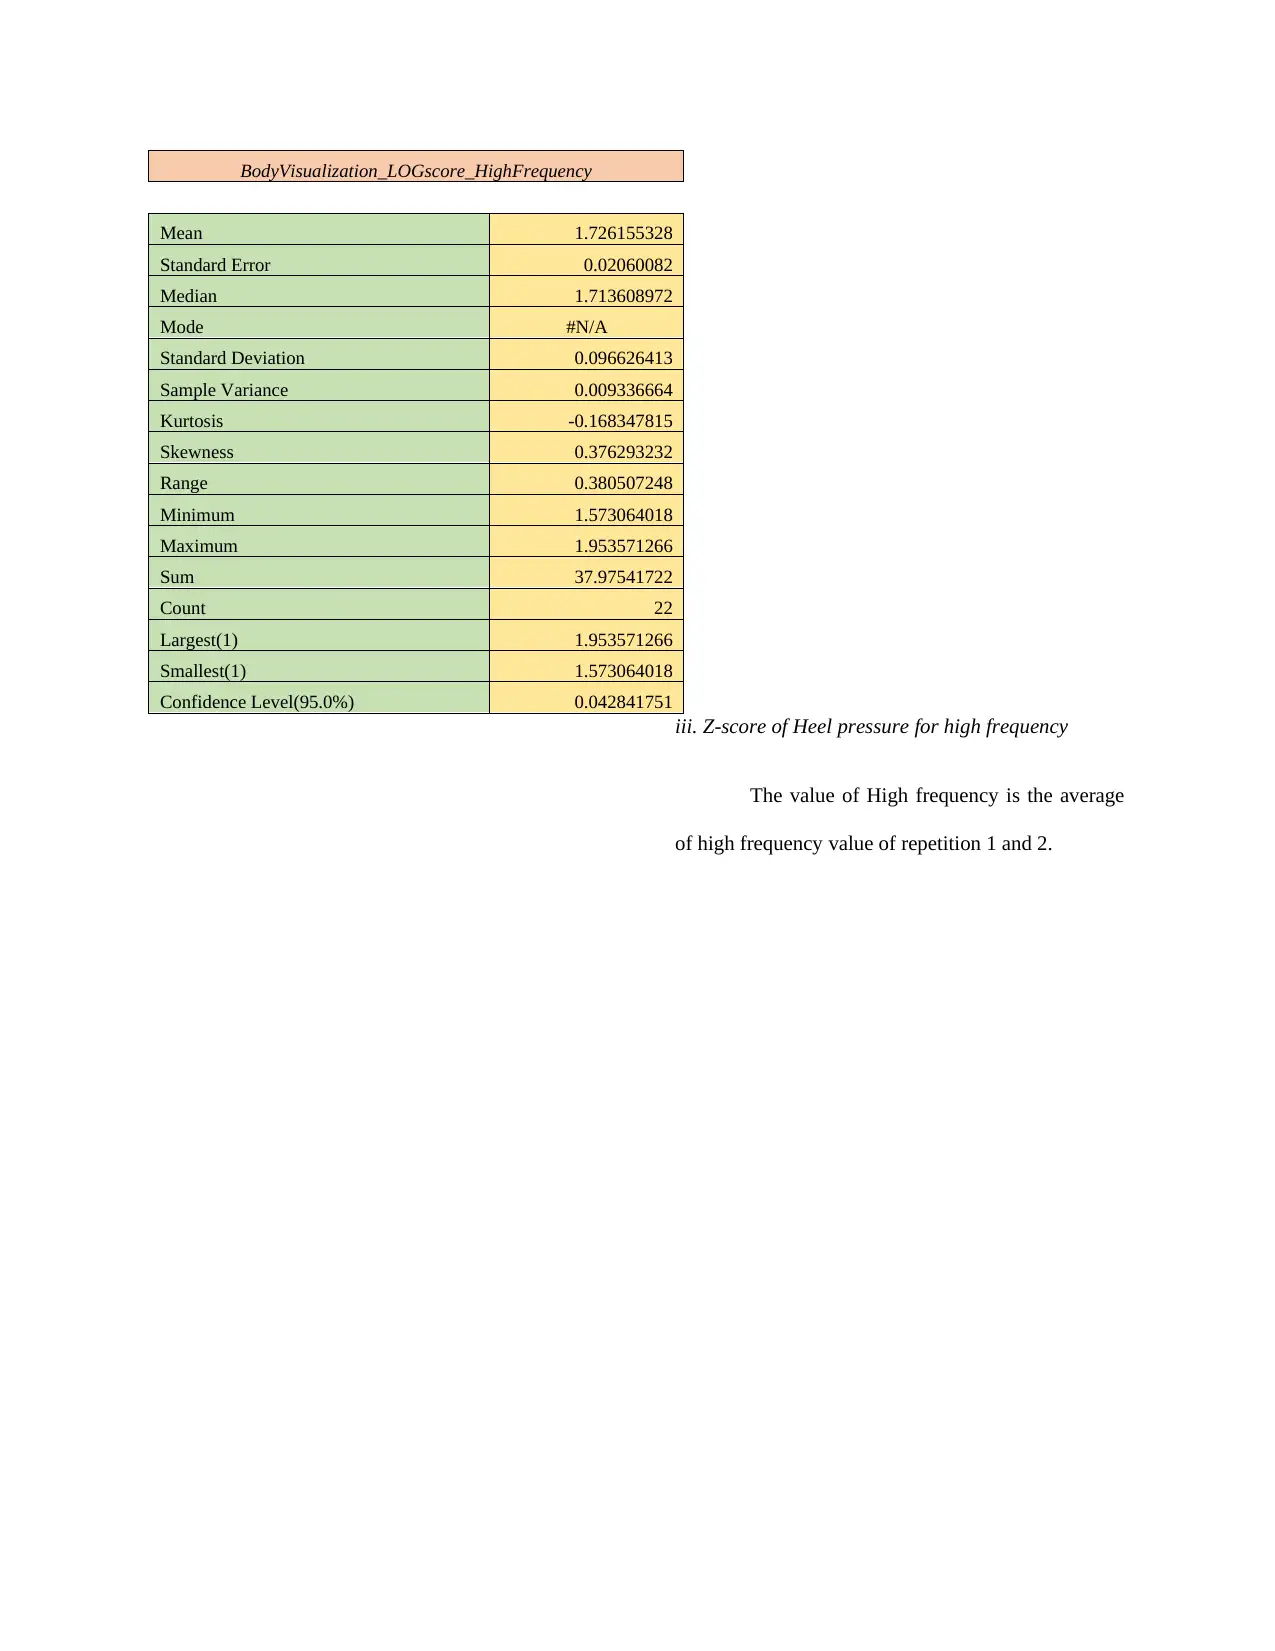
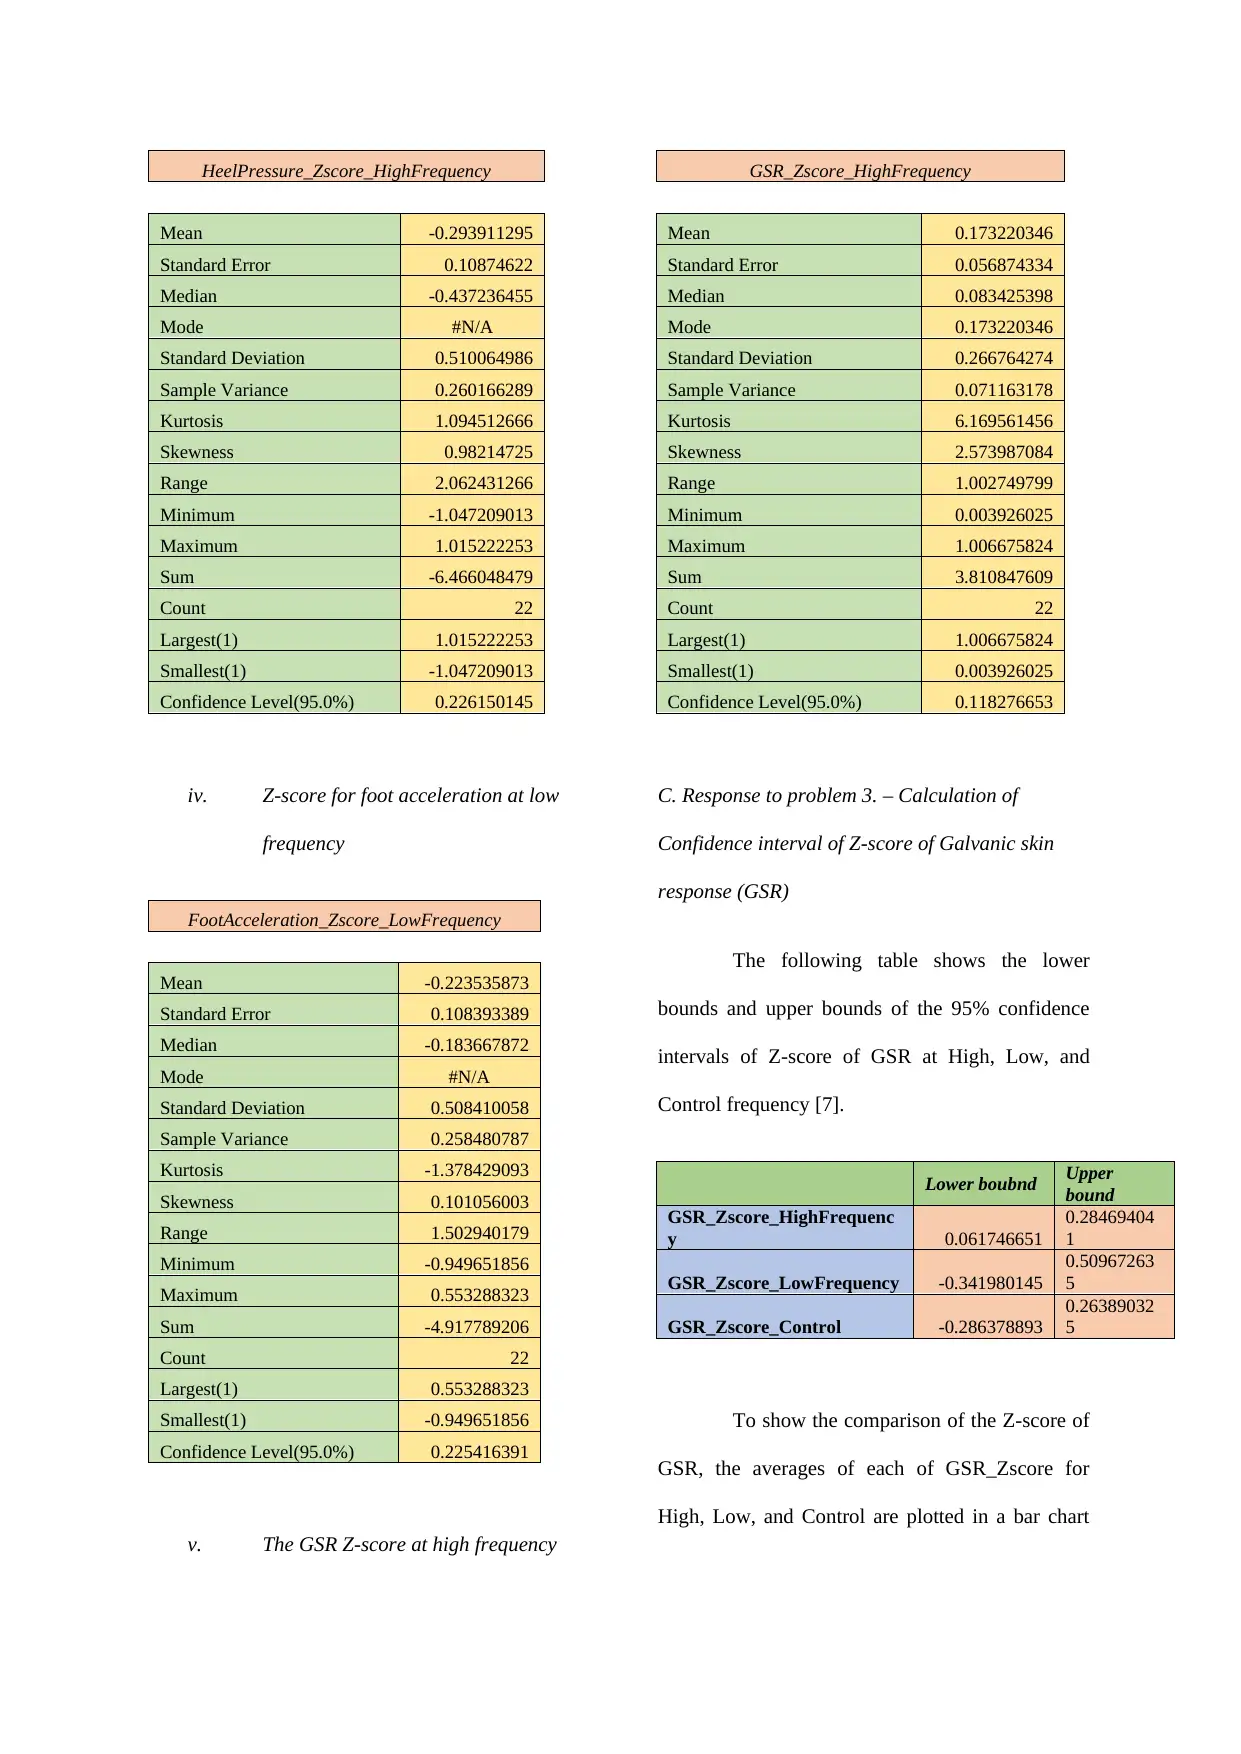
This report presents a quantitative analysis of a footwear user study, focusing on the impact of audio interface changes on user behavior. The study, based on responses from 22 participants, employs statistical methods such as one-way ANOVA, confidence intervals, and descriptive statistics to analyze the data. The report addresses data issues, including missing values, which were handled by replacing them with column averages. Descriptive statistics are provided for variables like shoe size and log scores. The analysis includes the calculation of confidence intervals for GSR Z-scores and the proportion of positive valence, visualized through bar charts to compare the effects of high, low, and control frequencies. Research questions are addressed using ANOVA to determine the effect of audio frequencies on toe pressure, foot acceleration, and arousal levels. The report concludes that the audio interface is influenced by frequency changes and that this analysis is useful for deciding which variables affect footwear interface and user behavior.

Quantitative Analysis Report
Name of the Student:
Name of the University:
Author Note:
Abstract: This report discusses about the data on
footwear user study where the aim is to provide a detail
quantitative analysis based on the 22 footwear users’
responses. The purpose of this study is to check the
audio interface of footwear at three types of frequencies
and finally acknowledging the behavioural change of
the users. This study evolves with some statistical
measures like one-way ANOVA, confidence intervals of
mean and proportion, and descriptive statistics to draw
the final conclusions. This report is helpful to analyse
the audio interface change due to fluctuation in the
frequency levels and finally it helps to conclude the
behaviour of those footwear users.
Keywords— Confidence interval, ANOVA, Descriptive
Statistics, Audio frequency, Missing value
interpretation
I. INTRODUCTION
This report deals on the empirical analysis
of the quantitative data on footwear user study. A
survey was conducted based on the responses on the
audio interface of footwear of 22 participants. The
study aims to represent a quantitative analysis of this
audio interface and ultimately concludes on the
change of the user behaviour due to the change in the
audio interface [1].
II. DATA ISSUES
The responses of 22 individuals on 21
variables were recorded along with their changes for
high, low, and control frequencies and were
represented in the columns. Some variables were
recorded for two trials (repetition 1 and repetition 2).
There were some missing values too [2].
A. Respondents to problem 1. - Data Cleaning
– Treatment for missing values
Usually, when there is missing value in a dataset
then, the data field is removed from the dataset.
However, the current dataset is small and the data is
missing for 30 data fields. Thus, the missing data
field(s) in a column is(are) replaced with the average
of that particular column instead of removing the
Paraphrase This Document
Need a fresh take? Get an instant paraphrase of this document with our AI Paraphraser

field from the dataset [3]. The missing values, which
are replaced by mean of all the values of the
respective columns, are highlighted by yellow colour
in the Excel Sheet.
B. Respondents to problem 2. - Descriptive
Statistics
The descriptive statistics of 22 respondents for
five different variables are shown below. The chosen
five variables with their descriptive statistics are
shown below [4].
i. ShoeSizeUK
ShoeSizeUK
Mean 6.0227273
Standard Error 0.3899124
Median 5.75
Mode 5
Standard Deviation 1.8288513
Sample Variance 3.344697
Kurtosis -0.333254
Skewness 0.5316553
Range 7
Minimum 3
Maximum 10
Sum 132.5
Count 22
Largest(1) 10
Smallest(1) 3
ii. Log score of Body visualization for high
frequency
Here, the mean is calculated of the
information for repetition 1 and repetition 2 and then
the descriptive statistics are obtained using the Data
Analysis Tool Pak in Excel.

BodyVisualization_LOGscore_HighFrequency
Mean 1.726155328
Standard Error 0.02060082
Median 1.713608972
Mode #N/A
Standard Deviation 0.096626413
Sample Variance 0.009336664
Kurtosis -0.168347815
Skewness 0.376293232
Range 0.380507248
Minimum 1.573064018
Maximum 1.953571266
Sum 37.97541722
Count 22
Largest(1) 1.953571266
Smallest(1) 1.573064018
Confidence Level(95.0%) 0.042841751
iii. Z-score of Heel pressure for high frequency
The value of High frequency is the average
of high frequency value of repetition 1 and 2.
⊘ This is a preview!⊘
Do you want full access?
Subscribe today to unlock all pages.

Trusted by 1+ million students worldwide

HeelPressure_Zscore_HighFrequency
Mean -0.293911295
Standard Error 0.10874622
Median -0.437236455
Mode #N/A
Standard Deviation 0.510064986
Sample Variance 0.260166289
Kurtosis 1.094512666
Skewness 0.98214725
Range 2.062431266
Minimum -1.047209013
Maximum 1.015222253
Sum -6.466048479
Count 22
Largest(1) 1.015222253
Smallest(1) -1.047209013
Confidence Level(95.0%) 0.226150145
iv. Z-score for foot acceleration at low
frequency
FootAcceleration_Zscore_LowFrequency
Mean -0.223535873
Standard Error 0.108393389
Median -0.183667872
Mode #N/A
Standard Deviation 0.508410058
Sample Variance 0.258480787
Kurtosis -1.378429093
Skewness 0.101056003
Range 1.502940179
Minimum -0.949651856
Maximum 0.553288323
Sum -4.917789206
Count 22
Largest(1) 0.553288323
Smallest(1) -0.949651856
Confidence Level(95.0%) 0.225416391
v. The GSR Z-score at high frequency
GSR_Zscore_HighFrequency
Mean 0.173220346
Standard Error 0.056874334
Median 0.083425398
Mode 0.173220346
Standard Deviation 0.266764274
Sample Variance 0.071163178
Kurtosis 6.169561456
Skewness 2.573987084
Range 1.002749799
Minimum 0.003926025
Maximum 1.006675824
Sum 3.810847609
Count 22
Largest(1) 1.006675824
Smallest(1) 0.003926025
Confidence Level(95.0%) 0.118276653
C. Response to problem 3. – Calculation of
Confidence interval of Z-score of Galvanic skin
response (GSR)
The following table shows the lower
bounds and upper bounds of the 95% confidence
intervals of Z-score of GSR at High, Low, and
Control frequency [7].
Lower boubnd Upper
bound
GSR_Zscore_HighFrequenc
y 0.061746651
0.28469404
1
GSR_Zscore_LowFrequency -0.341980145
0.50967263
5
GSR_Zscore_Control -0.286378893
0.26389032
5
To show the comparison of the Z-score of
GSR, the averages of each of GSR_Zscore for
High, Low, and Control are plotted in a bar chart
Paraphrase This Document
Need a fresh take? Get an instant paraphrase of this document with our AI Paraphraser

and the corresponding error bars are added to show
the changes due to margins of errors.
From the above bar chart, it is seen that
the change in the audio interface is mostly affected
by the high frequency, rather than low frequency
and control. The Z-scores due to high frequency are
above 0.17 with a confidence level of 0.111, which
implies that there is 88% chance for the Z-scores
with high frequency to fall within that confidence
interval.
D. Response to problem 4. - Calculation of
Confidence interval for the proportion of positive
valence
The number of positive valence is
calculated in Excel using the COUNTIF function
and then the proportion is calculated by dividing
the positive valence by 22. The confidence interval
of one-sample proportion can be calculated by the
formula,
Where, p̂ = sample proportion, z =
confidence coefficient which is equal to 1.96 for
95% confidence interval. The table below shows
the lower bounds and upper bounds of the
proportion of positive valence for High, Low, and
Control frequency.
Lower
Boun
d
Upper
Bound
Proportion of Positive
Valence_high frequency
0.513
9 0.8952
Proportion of Positive
Valrnce_low frequency
0.268
6 0.6860
Proportion of Positive
Valrnce_control
0.203
6 0.6145
The bar chart is shown below to show the
comparison among the confidence intervals of the
proportion of the positive valence for high, low,
and control frequencies. The average of the
proportion for the two repetitions has been taken
for better result [5].
Proportion of
Positive
Valence_high
frequency
Proportion of
Positive
Valrnce_low
frequency
Proportion of
Positive
Valrnce_control
0
0.1
0.2
0.3
0.4
0.5
0.6
0.7
0.8 0.7045454545
45455
0.4772727272
72727 0.4090909090
90909
Proportion
The above bar chart shows that the high
frequency bar has the highest proportion of positive
valence with the confidence level 0.38 and there is
61% confidence that the future samples of
proportion of positive valence will fall within that

confidence interval. The proportion gradually
decreases from high frequency to control.
E. Research Questions and Answer
i. Research Question 1: Does toe
pressure change with different audio frequencies?
A one-way ANOVA is constructed where
the treatment is Toe-pressure and the variation of
audio interface can be present due to variation in
the frequency level. The repetition 1 and repetition
2 are averaged for each frequency.
The null hypothesis for the ANOVA is
any difference between the three frequencies is due
to chance which means the mean values are equal
for all. From the ANOVA table above, it can be
seen that at 5% level of significance, the p-value =
0.018 (< α =0.05). Therefore, the null hypothesis is
rejected and there is at least one difference in the
mean values and the audio interface is influenced
by the change in the frequency [8].
i. Research Question 2: Does foot
acceleration change with different
audio frequencies?
A one-way ANOVA is constructed where
the treatment is Foot-acceleration and the null
hypothesis is the same as above. The repetition
1 and repetition 2 are averaged for each
frequency.
The p-value = 0.002491 < the level of
significance = 0.05 which leads the null
hypothesis to be rejected. Therefore, the
variation is present due to change in the
frequency level.
ii. Research Question 3: Does Arousal
change with different audio
frequencies?
Here a one-way ANOVA is plotted
where the treatment is Arousal and the
classes of Arousal variable are based on
high frequency, low frequency, and
control. The data for each frequency has
been recorded for two trials. Thus, an
average value of the data of repetition 1
and the data of repetition 2 is taken. After
⊘ This is a preview!⊘
Do you want full access?
Subscribe today to unlock all pages.

Trusted by 1+ million students worldwide

that, the One- way ANOVA is carried out
to check the difference in the means for
the change in the audio frequencies. Here,
the null hypothesis is that there is no
difference in the means among the classes
of the treatment variable [6]. The ANOVA
table is shown below.
At 95% confidence level, α=level of
significance = 0.05 < the p-value = 0.38. Thus,
the null hypothesis is accepted and it can be
concluded that there no change in the mean
value of the arousal variable due to frequency
and any change is only due to chance.
III. CONCLUSION
The above report highlights the change in
the audio interface is whether due to chance or
only due to frequency. Besides, it also
elaborately describes the descriptive statistics
of five randomly chosen variables. This
quantitative analysis is useful to decide which
variables are affecting how much for the
footwear interface and how it affects the
behavioural changes of the footwear users.
IV. REFERENCES
[1] J. Lewis, "Usability: Lessons Learned …
and Yet to Be Learned", International Journal
of Human-Computer Interaction, vol. 30, no.
9, pp. 663-684, 2014.
[2] G. Cumming, Understanding the new
statistics. New York: Routledge, 2012.
[3] A. Hayes and K. Preacher, "Statistical
mediation analysis with a multicategorical
independent variable", 2014. [Online].
Available:
https://pdfs.semanticscholar.org/dd3f/1055005
bda517a081c4949ad9a348b7127b3.pdf.
[Accessed: 18- May- 2018].
[4] M. Triola, Elementary Statistics Using
Excel. Pearson, 2013.
[5] D. Treiman, "Quantitative Data Analysis",
Google Books, 2018. [Online]. Available:
https://books.google.co.in/books?
hl=en&lr=&id=c-
fOAgAAQBAJ&oi=fnd&pg=PR5&dq=quantit
ative+analysis+in+statistics&ots=gR2k6yr_LG
&sig=RrlmJvyaBJOFA1MZWAney7EIIuM&r
edir_esc=y#v=onepage&q=quantitative
%20analysis%20in%20statistics&f=false.
[Accessed: 18- May- 2018].
Paraphrase This Document
Need a fresh take? Get an instant paraphrase of this document with our AI Paraphraser

[6] "Quantitative Data Analysis", Google
Books, 2018. [Online]. Available:
https://books.google.co.in/books?
hl=en&lr=&id=cfOAgAAQBAJ&oi=fnd&pg=
PR5&dq=quantitative+analysis+in+statistics&
ots=gR2k6yr_LG&sig=RrlmJvyaBJOFA1MZ
WAney7EIIuM&redir_esc=y#v=onepage&q=
quantitative%20analysis%20in
%20statistics&f=false. [Accessed: 18- May-
2018].
[7] J. Muller, W. Pet, E. Pet-Reatsch, R.
Servaas, F. Ansems, D. Schwander, G. Firer,
H. Lothaller and P. Endler, "Repeatability of
Measurements of Galvanic Skin Response – A
Pilot Study", Ww.inter-uni.net, 2013. [Online].
Available:
http://ww.inter-uni.net/static/download/publica
tion/komplementaer/
p_Muller_et_al_+OCMJ_2013+_Repeatability
_Galvanic_Skin_Response.pdf. [Accessed: 18-
May- 2018].
[8] J. Hox, M. Moerbeek and R. Van de
Schoot, Multilevel Analysis.
1 out of 8
Related Documents

Your All-in-One AI-Powered Toolkit for Academic Success.
+13062052269
info@desklib.com
Available 24*7 on WhatsApp / Email
Unlock your academic potential
Copyright © 2020–2025 A2Z Services. All Rights Reserved. Developed and managed by ZUCOL.