Quantitative Analysis: Australian Livestock Industry Project Report
VerifiedAdded on 2022/11/24
|10
|2475
|421
Project
AI Summary
This project analyzes the Australian livestock industry, specifically the cattle and sheep sectors, using quantitative methods and data provided by the Australian government. The analysis employs input-output tables and technology matrices to assess the economic impact of the livestock export industry. The project utilizes both Type I and Type II multipliers to determine the effects on various industries and the overall economy. The report includes discussions on livestock industrial findings, transport and support services, and economic knowledge related to the industry. A literature review and recommendations for the Austrian government analysis are also provided, along with conclusions and references. The project utilizes Excel calculations to support the analysis and findings, evaluating the economic strategy of the livestock industry.
Quantitative analysis
Student Name:
Register Number:
Submission Date:
1
Student Name:
Register Number:
Submission Date:
1
Paraphrase This Document
Need a fresh take? Get an instant paraphrase of this document with our AI Paraphraser
Table of Contents
Introduction.................................................................................................................................................................... 3
Discussion..................................................................................................................................................................... 3
Livestock industrial findings........................................................................................................................................ 3
Livestock on Type I multiplier ..................................................................................................................................... 3
Livestock on Type II multiplier..................................................................................................................................... 5
Transport and support service on Livestock industry..............................................................................................6
Economic knowledge on livestock industry...............................................................................................................6
Literature review............................................................................................................................................................ 7
Recommended for the Austria government analysis................................................................................................7
Conclusion..................................................................................................................................................................... 8
Reference....................................................................................................................................................................... 8
Appendix........................................................................................................................................................................ 9
2
Introduction
The main aim of this project to be implementing the livestock export industry on
the agriculture sector which is specified the cattle and sheep industry on the Monday
data analysis on the Australian government organization using excel calculation. In
Australian, The analyzing the cattle and sheep agriculture organization of the large
economy they can used for the technology matrix of the input and output table and
finding the impact on the Economic strategy they can used for the two methods that are
include the Type I multiplier, and Type II multiplier. The analyzing on the Type I data to
the economic range to be changed on the other industry and percentage of the output
which is denoted as dollars, and do not including the technology matrix on the spending
household they can used for the diving the each input by total input on the inverse
matrix on the interpretation of cattle and sheep industry will be investigated.
Discussion
This was a study published by Australia’s meat and livestock. Australia’s agriculture
sector, Livestock Export industry is assessed of the valuation of the export value of
cattle to the regional communities and the national economy. For this study, value is
added with multiple effects, Industry impact on participation in industries and regional
centers. Direct livestock value shows the chain producers, transporters (road and the
sea) and the fodder, Suppliers are the great recipients of income in terms of trading. It is
important for direct cemetery Revenue recipients, feedlot operators, agents, shearers,
feeder’s suppliers and Transporters. The role of production as a result of Australian
veterinary trade and relatively large distribution values, low illness, and appropriate
breeds are close to Australia's close market.
Livestock industrial findings
With Indonesia, the trade suspension impressed the industry and foreign nations,
where the animal welfare issues are integral for the Government of Australian, when the
livestock export trade issues are considered. Thus, there was the influence of the trade
suspension on the reputation of Australia in terms of a solid livestock provider. Similarly,
this has resulted in worry among the Australian communities who are associated with
trade, this prompted the Government of Australia to agree to provide a sizeable help
installments. Hence, it helped to cope up few welfare problems in terms of livestock that
are unfit to be dispatched due to the suspension.
Livestock on Type I multiplier
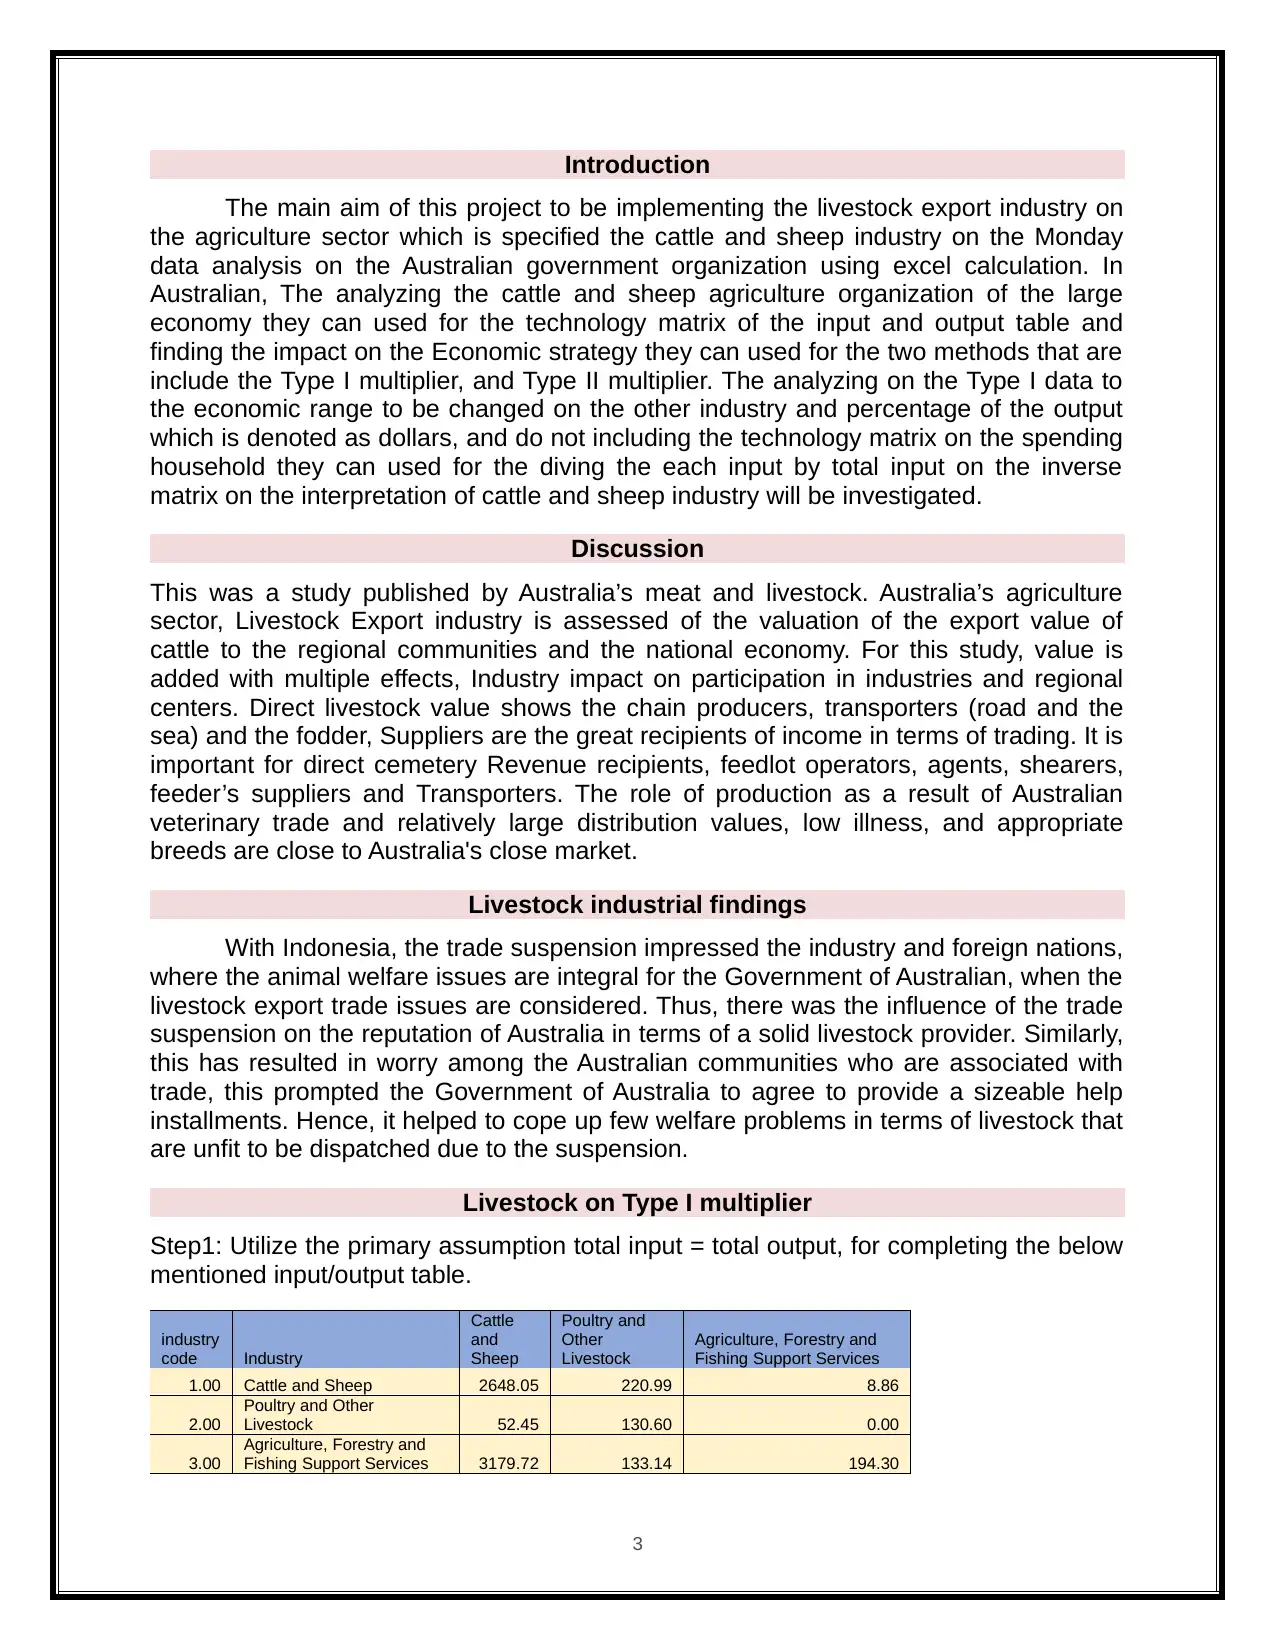
Step1: Utilize the primary assumption total input = total output, for completing the below
mentioned input/output table.
industry
code Industry
Cattle
and
Sheep
Poultry and
Other
Livestock
Agriculture, Forestry and
Fishing Support Services
1.00 Cattle and Sheep 2648.05 220.99 8.86
2.00
Poultry and Other
Livestock 52.45 130.60 0.00
3.00
Agriculture, Forestry and
Fishing Support Services 3179.72 133.14 194.30
3
The main aim of this project to be implementing the livestock export industry on
the agriculture sector which is specified the cattle and sheep industry on the Monday
data analysis on the Australian government organization using excel calculation. In
Australian, The analyzing the cattle and sheep agriculture organization of the large
economy they can used for the technology matrix of the input and output table and
finding the impact on the Economic strategy they can used for the two methods that are
include the Type I multiplier, and Type II multiplier. The analyzing on the Type I data to
the economic range to be changed on the other industry and percentage of the output
which is denoted as dollars, and do not including the technology matrix on the spending
household they can used for the diving the each input by total input on the inverse
matrix on the interpretation of cattle and sheep industry will be investigated.
Discussion
This was a study published by Australia’s meat and livestock. Australia’s agriculture
sector, Livestock Export industry is assessed of the valuation of the export value of
cattle to the regional communities and the national economy. For this study, value is
added with multiple effects, Industry impact on participation in industries and regional
centers. Direct livestock value shows the chain producers, transporters (road and the
sea) and the fodder, Suppliers are the great recipients of income in terms of trading. It is
important for direct cemetery Revenue recipients, feedlot operators, agents, shearers,
feeder’s suppliers and Transporters. The role of production as a result of Australian
veterinary trade and relatively large distribution values, low illness, and appropriate
breeds are close to Australia's close market.
Livestock industrial findings
With Indonesia, the trade suspension impressed the industry and foreign nations,
where the animal welfare issues are integral for the Government of Australian, when the
livestock export trade issues are considered. Thus, there was the influence of the trade
suspension on the reputation of Australia in terms of a solid livestock provider. Similarly,
this has resulted in worry among the Australian communities who are associated with
trade, this prompted the Government of Australia to agree to provide a sizeable help
installments. Hence, it helped to cope up few welfare problems in terms of livestock that
are unfit to be dispatched due to the suspension.
Livestock on Type I multiplier
Step1: Utilize the primary assumption total input = total output, for completing the below
mentioned input/output table.
industry
code Industry
Cattle
and
Sheep
Poultry and
Other
Livestock
Agriculture, Forestry and
Fishing Support Services
1.00 Cattle and Sheep 2648.05 220.99 8.86
2.00
Poultry and Other
Livestock 52.45 130.60 0.00
3.00
Agriculture, Forestry and
Fishing Support Services 3179.72 133.14 194.30
3
⊘ This is a preview!⊘
Do you want full access?
Subscribe today to unlock all pages.
Trusted by 1+ million students worldwide
output form
($million)
output form
($million)
output form
($million)
output form
($million)
output form
($million)
output form
($million)
output form
($million)
Agriculture 150 225 125 100 600
Health 210 250 140 300 900
service 170 0 30 100 300
Code description Date quality
1 Agriculture 3/23/2016 150
2 Health 5/30/2017 250
3 service 03/25/2018 30
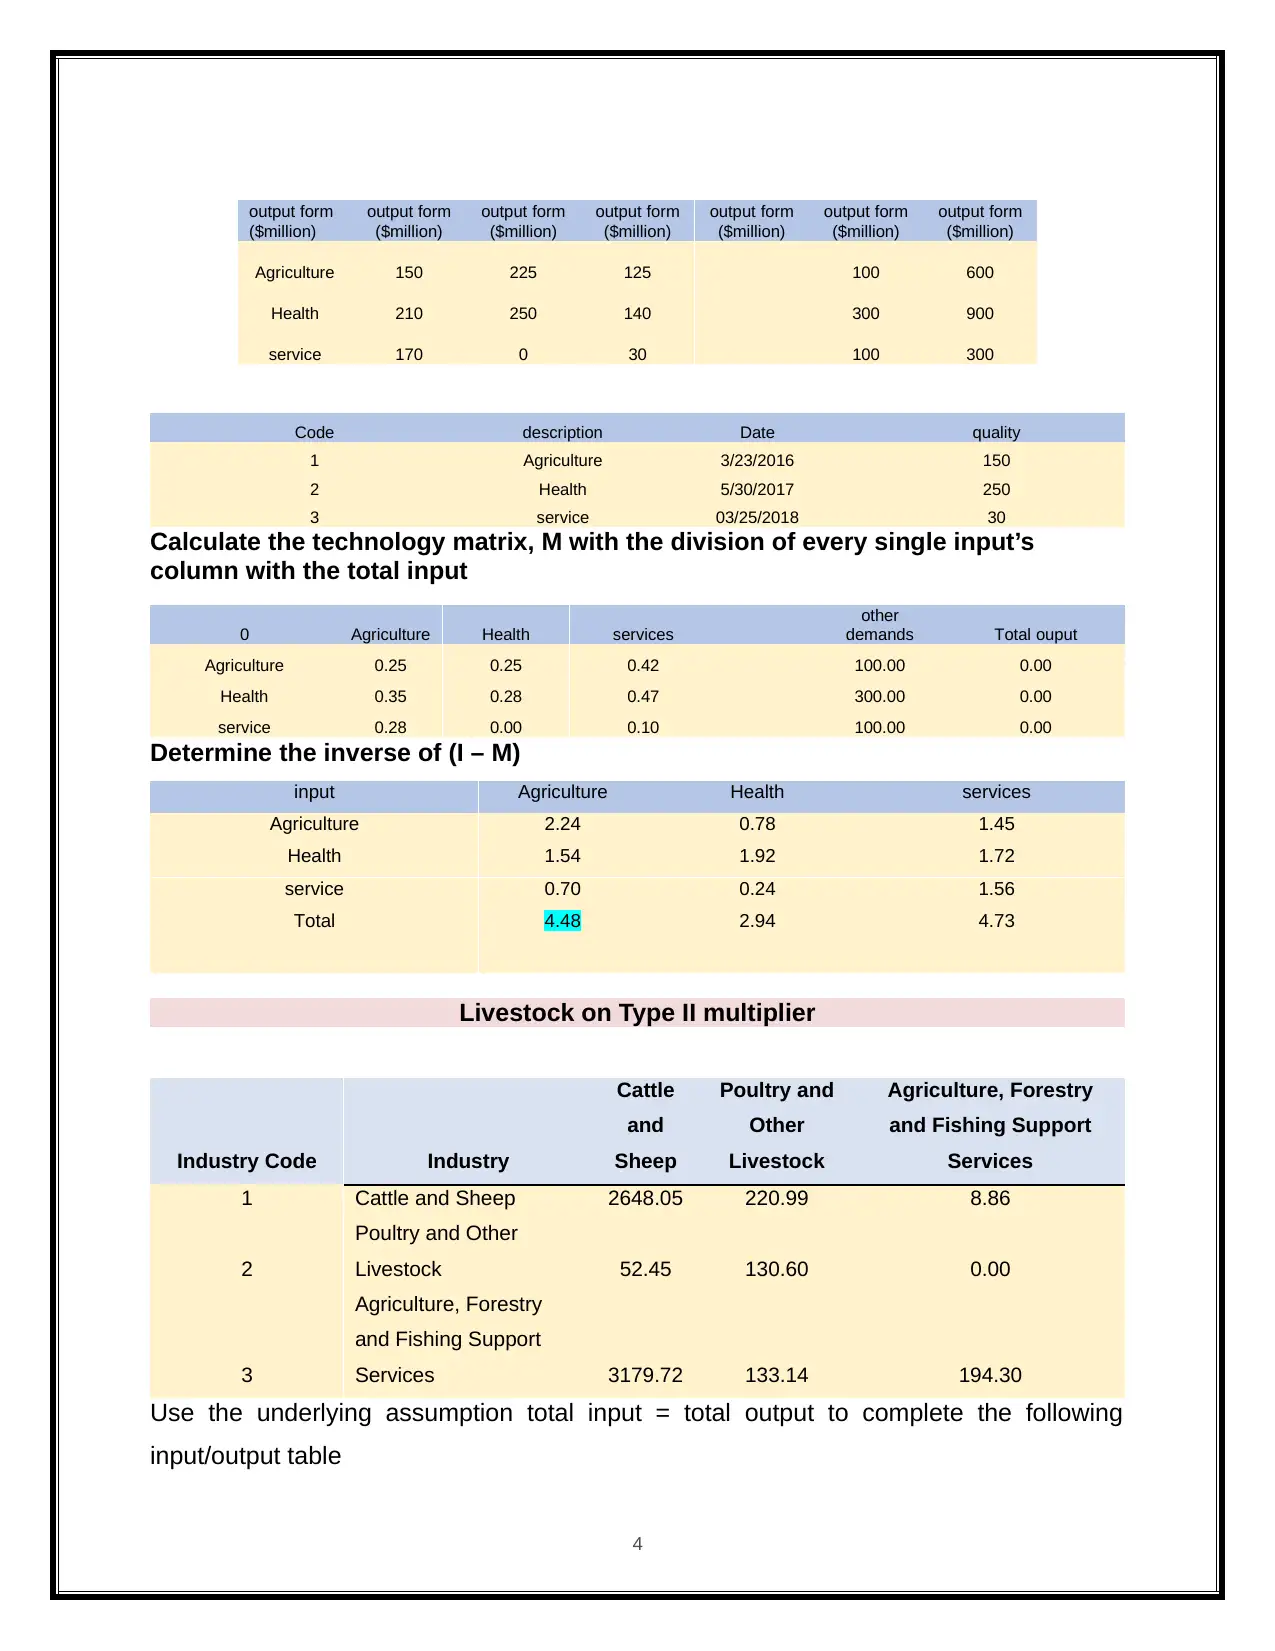
Calculate the technology matrix, M with the division of every single input’s
column with the total input
0 Agriculture Health services
other
demands Total ouput
Agriculture 0.25 0.25 0.42 100.00 0.00
Health 0.35 0.28 0.47 300.00 0.00
service 0.28 0.00 0.10 100.00 0.00
Determine the inverse of (I – M)
input Agriculture Health services
Agriculture 2.24 0.78 1.45
Health 1.54 1.92 1.72
service 0.70 0.24 1.56
Total 4.48 2.94 4.73
Livestock on Type II multiplier
Industry Code Industry
Cattle
and
Sheep
Poultry and
Other
Livestock
Agriculture, Forestry
and Fishing Support
Services
1 Cattle and Sheep 2648.05 220.99 8.86
2
Poultry and Other
Livestock 52.45 130.60 0.00
3
Agriculture, Forestry
and Fishing Support
Services 3179.72 133.14 194.30
Use the underlying assumption total input = total output to complete the following
input/output table
4
($million)
output form
($million)
output form
($million)
output form
($million)
output form
($million)
output form
($million)
output form
($million)
Agriculture 150 225 125 100 600
Health 210 250 140 300 900
service 170 0 30 100 300
Code description Date quality
1 Agriculture 3/23/2016 150
2 Health 5/30/2017 250
3 service 03/25/2018 30
Calculate the technology matrix, M with the division of every single input’s
column with the total input
0 Agriculture Health services
other
demands Total ouput
Agriculture 0.25 0.25 0.42 100.00 0.00
Health 0.35 0.28 0.47 300.00 0.00
service 0.28 0.00 0.10 100.00 0.00
Determine the inverse of (I – M)
input Agriculture Health services
Agriculture 2.24 0.78 1.45
Health 1.54 1.92 1.72
service 0.70 0.24 1.56
Total 4.48 2.94 4.73
Livestock on Type II multiplier
Industry Code Industry
Cattle
and
Sheep
Poultry and
Other
Livestock
Agriculture, Forestry
and Fishing Support
Services
1 Cattle and Sheep 2648.05 220.99 8.86
2
Poultry and Other
Livestock 52.45 130.60 0.00
3
Agriculture, Forestry
and Fishing Support
Services 3179.72 133.14 194.30
Use the underlying assumption total input = total output to complete the following
input/output table
4
Paraphrase This Document
Need a fresh take? Get an instant paraphrase of this document with our AI Paraphraser
output form
($million) Agriculture Health services
Household
demand
other
demand total demand
Agriculture 0.25 0.25 0.42 55 45 600
Health 0.35 0.28 0.47 68 205 900
service 0.28 0 0.1 40 20 300
Household
demands 68 95 5 0 0 168
other demand 2 330 0 5
total output 600 900 300 168
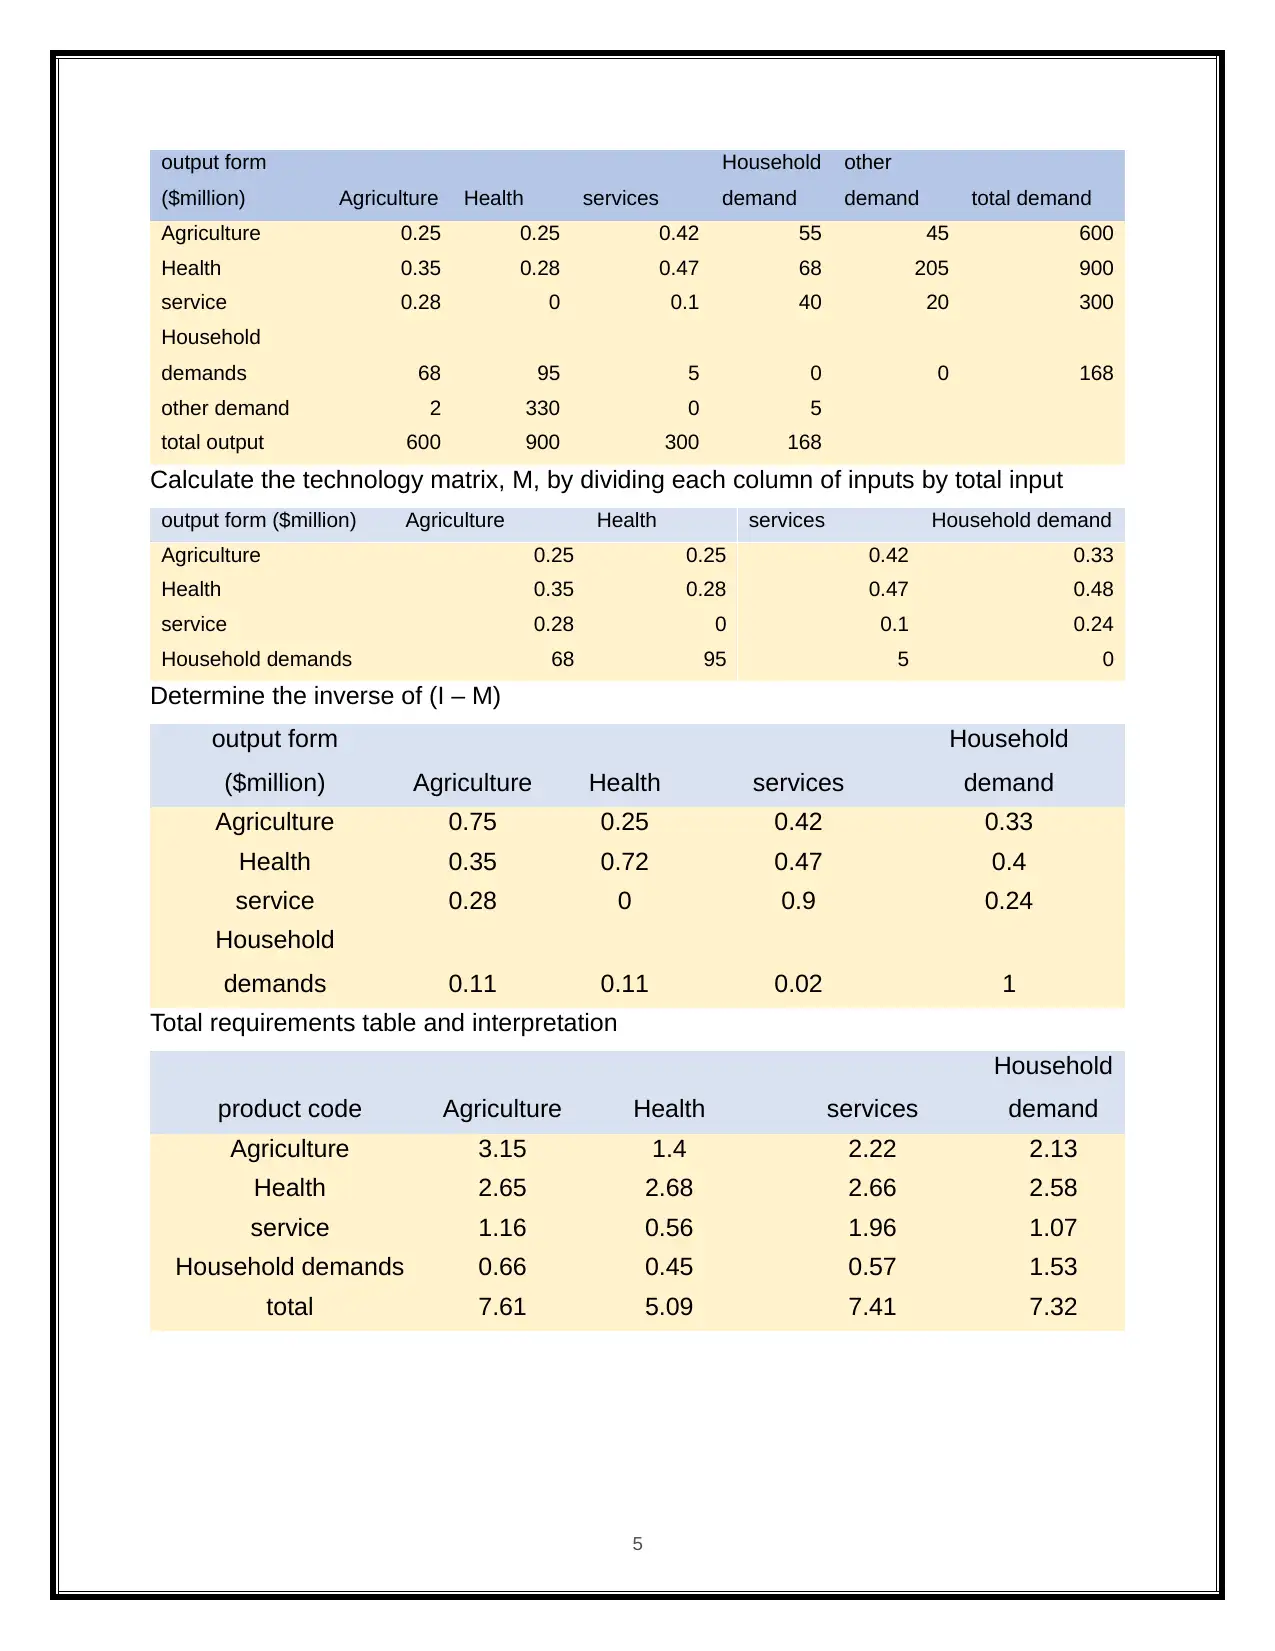
Calculate the technology matrix, M, by dividing each column of inputs by total input
output form ($million) Agriculture Health services Household demand
Agriculture 0.25 0.25 0.42 0.33
Health 0.35 0.28 0.47 0.48
service 0.28 0 0.1 0.24
Household demands 68 95 5 0
Determine the inverse of (I – M)
output form
($million) Agriculture Health services
Household
demand
Agriculture 0.75 0.25 0.42 0.33
Health 0.35 0.72 0.47 0.4
service 0.28 0 0.9 0.24
Household
demands 0.11 0.11 0.02 1
Total requirements table and interpretation
product code Agriculture Health services
Household
demand
Agriculture 3.15 1.4 2.22 2.13
Health 2.65 2.68 2.66 2.58
service 1.16 0.56 1.96 1.07
Household demands 0.66 0.45 0.57 1.53
total 7.61 5.09 7.41 7.32
5
($million) Agriculture Health services
Household
demand
other
demand total demand
Agriculture 0.25 0.25 0.42 55 45 600
Health 0.35 0.28 0.47 68 205 900
service 0.28 0 0.1 40 20 300
Household
demands 68 95 5 0 0 168
other demand 2 330 0 5
total output 600 900 300 168
Calculate the technology matrix, M, by dividing each column of inputs by total input
output form ($million) Agriculture Health services Household demand
Agriculture 0.25 0.25 0.42 0.33
Health 0.35 0.28 0.47 0.48
service 0.28 0 0.1 0.24
Household demands 68 95 5 0
Determine the inverse of (I – M)
output form
($million) Agriculture Health services
Household
demand
Agriculture 0.75 0.25 0.42 0.33
Health 0.35 0.72 0.47 0.4
service 0.28 0 0.9 0.24
Household
demands 0.11 0.11 0.02 1
Total requirements table and interpretation
product code Agriculture Health services
Household
demand
Agriculture 3.15 1.4 2.22 2.13
Health 2.65 2.68 2.66 2.58
service 1.16 0.56 1.96 1.07
Household demands 0.66 0.45 0.57 1.53
total 7.61 5.09 7.41 7.32
5
21%
17%
8%4%
50%
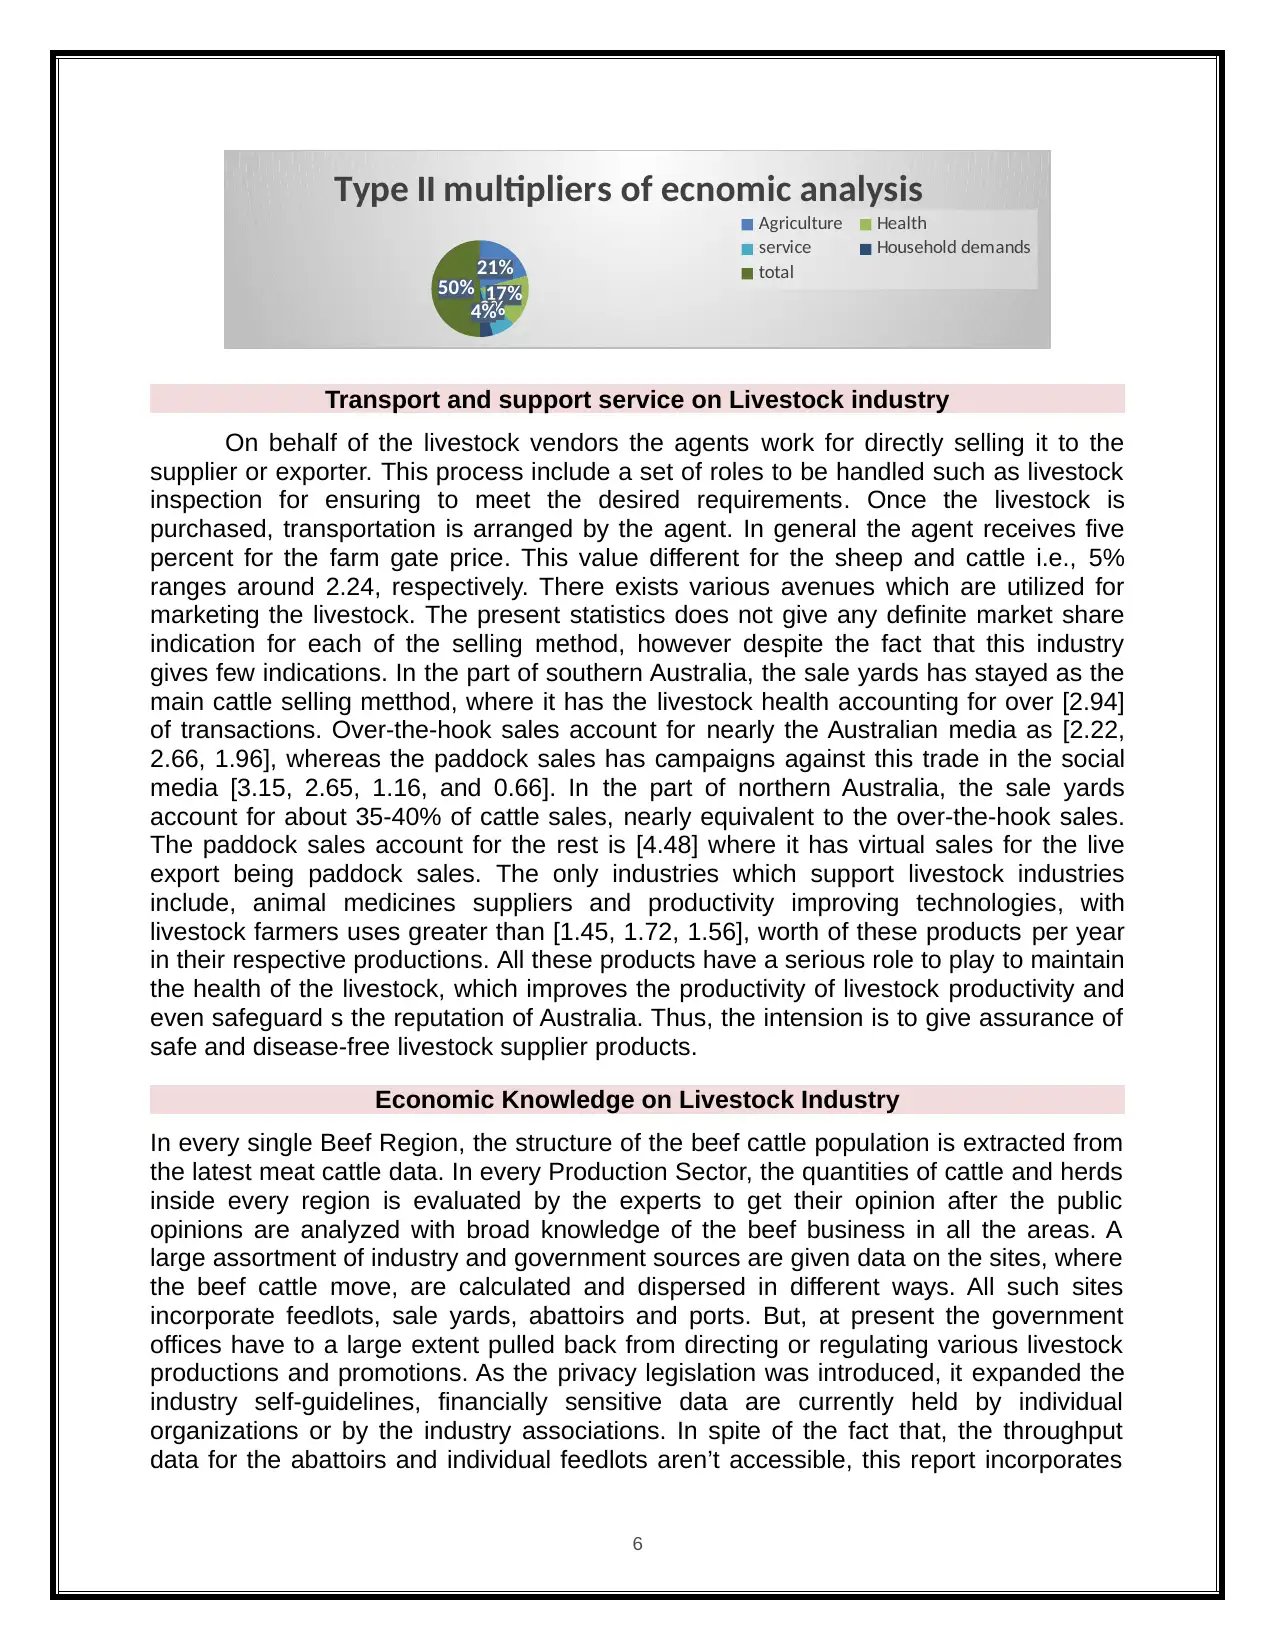
Type II multipliers of ecnomic analysis
Agriculture Health
service Household demands
total
Transport and support service on Livestock industry
On behalf of the livestock vendors the agents work for directly selling it to the
supplier or exporter. This process include a set of roles to be handled such as livestock
inspection for ensuring to meet the desired requirements. Once the livestock is
purchased, transportation is arranged by the agent. In general the agent receives five
percent for the farm gate price. This value different for the sheep and cattle i.e., 5%
ranges around 2.24, respectively. There exists various avenues which are utilized for
marketing the livestock. The present statistics does not give any definite market share
indication for each of the selling method, however despite the fact that this industry
gives few indications. In the part of southern Australia, the sale yards has stayed as the
main cattle selling metthod, where it has the livestock health accounting for over [2.94]
of transactions. Over-the-hook sales account for nearly the Australian media as [2.22,
2.66, 1.96], whereas the paddock sales has campaigns against this trade in the social
media [3.15, 2.65, 1.16, and 0.66]. In the part of northern Australia, the sale yards
account for about 35-40% of cattle sales, nearly equivalent to the over-the-hook sales.
The paddock sales account for the rest is [4.48] where it has virtual sales for the live
export being paddock sales. The only industries which support livestock industries
include, animal medicines suppliers and productivity improving technologies, with
livestock farmers uses greater than [1.45, 1.72, 1.56], worth of these products per year
in their respective productions. All these products have a serious role to play to maintain
the health of the livestock, which improves the productivity of livestock productivity and
even safeguard s the reputation of Australia. Thus, the intension is to give assurance of
safe and disease-free livestock supplier products.
Economic Knowledge on Livestock Industry
In every single Beef Region, the structure of the beef cattle population is extracted from
the latest meat cattle data. In every Production Sector, the quantities of cattle and herds
inside every region is evaluated by the experts to get their opinion after the public
opinions are analyzed with broad knowledge of the beef business in all the areas. A
large assortment of industry and government sources are given data on the sites, where
the beef cattle move, are calculated and dispersed in different ways. All such sites
incorporate feedlots, sale yards, abattoirs and ports. But, at present the government
offices have to a large extent pulled back from directing or regulating various livestock
productions and promotions. As the privacy legislation was introduced, it expanded the
industry self-guidelines, financially sensitive data are currently held by individual
organizations or by the industry associations. In spite of the fact that, the throughput
data for the abattoirs and individual feedlots aren’t accessible, this report incorporates
6
17%
8%4%
50%
Type II multipliers of ecnomic analysis
Agriculture Health
service Household demands
total
Transport and support service on Livestock industry
On behalf of the livestock vendors the agents work for directly selling it to the
supplier or exporter. This process include a set of roles to be handled such as livestock
inspection for ensuring to meet the desired requirements. Once the livestock is
purchased, transportation is arranged by the agent. In general the agent receives five
percent for the farm gate price. This value different for the sheep and cattle i.e., 5%
ranges around 2.24, respectively. There exists various avenues which are utilized for
marketing the livestock. The present statistics does not give any definite market share
indication for each of the selling method, however despite the fact that this industry
gives few indications. In the part of southern Australia, the sale yards has stayed as the
main cattle selling metthod, where it has the livestock health accounting for over [2.94]
of transactions. Over-the-hook sales account for nearly the Australian media as [2.22,
2.66, 1.96], whereas the paddock sales has campaigns against this trade in the social
media [3.15, 2.65, 1.16, and 0.66]. In the part of northern Australia, the sale yards
account for about 35-40% of cattle sales, nearly equivalent to the over-the-hook sales.
The paddock sales account for the rest is [4.48] where it has virtual sales for the live
export being paddock sales. The only industries which support livestock industries
include, animal medicines suppliers and productivity improving technologies, with
livestock farmers uses greater than [1.45, 1.72, 1.56], worth of these products per year
in their respective productions. All these products have a serious role to play to maintain
the health of the livestock, which improves the productivity of livestock productivity and
even safeguard s the reputation of Australia. Thus, the intension is to give assurance of
safe and disease-free livestock supplier products.
Economic Knowledge on Livestock Industry
In every single Beef Region, the structure of the beef cattle population is extracted from
the latest meat cattle data. In every Production Sector, the quantities of cattle and herds
inside every region is evaluated by the experts to get their opinion after the public
opinions are analyzed with broad knowledge of the beef business in all the areas. A
large assortment of industry and government sources are given data on the sites, where
the beef cattle move, are calculated and dispersed in different ways. All such sites
incorporate feedlots, sale yards, abattoirs and ports. But, at present the government
offices have to a large extent pulled back from directing or regulating various livestock
productions and promotions. As the privacy legislation was introduced, it expanded the
industry self-guidelines, financially sensitive data are currently held by individual
organizations or by the industry associations. In spite of the fact that, the throughput
data for the abattoirs and individual feedlots aren’t accessible, this report incorporates
6
⊘ This is a preview!⊘
Do you want full access?
Subscribe today to unlock all pages.
Trusted by 1+ million students worldwide
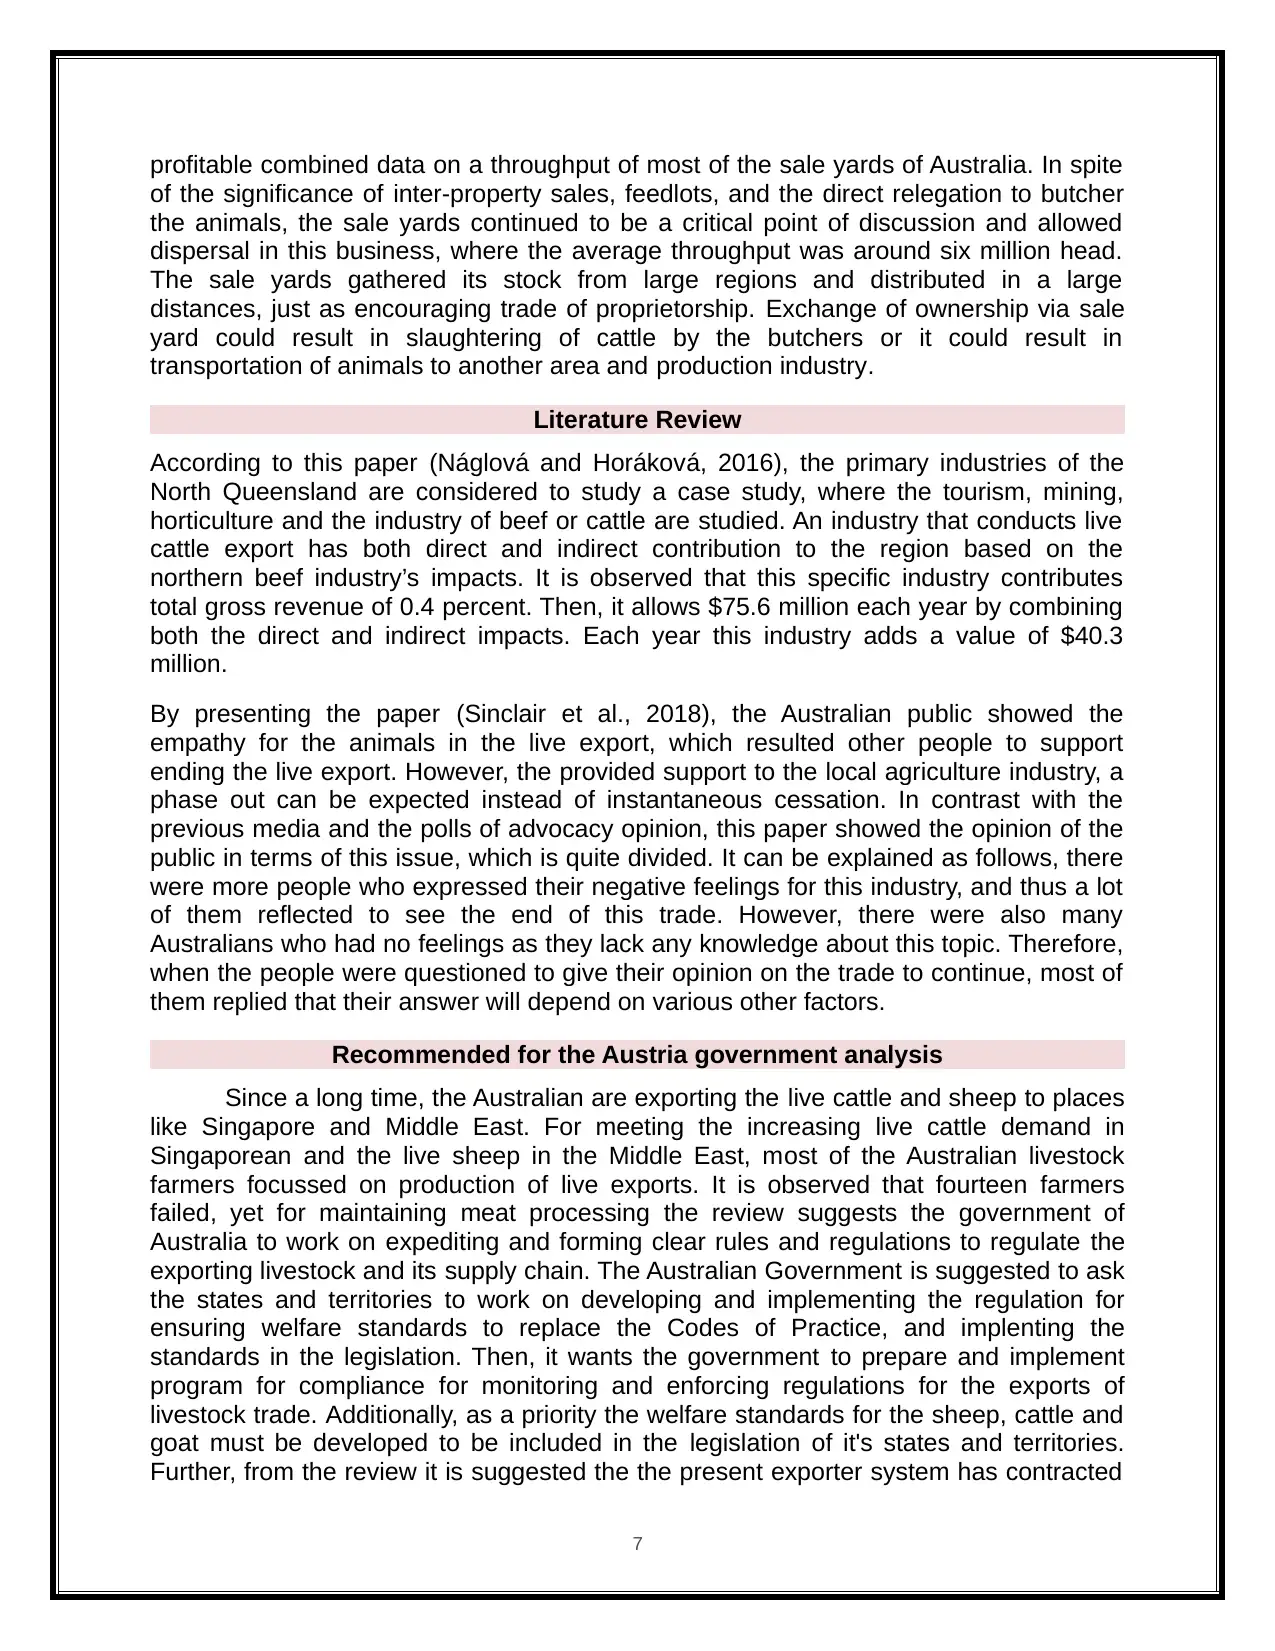
profitable combined data on a throughput of most of the sale yards of Australia. In spite
of the significance of inter-property sales, feedlots, and the direct relegation to butcher
the animals, the sale yards continued to be a critical point of discussion and allowed
dispersal in this business, where the average throughput was around six million head.
The sale yards gathered its stock from large regions and distributed in a large
distances, just as encouraging trade of proprietorship. Exchange of ownership via sale
yard could result in slaughtering of cattle by the butchers or it could result in
transportation of animals to another area and production industry.
Literature Review
According to this paper (Náglová and Horáková , 2016), the primary industries of the
North Queensland are considered to study a case study, where the tourism, mining,
horticulture and the industry of beef or cattle are studied. An industry that conducts live
cattle export has both direct and indirect contribution to the region based on the
northern beef industry’s impacts. It is observed that this specific industry contributes
total gross revenue of 0.4 percent. Then, it allows $75.6 million each year by combining
both the direct and indirect impacts. Each year this industry adds a value of $40.3
million.
By presenting the paper (Sinclair et al., 2018), the Australian public showed the
empathy for the animals in the live export, which resulted other people to support
ending the live export. However, the provided support to the local agriculture industry, a
phase out can be expected instead of instantaneous cessation. In contrast with the
previous media and the polls of advocacy opinion, this paper showed the opinion of the
public in terms of this issue, which is quite divided. It can be explained as follows, there
were more people who expressed their negative feelings for this industry, and thus a lot
of them reflected to see the end of this trade. However, there were also many
Australians who had no feelings as they lack any knowledge about this topic. Therefore,
when the people were questioned to give their opinion on the trade to continue, most of
them replied that their answer will depend on various other factors.
Recommended for the Austria government analysis
Since a long time, the Australian are exporting the live cattle and sheep to places
like Singapore and Middle East. For meeting the increasing live cattle demand in
Singaporean and the live sheep in the Middle East, most of the Australian livestock
farmers focussed on production of live exports. It is observed that fourteen farmers
failed, yet for maintaining meat processing the review suggests the government of
Australia to work on expediting and forming clear rules and regulations to regulate the
exporting livestock and its supply chain. The Australian Government is suggested to ask
the states and territories to work on developing and implementing the regulation for
ensuring welfare standards to replace the Codes of Practice, and implenting the
standards in the legislation. Then, it wants the government to prepare and implement
program for compliance for monitoring and enforcing regulations for the exports of
livestock trade. Additionally, as a priority the welfare standards for the sheep, cattle and
goat must be developed to be included in the legislation of it's states and territories.
Further, from the review it is suggested the the present exporter system has contracted
7
Paraphrase This Document
Need a fresh take? Get an instant paraphrase of this document with our AI Paraphraser
the stockpersons and AAVs to supply the provisions such as, improved auditing
processes, targeted on-site audit, end-of-voyage reports and Daily reports for
forwarding it to the exporters and AQIS. Also, it demand to provide improved trainings
and induction processes and mentoring programs for the stockpersons.
Conclusion
The agriculture sector on the data analysis and implementing the livestock export
industry which is specified the cattle and sheep industry on the Monday data analysis
on the Australian government organization using excel calculation will be completed. A
unit of change in a particular segment encompasses the bulk of the economy from the
economy. In the economy, three types of multiplayers are 1, output 1, 2] revenue and 3
jobs are calculated, such as Type I multiplier on the final agriculture economic value is
4.48 and Type II multiplier of the value is 5.09 will be completed . Australia, US $ 250
million was exported, and in 2010 it was estimated at $ 425 million worth sheep, goats,
and sheep in Australia's agricultural exports at 2.7 percent. Australia exported livestock
to 19 countries, exporting sheep to 16 countries and 9 countries for goats. Australian
Australia carries out garlic and meat exports and contributes substantially to the
regional economy of Australia. The industry is concentrated within the specific area. For
example, during 2009-11, over 4.48 percent of total live cattle exports came from
Agriculture Queensland and Western Australia. 80% of live goats exported from
Western Australia ports will be completed.
Reference
Náglová, Z. and Horáková , T. (2016). Influence of Qualitative Factors on Quantitative
Determinants in the Czech Meat Industry Economy. Agris on-line Papers in Economics
and Informatics, 8(4), pp.111-123.
Sinclair, M., Derkley, T., Fryer, C. and Phillips, C. (2018). Australian Public Opinions
Regarding the Live Export Trade before and after an Animal Welfare Media
Exposé. Animals, 8(7), p.106.
Appendix
8
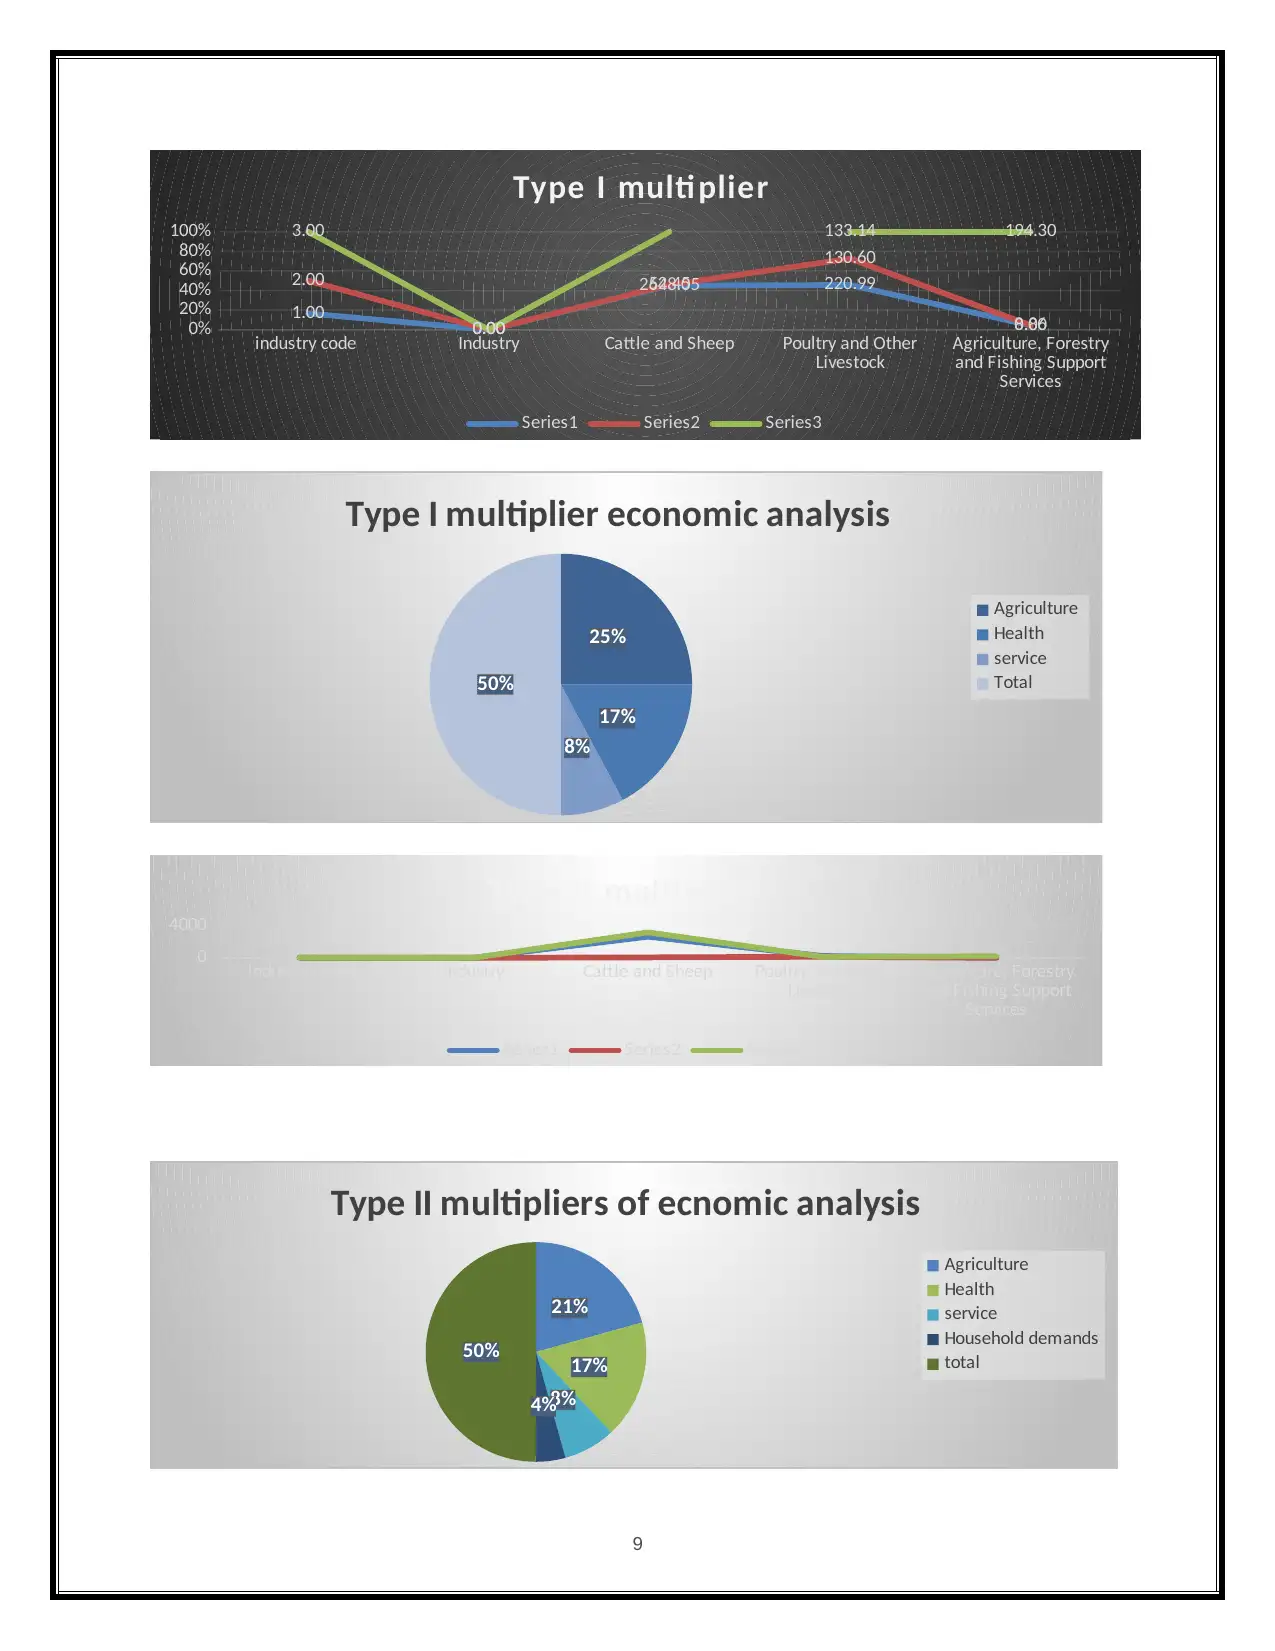
industry code Industry Cattle and Sheep Poultry and Other
Livestock Agriculture, Forestry
and Fishing Support
Services
0%
20%
40%
60%
80%
100%
1.00 0.00
2648.05 220.99
8.86
2.00
0.00
52.45
130.60
0.00
3.00
0.00
133.14 194.30
Type I multi plier
Series1 Series2 Series3
25%
17%
8%
50%
Type I multiplier economic analysis
Agriculture
Health
service
Total
Industry Code Industry Cattle and Sheep Poultry and Other
Livestock Agriculture, Forestry
and Fishing Support
Services
0
4000
Type II multi plier
Series1 Series2 Series3
21%
17%
8%4%
50%
Type II multipliers of ecnomic analysis
Agriculture
Health
service
Household demands
total
9
Livestock Agriculture, Forestry
and Fishing Support
Services
0%
20%
40%
60%
80%
100%
1.00 0.00
2648.05 220.99
8.86
2.00
0.00
52.45
130.60
0.00
3.00
0.00
133.14 194.30
Type I multi plier
Series1 Series2 Series3
25%
17%
8%
50%
Type I multiplier economic analysis
Agriculture
Health
service
Total
Industry Code Industry Cattle and Sheep Poultry and Other
Livestock Agriculture, Forestry
and Fishing Support
Services
0
4000
Type II multi plier
Series1 Series2 Series3
21%
17%
8%4%
50%
Type II multipliers of ecnomic analysis
Agriculture
Health
service
Household demands
total
9
⊘ This is a preview!⊘
Do you want full access?
Subscribe today to unlock all pages.
Trusted by 1+ million students worldwide

10
1 out of 10
Related Documents


Your All-in-One AI-Powered Toolkit for Academic Success.
+13062052269
info@desklib.com
Available 24*7 on WhatsApp / Email
![[object Object]](/_next/static/media/star-bottom.7253800d.svg)
Unlock your academic potential
Copyright © 2020–2026 A2Z Services. All Rights Reserved. Developed and managed by ZUCOL.