Quantitative Analysis for Business: Comprehensive Project Report

Verified

Added on  2022/08/24

|12
|1435
|22
Project
AI Summary
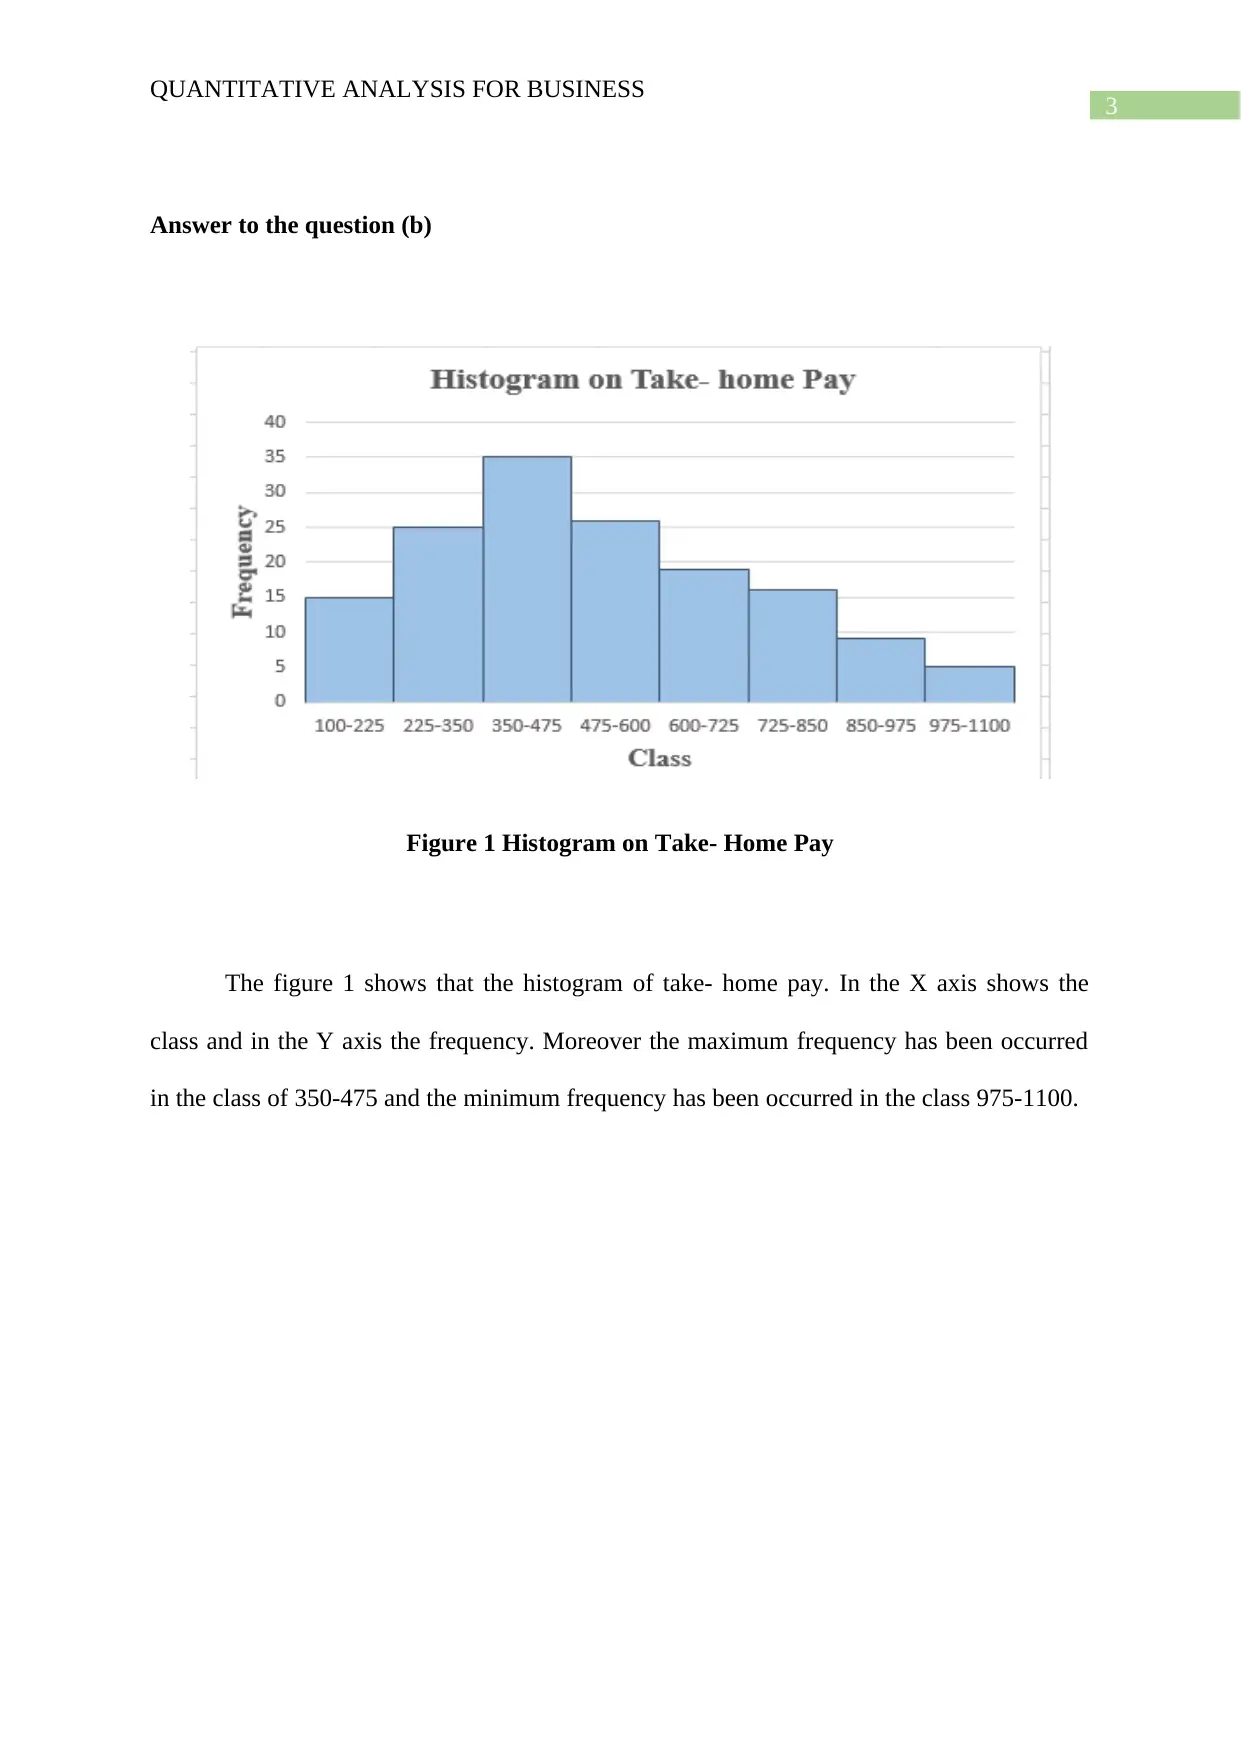
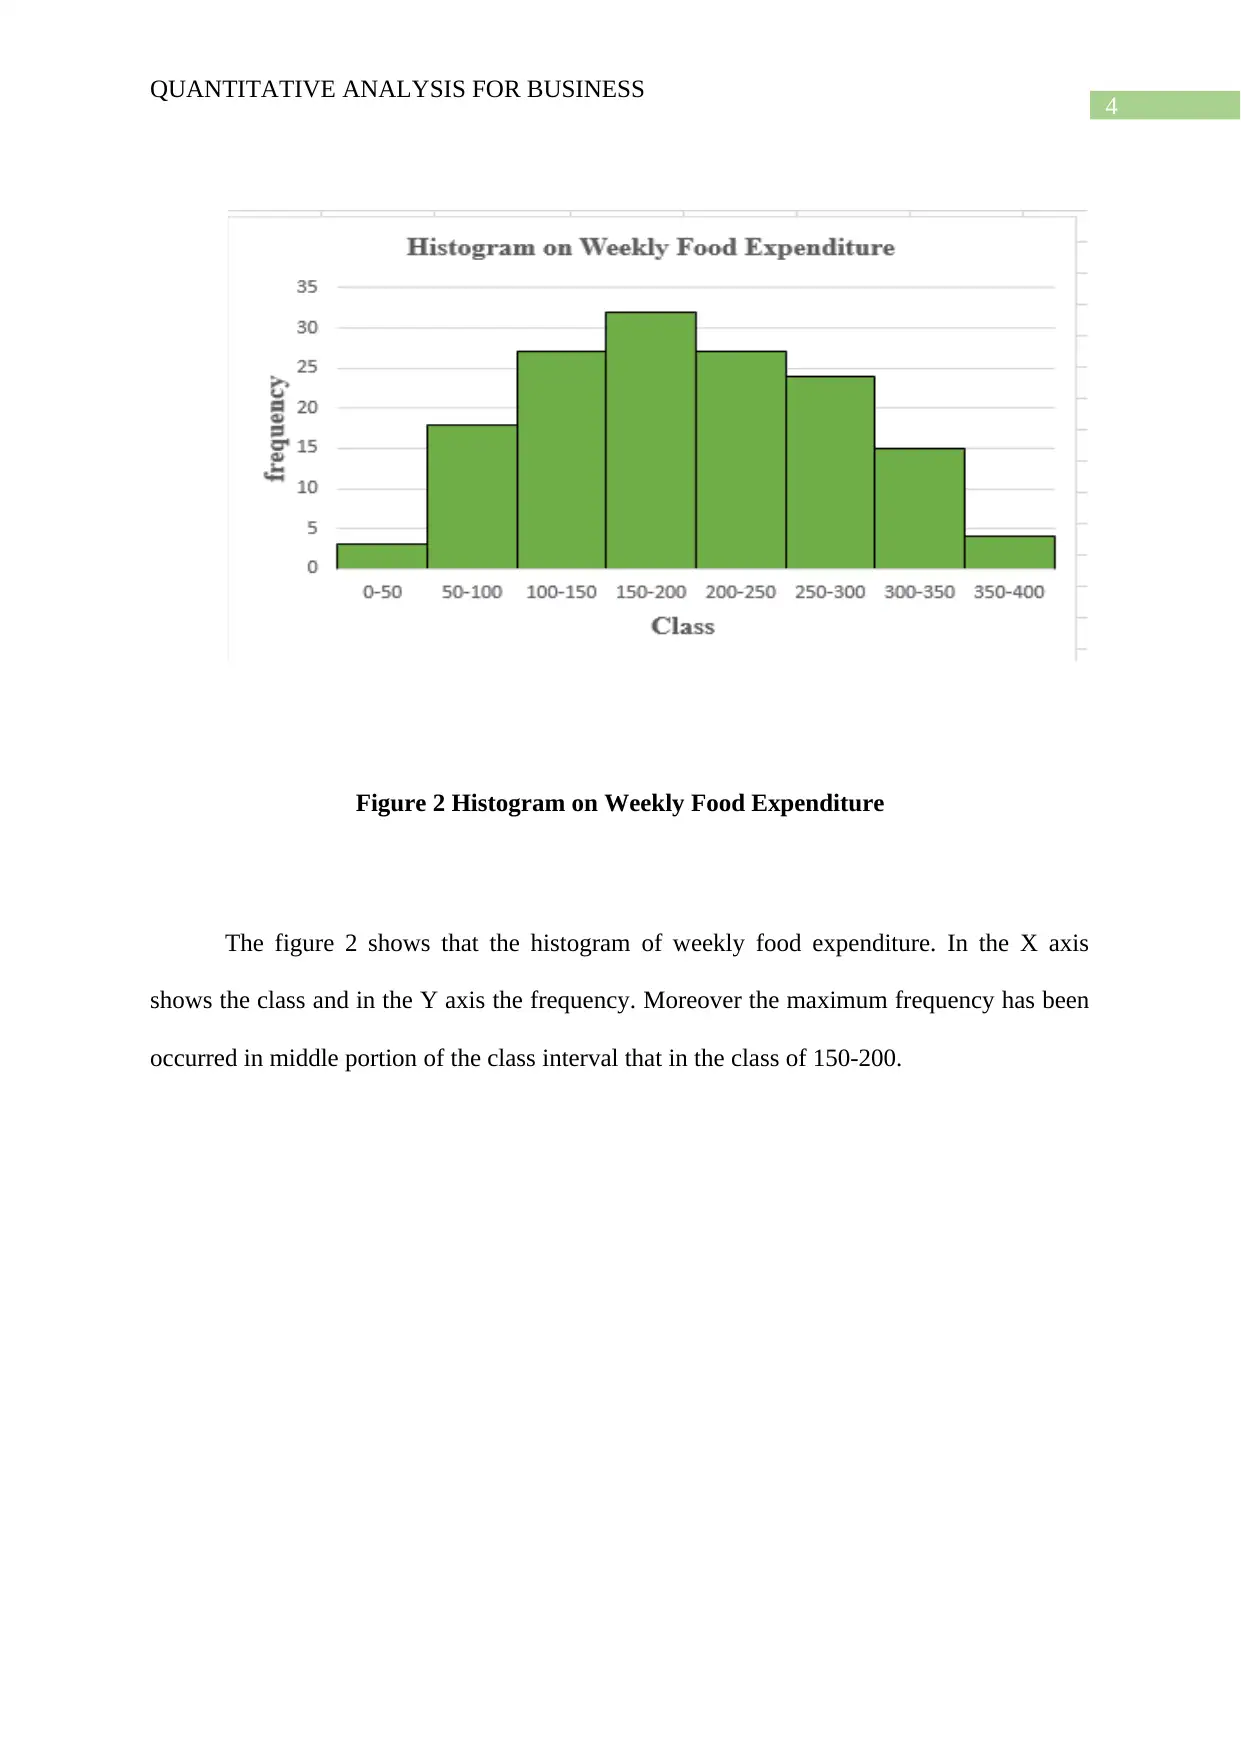
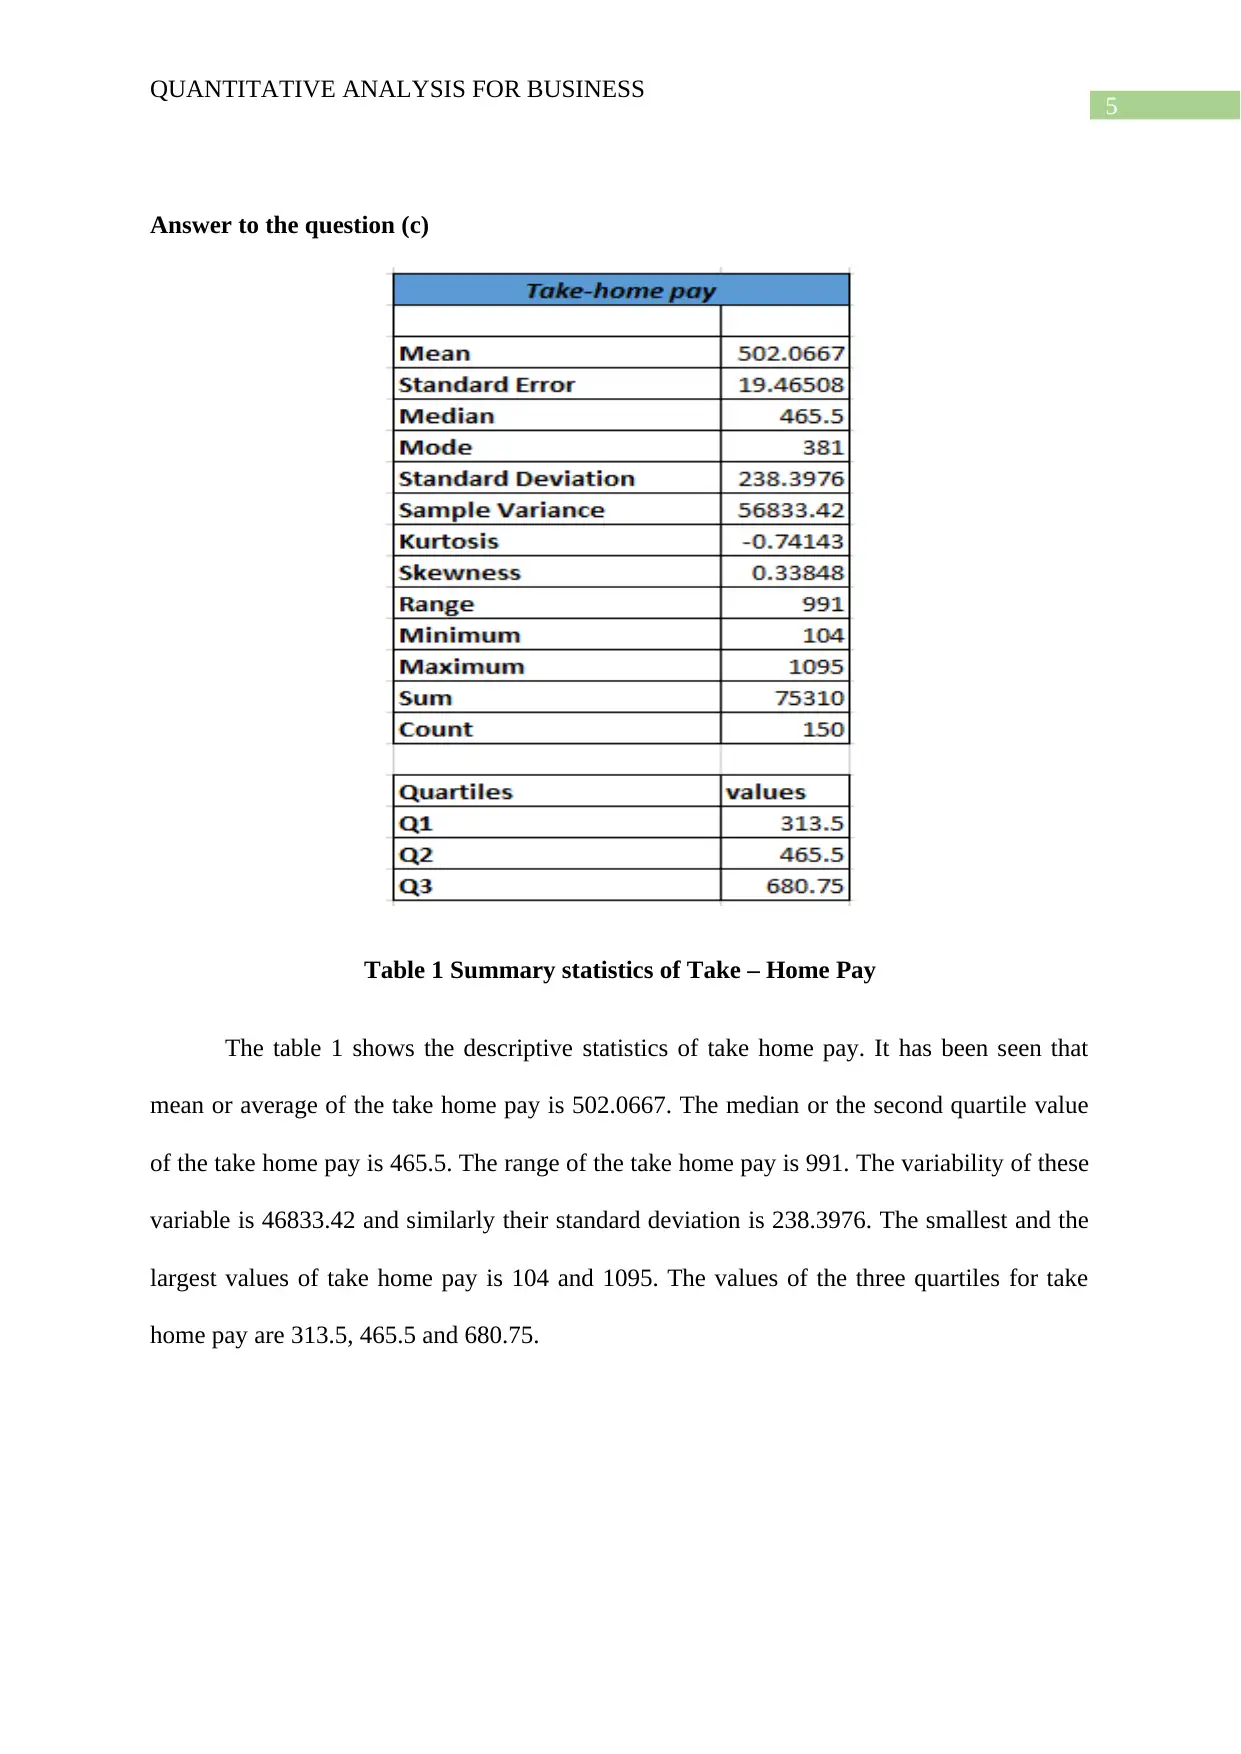
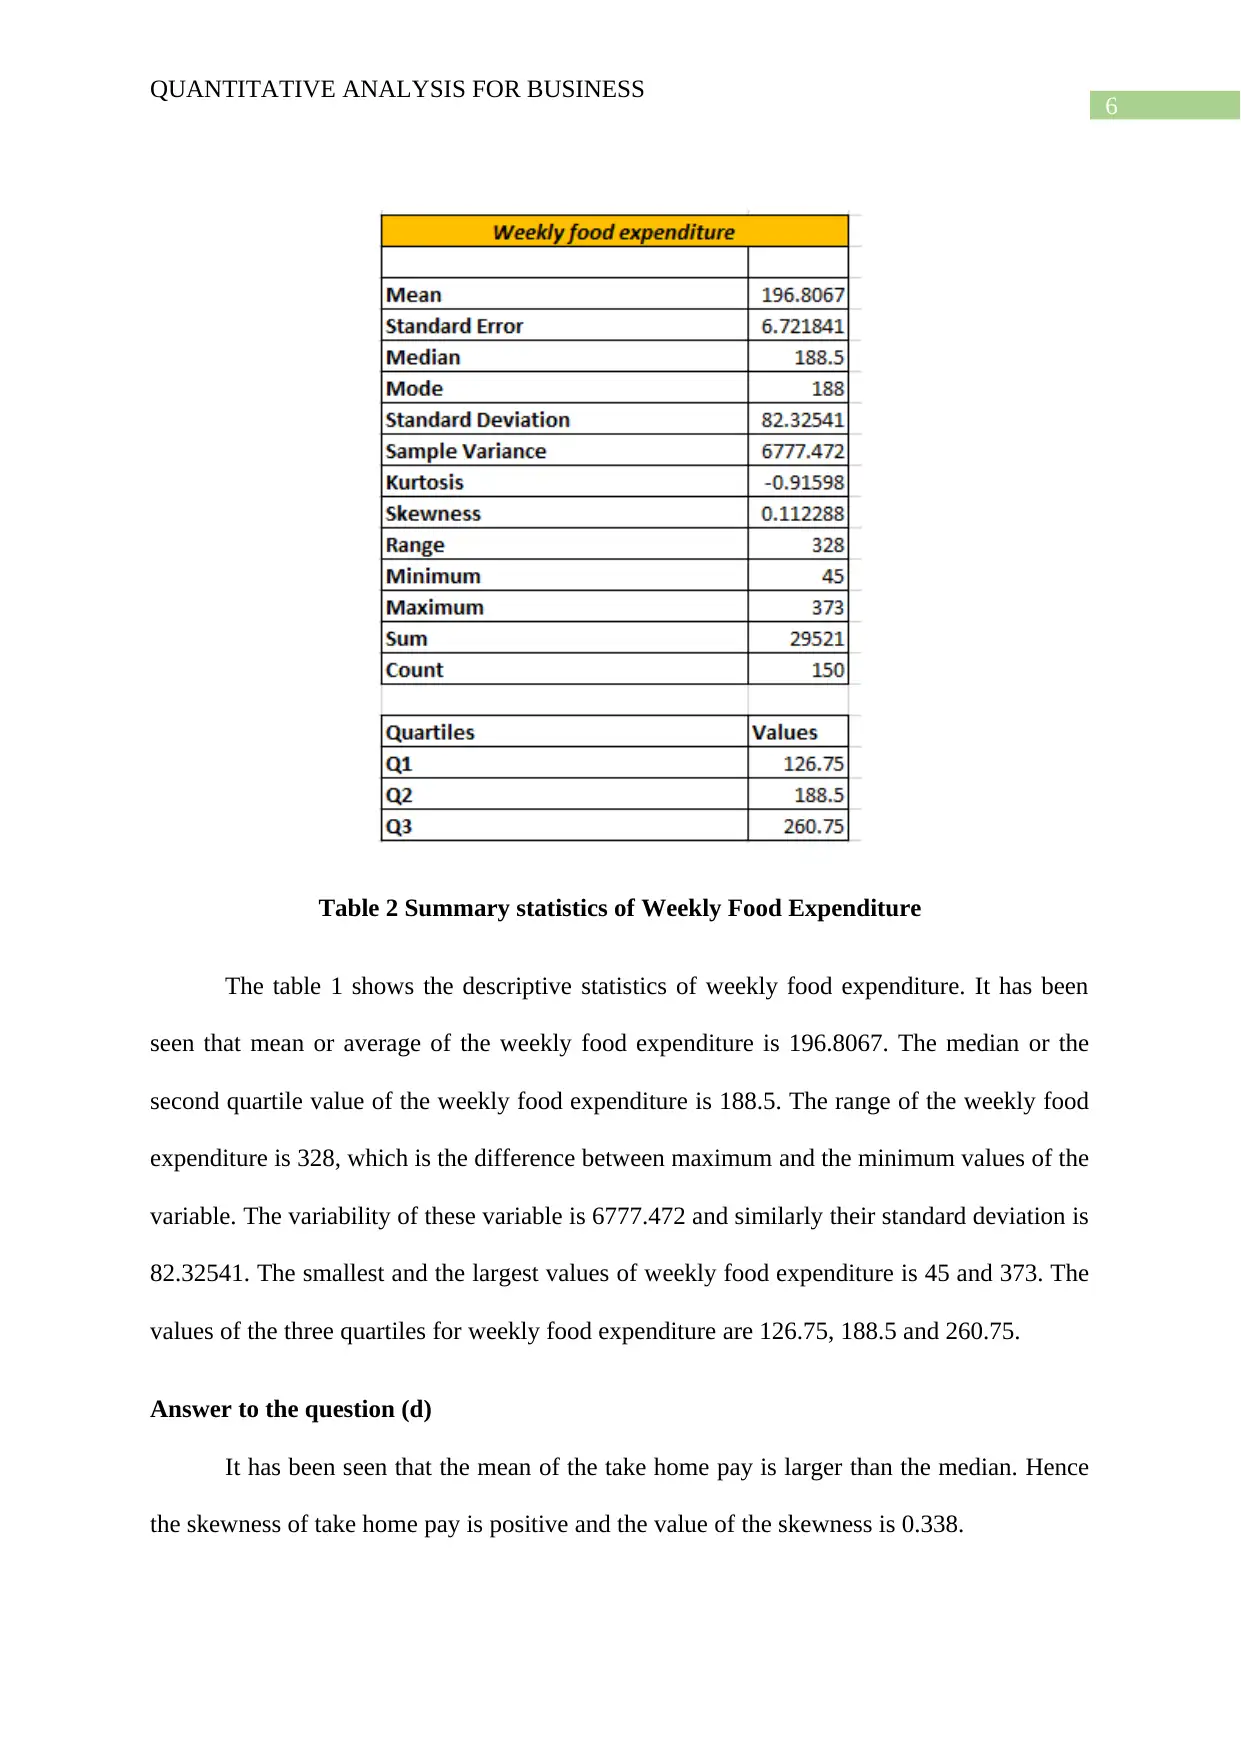
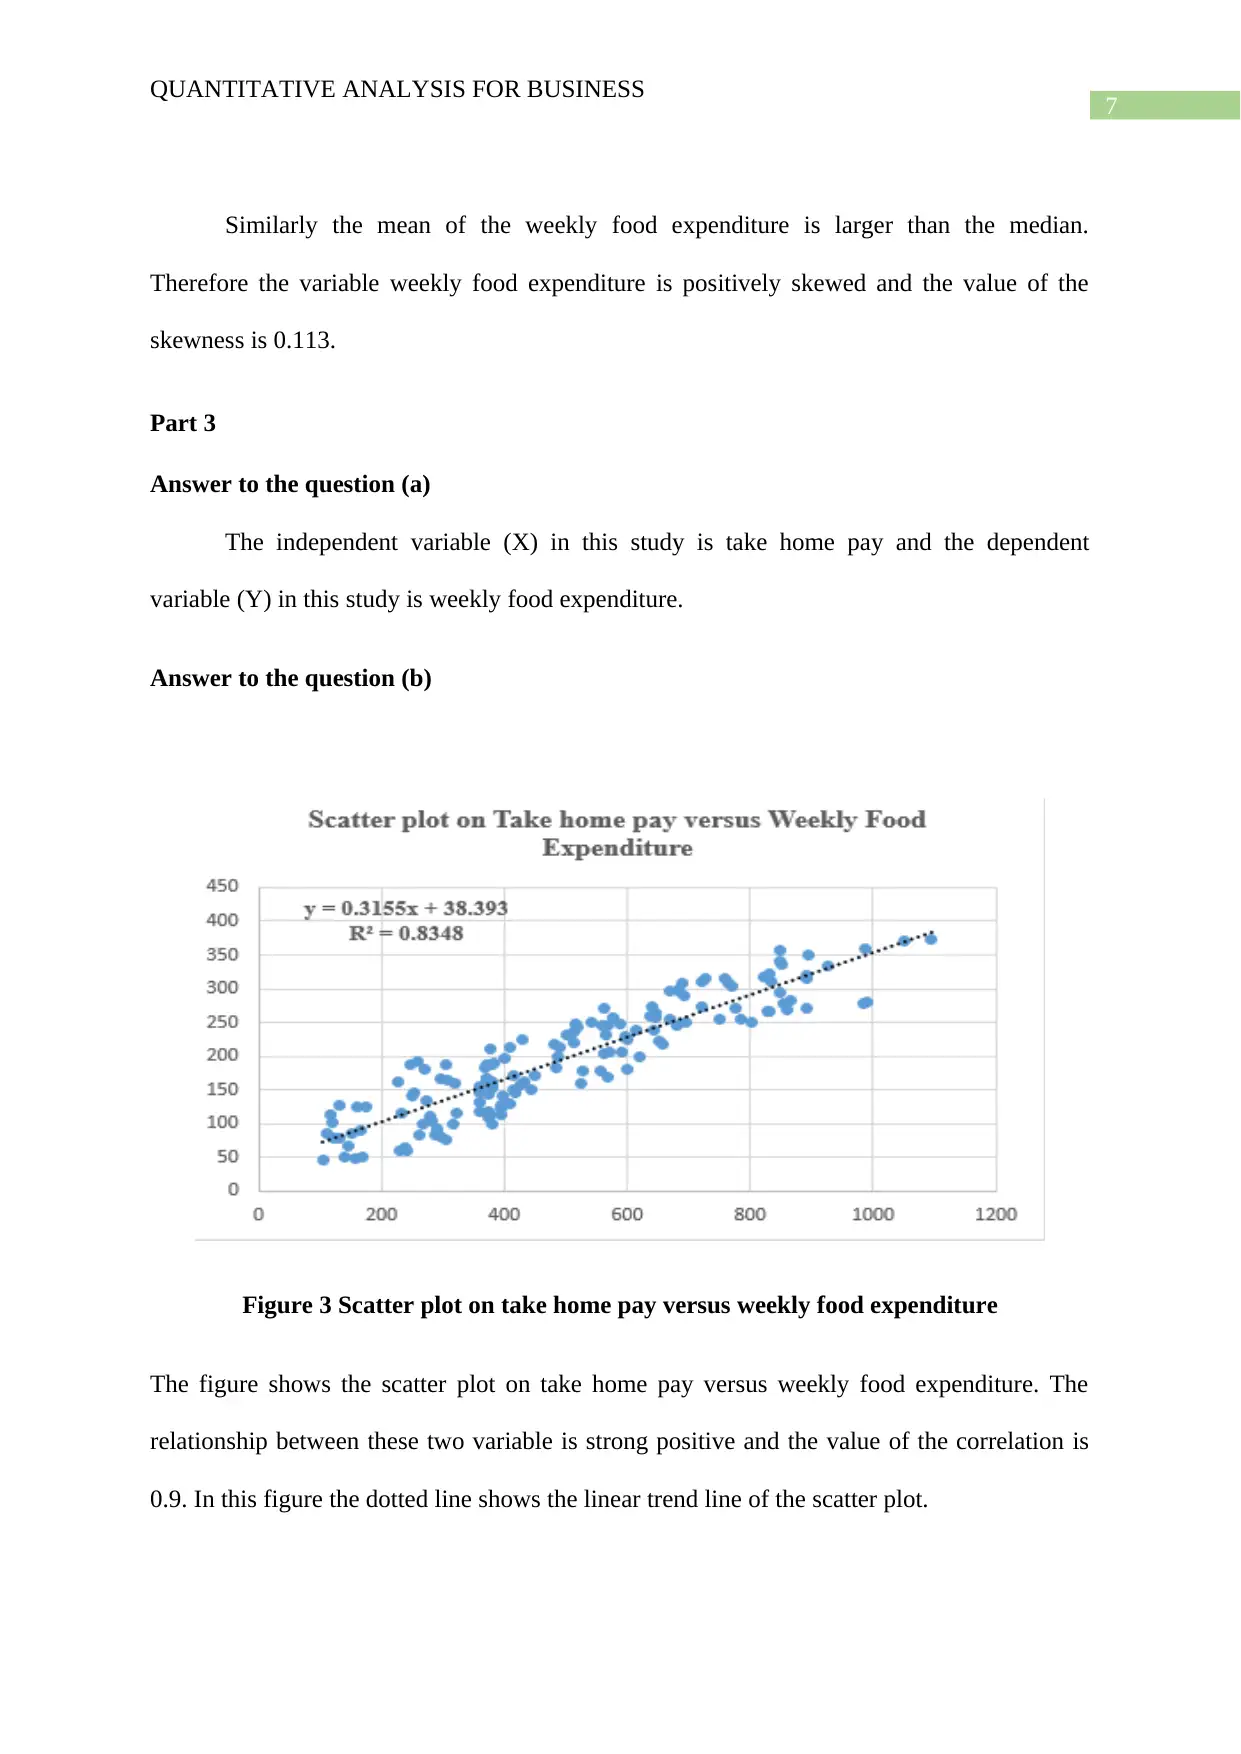
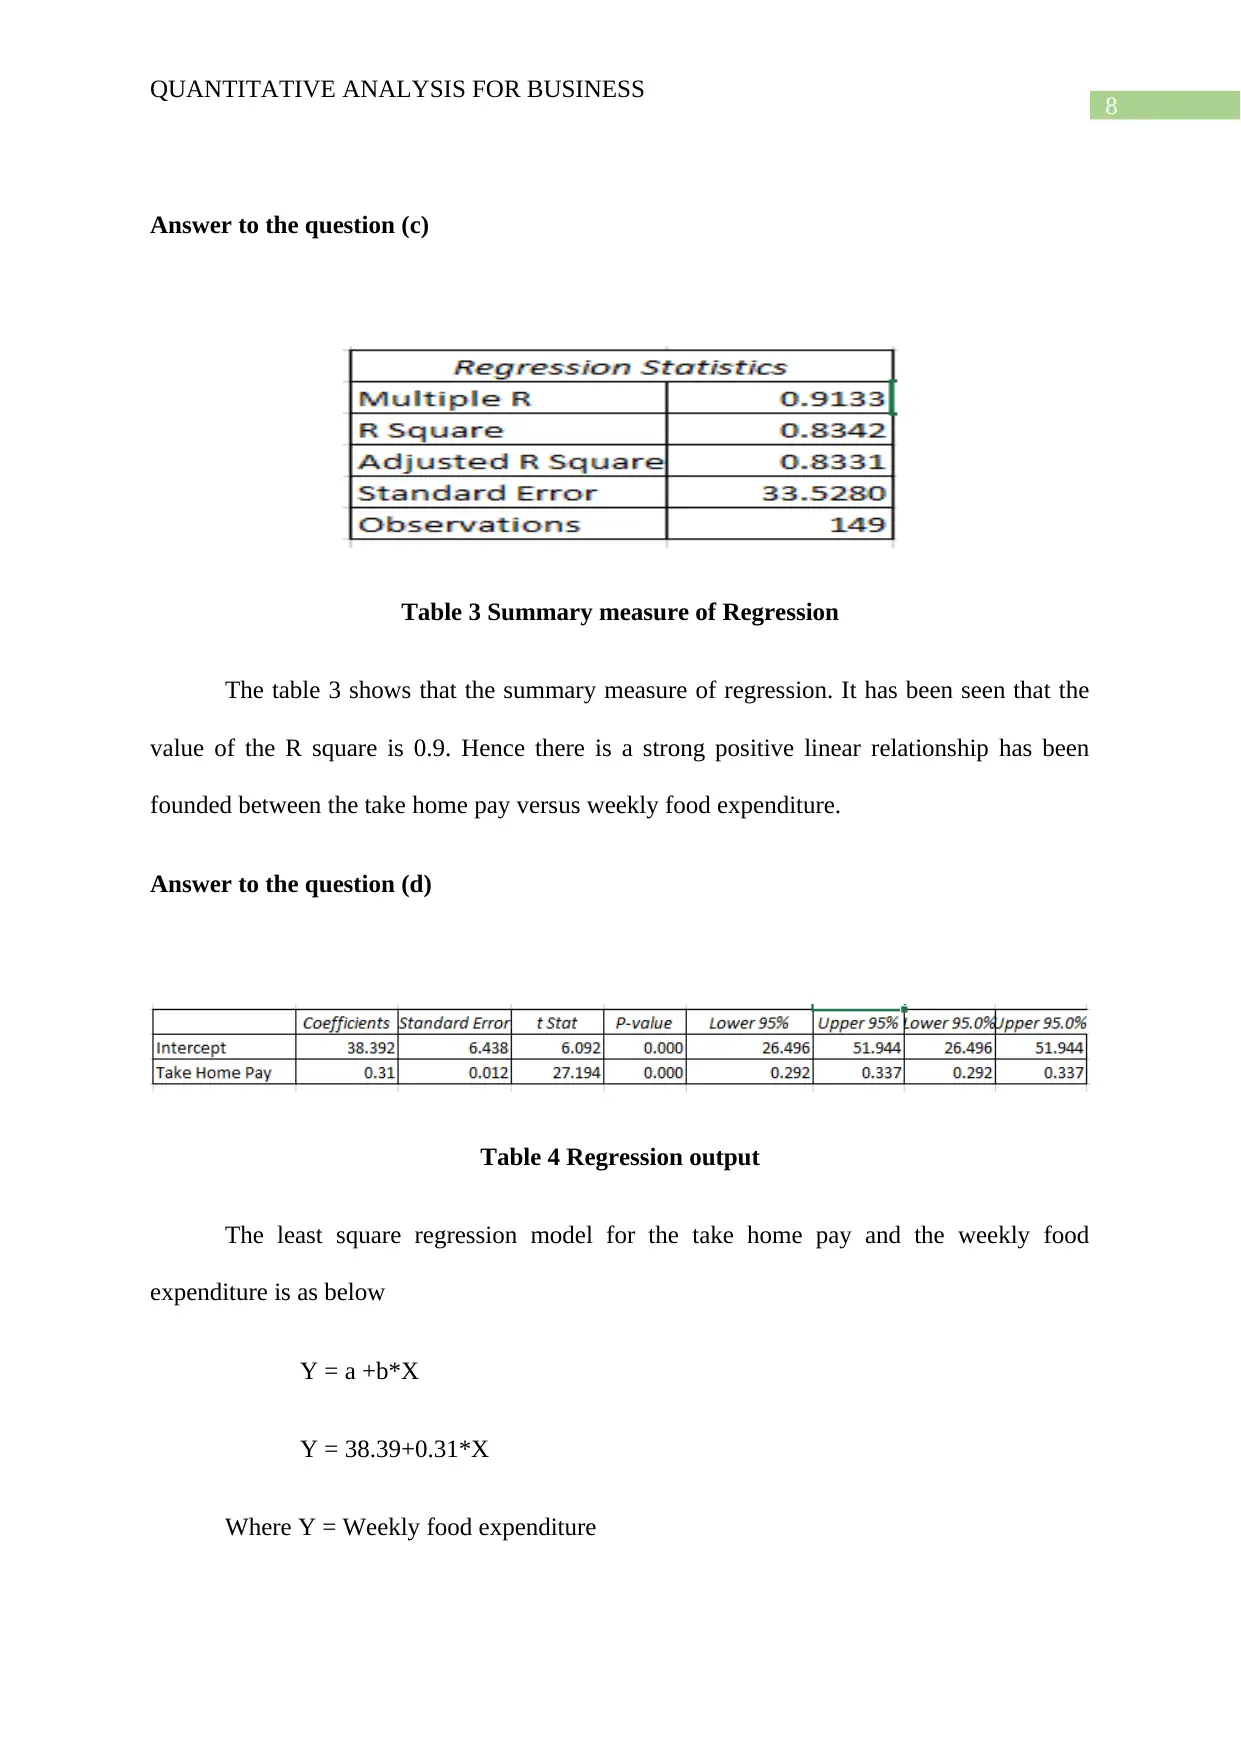
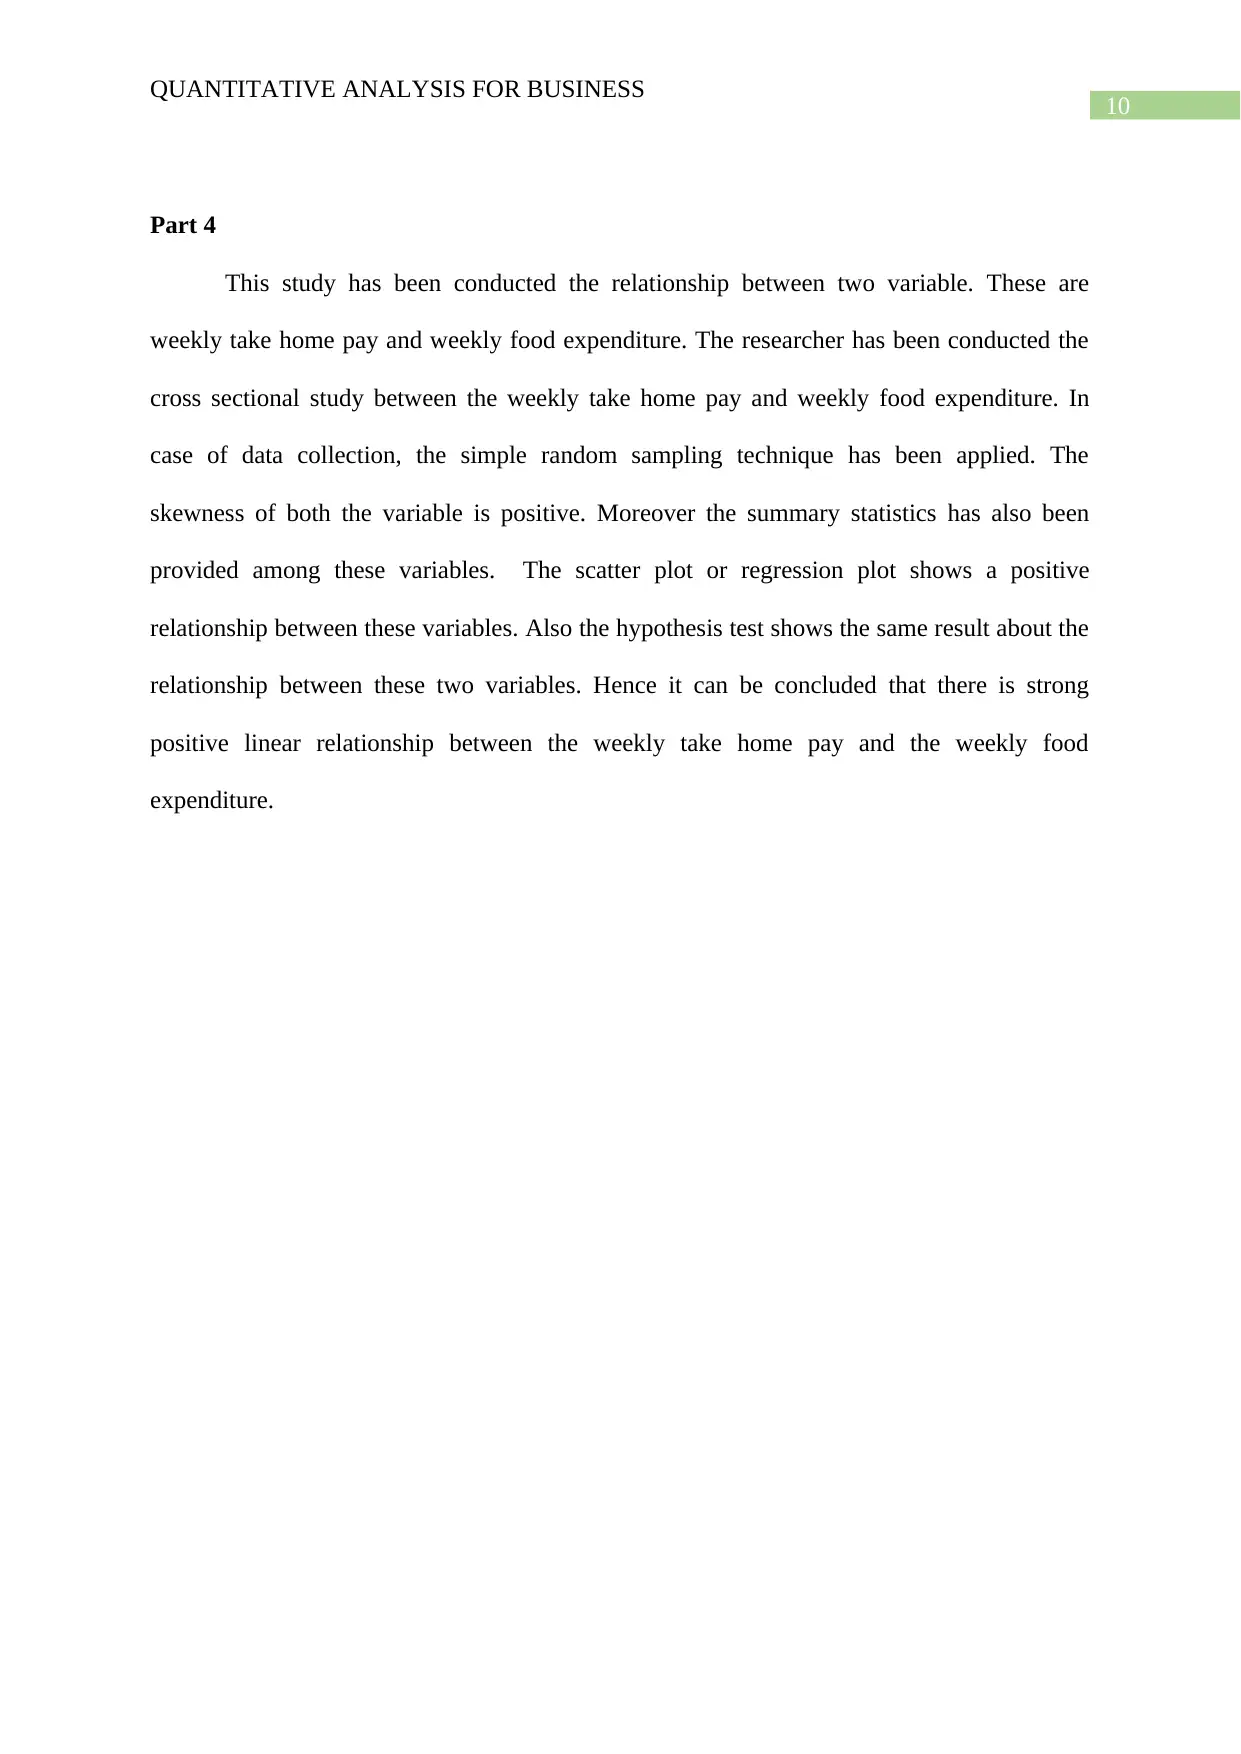
This project presents a comprehensive quantitative analysis of business data, focusing on the relationship between weekly take-home pay and weekly food expenditure. The analysis begins with a cross-sectional study using simple random sampling to collect data. The project explores descriptive statistics, including histograms, mean, median, range, and skewness for both variables. The core of the project involves regression analysis, including scatter plots, correlation analysis, and the development of a least squares regression model. Hypothesis testing is conducted to determine the significance of the relationship between the variables, with ANOVA tables used to support the conclusions. The study concludes with a strong positive linear relationship identified between take-home pay and food expenditure, providing valuable insights into consumer behavior. The project also covers the application of index numbers, consumer price index, regression analysis, statistical inference, and confidence interval estimators.
Document Page
Running head: QUANTITATIVE ANALYSIS FOR BUSINESS
Quantitative Analysis for Business
Name of the Student:
Name of the University:
Author Note:
tabler-icon-diamond-filled.svg

Paraphrase This Document

Need a fresh take? Get an instant paraphrase of this document with our AI Paraphraser
Document Page
1
QUANTITATIVE ANALYSIS FOR BUSINESS
Table of Contents
Part 1..........................................................................................................................................2
Answer to the question (a).....................................................................................................2
Answer to the question (b).....................................................................................................2
Answer to the question (c).....................................................................................................2
Part 2..........................................................................................................................................3
Answer to the question (a).....................................................................................................3
Answer to the question (b).....................................................................................................3
Answer to the question (c).....................................................................................................5
Answer to the question (d).....................................................................................................6
Part 3..........................................................................................................................................7
Answer to the question (a).....................................................................................................7
Answer to the question (b).....................................................................................................7
Answer to the question (c).....................................................................................................8
Answer to the question (d).....................................................................................................8
Answer to the question (e).....................................................................................................9
Part 4........................................................................................................................................10
Bibliography.............................................................................................................................11
Document Page
2
QUANTITATIVE ANALYSIS FOR BUSINESS
Part 1
Answer to the question (a)
The researcher has been conducted the cross sectional study between the weekly take
home pay and weekly food expenditure. The study shows the association between take home
pay and the weekly food expenditure. More over this study has been done at a single time
period. Hence this study is called as cross sectional study.
Answer to the question (b)
The simple random sampling method has been applied by the researcher.
Answer to the question (c)
There are some issues which has been faced by the researcher or data collector. These
are generalizability and the representativeness, size of sample and the non-response bias.
Part 2
Answer to the question (a)
The researcher has been decided the 8 class intervals on both the variables like take
home pay and the weekly food expenditure. Thus these depends upon the maximum and the
minimum value of each variable.
Document Page
3
QUANTITATIVE ANALYSIS FOR BUSINESS
Answer to the question (b)
Figure 1 Histogram on Take- Home Pay
The figure 1 shows that the histogram of take- home pay. In the X axis shows the
class and in the Y axis the frequency. Moreover the maximum frequency has been occurred
in the class of 350-475 and the minimum frequency has been occurred in the class 975-1100.
tabler-icon-diamond-filled.svg

Paraphrase This Document

Need a fresh take? Get an instant paraphrase of this document with our AI Paraphraser
Document Page
4
QUANTITATIVE ANALYSIS FOR BUSINESS
Figure 2 Histogram on Weekly Food Expenditure
The figure 2 shows that the histogram of weekly food expenditure. In the X axis
shows the class and in the Y axis the frequency. Moreover the maximum frequency has been
occurred in middle portion of the class interval that in the class of 150-200.
Document Page
5
QUANTITATIVE ANALYSIS FOR BUSINESS
Answer to the question (c)
Table 1 Summary statistics of Take – Home Pay
The table 1 shows the descriptive statistics of take home pay. It has been seen that
mean or average of the take home pay is 502.0667. The median or the second quartile value
of the take home pay is 465.5. The range of the take home pay is 991. The variability of these
variable is 46833.42 and similarly their standard deviation is 238.3976. The smallest and the
largest values of take home pay is 104 and 1095. The values of the three quartiles for take
home pay are 313.5, 465.5 and 680.75.
Document Page
6
QUANTITATIVE ANALYSIS FOR BUSINESS
Table 2 Summary statistics of Weekly Food Expenditure
The table 1 shows the descriptive statistics of weekly food expenditure. It has been
seen that mean or average of the weekly food expenditure is 196.8067. The median or the
second quartile value of the weekly food expenditure is 188.5. The range of the weekly food
expenditure is 328, which is the difference between maximum and the minimum values of the
variable. The variability of these variable is 6777.472 and similarly their standard deviation is
82.32541. The smallest and the largest values of weekly food expenditure is 45 and 373. The
values of the three quartiles for weekly food expenditure are 126.75, 188.5 and 260.75.
Answer to the question (d)
It has been seen that the mean of the take home pay is larger than the median. Hence
the skewness of take home pay is positive and the value of the skewness is 0.338.
tabler-icon-diamond-filled.svg

Paraphrase This Document

Need a fresh take? Get an instant paraphrase of this document with our AI Paraphraser
Document Page
7
QUANTITATIVE ANALYSIS FOR BUSINESS
Similarly the mean of the weekly food expenditure is larger than the median.
Therefore the variable weekly food expenditure is positively skewed and the value of the
skewness is 0.113.
Part 3
Answer to the question (a)
The independent variable (X) in this study is take home pay and the dependent
variable (Y) in this study is weekly food expenditure.
Answer to the question (b)
Figure 3 Scatter plot on take home pay versus weekly food expenditure
The figure shows the scatter plot on take home pay versus weekly food expenditure. The
relationship between these two variable is strong positive and the value of the correlation is
0.9. In this figure the dotted line shows the linear trend line of the scatter plot.
Document Page
8
QUANTITATIVE ANALYSIS FOR BUSINESS
Answer to the question (c)
Table 3 Summary measure of Regression
The table 3 shows that the summary measure of regression. It has been seen that the
value of the R square is 0.9. Hence there is a strong positive linear relationship has been
founded between the take home pay versus weekly food expenditure.
Answer to the question (d)
Table 4 Regression output
The least square regression model for the take home pay and the weekly food
expenditure is as below
Y = a +b*X
Y = 38.39+0.31*X
Where Y = Weekly food expenditure
Document Page
9
QUANTITATIVE ANALYSIS FOR BUSINESS
X = Take home pay
In which “a” denotes the intercept and “b” denotes the slope of the regression model.
Answer to the question (e)
Null hypothesis (H0): There is no relationship between the weekly take home pay and
weekly food expenditure.
Alternative hypothesis (H1): There is a relationship between the weekly take home pay and
weekly food expenditure.
Table 5 ANOVA table
Result:
Test statistic = 739.530
Alpha = 0.05 (at 5% level of significance)
P- Value = 0.000
Conclusion:
It has been seen that the value of the P is smaller than the alpha at 5% level of
significance. Thus the hypothesis is significant. Hence it may be concluded at the
significance level 5% that there is positive linear relationship between the weekly take home
pay and weekly food expenditure.
tabler-icon-diamond-filled.svg

Paraphrase This Document

Need a fresh take? Get an instant paraphrase of this document with our AI Paraphraser
Document Page
10
QUANTITATIVE ANALYSIS FOR BUSINESS
Part 4
This study has been conducted the relationship between two variable. These are
weekly take home pay and weekly food expenditure. The researcher has been conducted the
cross sectional study between the weekly take home pay and weekly food expenditure. In
case of data collection, the simple random sampling technique has been applied. The
skewness of both the variable is positive. Moreover the summary statistics has also been
provided among these variables. The scatter plot or regression plot shows a positive
relationship between these variables. Also the hypothesis test shows the same result about the
relationship between these two variables. Hence it can be concluded that there is strong
positive linear relationship between the weekly take home pay and the weekly food
expenditure.
Document Page
11
QUANTITATIVE ANALYSIS FOR BUSINESS
Bibliography
Cameron, A.C. and Trivedi, P.K., 2013. Regression analysis of count data (Vol. 53).
Cambridge university press.
Chatterjee, S. and Hadi, A.S., 2015. Regression analysis by example. John Wiley & Sons.
Fox, J., 2015. Applied regression analysis and generalized linear models. Sage Publications.
George, D. and Mallery, P., 2016. Descriptive statistics. In IBM SPSS Statistics 23 Step by
Step (pp. 126-134). Routledge.
Hinton, P.R., 2014. Statistics explained. Routledge.
Ho, A.D. and Yu, C.C., 2015. Descriptive statistics for modern test score distributions:
Skewness, kurtosis, discreteness, and ceiling effects. Educational and Psychological
Measurement, 75(3), pp.365-388.
Holcomb, Z.C., 2016. Fundamentals of descriptive statistics. Routledge.
Javanmard, A. and Montanari, A., 2014. Confidence intervals and hypothesis testing for high-
dimensional regression. The Journal of Machine Learning Research, 15(1), pp.2869-2909.
chevron_up_icon
1 out of 12
circle_padding
hide_on_mobile
zoom_out_icon