MATH 1053: Q Events Case Study - Quantitative Business Analysis

Verified

Added on  2023/06/07

|14
|2188
|237
Case Study
AI Summary
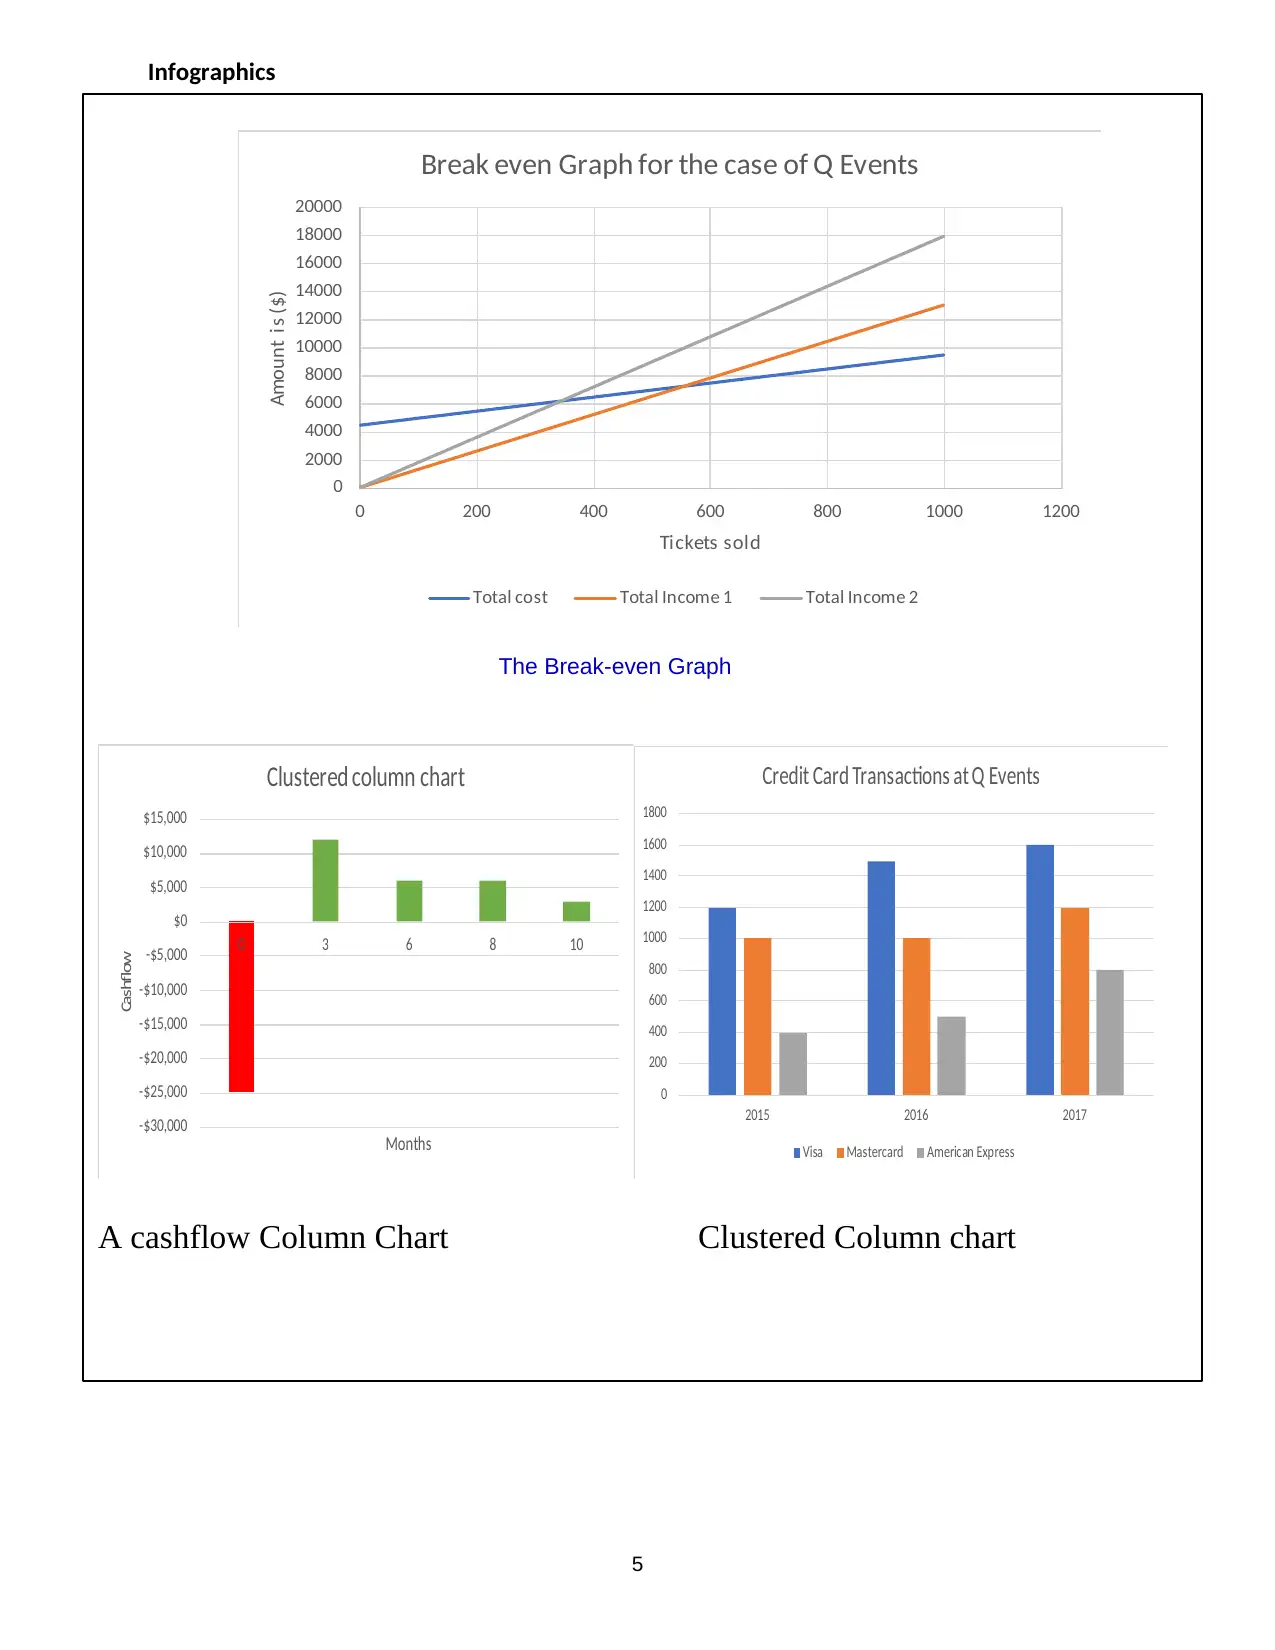
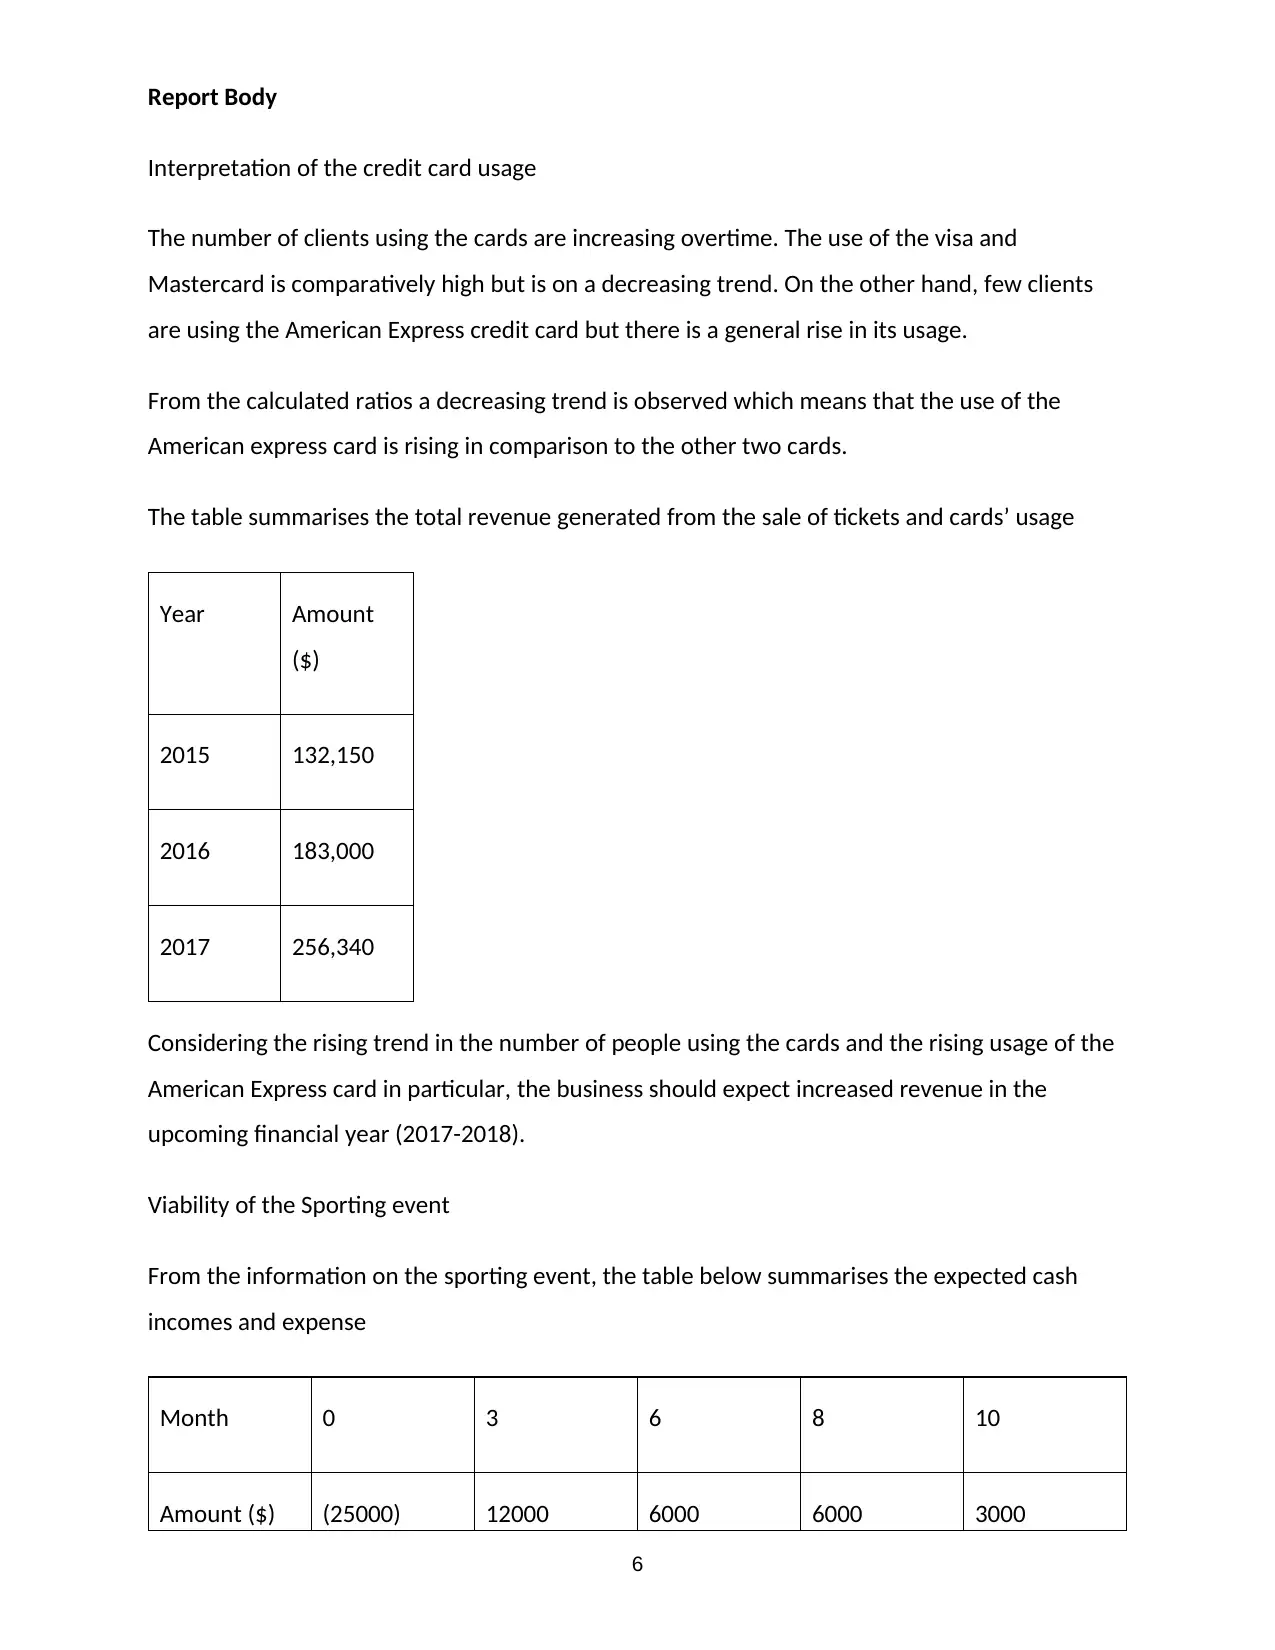
This report provides a quantitative analysis of Q Events' operations, focusing on optimizing profit and improving business practices. It examines credit card usage trends, evaluates the viability of a sporting event, and analyzes the profitability of the Vinothon event for both Q Events and its client. The analysis includes projected values, expected trends, and recommendations for setting ticket prices and minimum sales targets. The report concludes with suggestions to enhance services and maximize revenue generation, emphasizing the importance of critical pricing strategies and the impact of credit card usage patterns on the firm's financial performance. Key findings include the need to sell a minimum number of tickets for economic viability and the potential benefits of adjusting ticket prices to achieve breakeven with fewer sales.
tabler-icon-diamond-filled.svg

Contribute Materials

Your contribution can guide someone’s learning journey. Share your documents today.
Document Page
Error:
Refer
ence
sourc
e not
found
UNIVERSITY OF SOUTH AUSTRALIA
Assignment Cover Sheet – Internal
An Assignment cover sheet needs to be included with each assignment. Please complete all details
clearly.
When submitting the assignment online, please ensure this cover sheet is included at the start of your
document. (Not as a separate attachment.)
Please check your Course Information Booklet or contact your School Office for assignment submission
locations.
Name:
Student
ID
Email:
Course code and title: MATH 1053 – Quantitative Methods for Business
School: Info. Tech. & Mathematical Sciences Program Code:
Course Coordinator: Dr Nick Fewster-Young Tutor:
Day, Time, Location of Tutorial:
Assignment number: 1 Due date: by 12 noon on Tuesday 4th
September, 2018
Assignment topic as stated in Course Outline: Case Study Report
tabler-icon-diamond-filled.svg

Secure Best Marks with AI Grader

Need help grading? Try our AI Grader for instant feedback on your assignments.
Document Page
Further Information: (e.g. state if extension was granted and attach evidence of approval, Revised
Submission Date)
I declare that the work contained in this assignment is my own, except where acknowledgement of sources is
made.
I authorise the University to test any work submitted by me, using text comparison software, for instances of
plagiarism. I understand this will involve the University or its contractor copying my work and storing it on a
database to be used in future to test work submitted by others.
I understand that I can obtain further information on this matter at
http://www.unisanet.unisa.edu.au/learningconnection/student/studying/integrity.asp
Note: The attachment of this statement on any electronically submitted assignments will be deemed to have
the same authority as a signed statement.
Signed: Date:
Date received from student Assessment/grade Assessed by:
Recorded: Dispatched (if applicable):
ii
Document Page
Quantitative analysis of the operation of Q Events
[Enter the date of submission]
prepared by
[Enter your name]
iii
Document Page
Introduction (3 marks)
Following the need by Gregory Lux to optimise the profit of the Q Events as well as improve its
operation, this report gives a feed back in to a quantitative analysis of the business operations.
The report starts by looking at the trend in the usage of the credit cards. This will assist the
manager project the expected change in revenue generation.
Going forward will evaluate the viability of the sporting event to be undertaken by the firm. This
area will allow the management make appropriate decision on whether to proceed with the
event or not.
Finally, by analysing the profitability of the Vinothon to Q Events and the client, the report will
contain some of the projected values and expected trends. This will guide the firm to design
price of tickets and the minimum number of ticket sales needed so as to accept carrying out the
event. Afterwards, the report finalises by giving recommendations that will assist the firm better
its services and maximise the revenue generation.
4
tabler-icon-diamond-filled.svg

Secure Best Marks with AI Grader

Need help grading? Try our AI Grader for instant feedback on your assignments.
Document Page
Infographics
0
2000
4000
6000
8000
10000
12000
14000
16000
18000
20000
0 200 400 600 800 1000 1200
Amount is ($)
Tickets sold
Break even Graph for the case of Q Events
Total cost Total Income 1 Total Income 2
The Break-even Graph
-$30,000
-$25,000
-$20,000
-$15,000
-$10,000
-$5,000
$0
$5,000
$10,000
$15,000
0 3 6 8 10
Cashflow
Months
Clustered column chart
0
200
400
600
800
1000
1200
1400
1600
1800
2015 2016 2017
Credit Card Transactions at Q Events
Visa Mastercard American Express
A cashflow Column Chart Clustered Column chart
5
Document Page
Report Body
Interpretation of the credit card usage
The number of clients using the cards are increasing overtime. The use of the visa and
Mastercard is comparatively high but is on a decreasing trend. On the other hand, few clients
are using the American Express credit card but there is a general rise in its usage.
From the calculated ratios a decreasing trend is observed which means that the use of the
American express card is rising in comparison to the other two cards.
The table summarises the total revenue generated from the sale of tickets and cards’ usage
Year Amount
($)
2015 132,150
2016 183,000
2017 256,340
Considering the rising trend in the number of people using the cards and the rising usage of the
American Express card in particular, the business should expect increased revenue in the
upcoming financial year (2017-2018).
Viability of the Sporting event
From the information on the sporting event, the table below summarises the expected cash
incomes and expense
Month 0 3 6 8 10
Amount ($) (25000) 12000 6000 6000 3000
6
Document Page
The Q Events values money at a rate of 10% which is payable at the end of every month.
At the rate of 10% Q Events will make a profit of $ 789 from undertaking the sporting event. The
firm should therefore go ahead and proceed with the event since it is financially viable.
Evaluation of the Break-even point
From the information on the Vinothon, a ticket will go for $ 60.
The client will incur the following costs; a fluctuating cost of $ 20 per ticket sold, unavoidable
total cost of $ 15000.
On the other hand, Q Events will incur the following costs; a fluctuating cost of $ 5 per ticket
sold, and unavoidable total cost of $ 4500.
For the events to be carried out at a net profit of $ 0;
In the case of the client, there should be a sale of 536 tickets, this will yield a revenue of $ 25728
For the case of Q Events, there should be a sale of 560 tickets this will generate a revenue of $
7308.
In a case where only the client manages to obtain a profit of $ 0, then Q Events will make a loss
of $ 185.20.
This means that the scenario where the client makes $ 0 profit will not be acceptable for Q
Events as the frim will end up losing capital.
For Q Events to make a profit of $ 2000 when 500 tickets are sold then the selling price for each
ticket must be set at $ 82.76.
Q Events should run the event at the new price since at this price the firm need to sell fewer
tickets before it reaches the breakeven point.
7
tabler-icon-diamond-filled.svg

Paraphrase This Document

Need a fresh take? Get an instant paraphrase of this document with our AI Paraphraser
Document Page
Conclusion and recommendation
The operations of the Q Events just like all other businesses is price sensitive. This means that
the management must think critically and analytically before setting the price for a ticket. In
addition to this the type of credit card used to make the online payment have a significant effect
on the revenue generation of the firm. Currently the use of Visa and Mastercard is still
dominant, the general trend though shows that the usage of the American Express is relatively
on a rise. This will mean more revenue generation for the firm in the near future.
By undertaking the breakeven analysis, the firm is able to set effective targets. For instance, in
regard to undertaking the Vinothon events the analysis indicates that the firm should at least be
able to sell 560 tickets for the event to be economically viable. Moreover, the modification of
the ticket price upwards means reaching the breakeven point with less fewer ticket sales. This a
favourable position for the firm. The management should therefore adopt it.
8
Document Page
Appendix 1 (15 marks): Analysis of the Credit usage patterns
a) Ratio calculations
The table below gives the ratio of the visa and Mastercard usage to that of American
Express usage given as percentage
Visa and Mastercard 2200 2500 2800
American Express 400 500 800
Ratio 550.00% 500.00% 350.00%
b) The total average revenue for each of the financial years 2015,2016 and 2017 are given
by the tables below
2015 2016 2017 Commision
Visa 1200 1500 1600 1.5%
Mastercard 1000 1000 1200 1.5%
American Express 400 500 800 2.5%
Credit card Transcations at Q Events
Number of Credit Card Transactions at Q Events
2015 2016 2017
Price $50 $60 $70
Average Revenue Visa $60,900 $91,350 $113,680
Mastercard $50,750 $60,900 $85,260
American Express $20,500 $30,750 $57,400
Total $132,150 $183,000 $256,340
Average Price of a ticket at Q Events
c) The graph indicates the clustered column chart visualizing number of credit cards usage
9
Document Page
Appendix 2 (10 marks): Analysing the viability of the sporting event
a) Calculating the Net Present Value of the cashflow from the sporting event.
The table gives an illustration of the Net present value of the cashflow from the sporting
events
Rate 10.00%
Time (months) 0 3 6 8 10
Cashflow -$25,000 $12,000 $6,000 $6,000 $3,000
Compounding value 1 0.975411 0.951427 0.935765 0.920362
Present value -$25,000 $11,705 $5,709 $5,615 $2,761
Net present value $789
From the table the Net Present value of obtained as $ 789. This value is greater than 0.
This indicates that at an interest of 10%, the firm will generate a profit by undertaking
the sporting event. The event is financially viable hence Q Events should go ahead and
undertake it.
b) A column chart of the cashflows from the event
10
tabler-icon-diamond-filled.svg

Secure Best Marks with AI Grader

Need help grading? Try our AI Grader for instant feedback on your assignments.
Document Page
Appendix 3 (25 Marks): Break-even Analysis
a) Vinothon
i) The break-even number of tickets to be sold in the case of the
client.
The break-even point is the point of operation at which the client
will make $ 0 profit.
It is obtained using the formula
Tickets= f
sv
Where f is the fixed cost, s revenue per unit and v variable cost per
unit
Now calculating the parameters
Fixed cost
This will be the total amount paid for the venue hire which is $
15,000
Variable cost
This is the cost paid for each attendee’s catering, it is $ 20.
11
Document Page
Revenue per unit
¿ 0.860=$ 48
Now
x= 15000
4820 =535.71 which is equivalent to 536 units
ii) The break-even number of tickets for the case of Q Events
x= f
( sv )
For the case of Q Events, f is ( 1000+2000+1500 )=4500, s is
( 0.017560 ) + ( 0.260 )=13.05
The variable cost is $ 5
Now
x= 4500
13.055 =559.01, this is approximately 560 tickets
iii) Q Event revue at break even
The number of tickets sold is 560
For each ticket Q Event makes 13.05
This gives a total of 13.05560=$ 7308
b) In a case where the client break-even
The number of tickets sold are 536
This gives a revenue of 53613.05=$ 6994.80
And a total cost of ( 4500+ ( 5365 ) )=$ 7180
This gives a net loss of ¿
Q Events will make a net loss of $ 185.20
c) Selling 500 tickets
This results in a cost of
¿
Profit is obtained by Revenuecost
Taking x as the total revenue then to make a profit of $ 20000, then
x=(2000+7000)=¿$ 9000
12
Document Page
Now we evaluate the projected selling price.
Let the selling price be given by y, then ( 0.2y ) + ( 0.0175y ) =9000
We get the selling price as y= 9000
0.2175500 =$ 82.76
When the selling price is $ 82.76, and the tickets sold are 500, then the client
will, make a revenue of
0.850082.76=$ 33104 at a cost of (15000+ ( 20500 )=$ 25000
This gives a net profit of $ 8,104 for the client.
d) Break even
13
tabler-icon-diamond-filled.svg

Paraphrase This Document

Need a fresh take? Get an instant paraphrase of this document with our AI Paraphraser
Document Page
References
Ghysels, E. a. A. H., 2002. Editors' Introduction to Twentieth Anniversary Commemorative Issue
of the Journal of Business and Economic Statistics. Journal of Business & Economic Statistics,
20(1).
Morien, D., 2007. Business Statistics, s.l.: Thomson Learning Nelson.
vom Brocke, J. &. R. M., 2010. Handbook on Business Process Management: Strategic
Alignment, Governance, People and Culture (International Handbooks on Information Systems),
Berlin: Springer.
Wegner, T., 2010. Applied Business Statistics: Methods and Excel-Based Applications, s.l.: Juta
Academic.
14
chevron_up_icon
1 out of 14
circle_padding
hide_on_mobile
zoom_out_icon
logo.png

Your All-in-One AI-Powered Toolkit for Academic Success.

Available 24*7 on WhatsApp / Email

[object Object]