Quantitative Analysis of Resistance Training in Sport and Exercise

Verified

Added on  2020/07/22

|10
|943
|32
Report
AI Summary
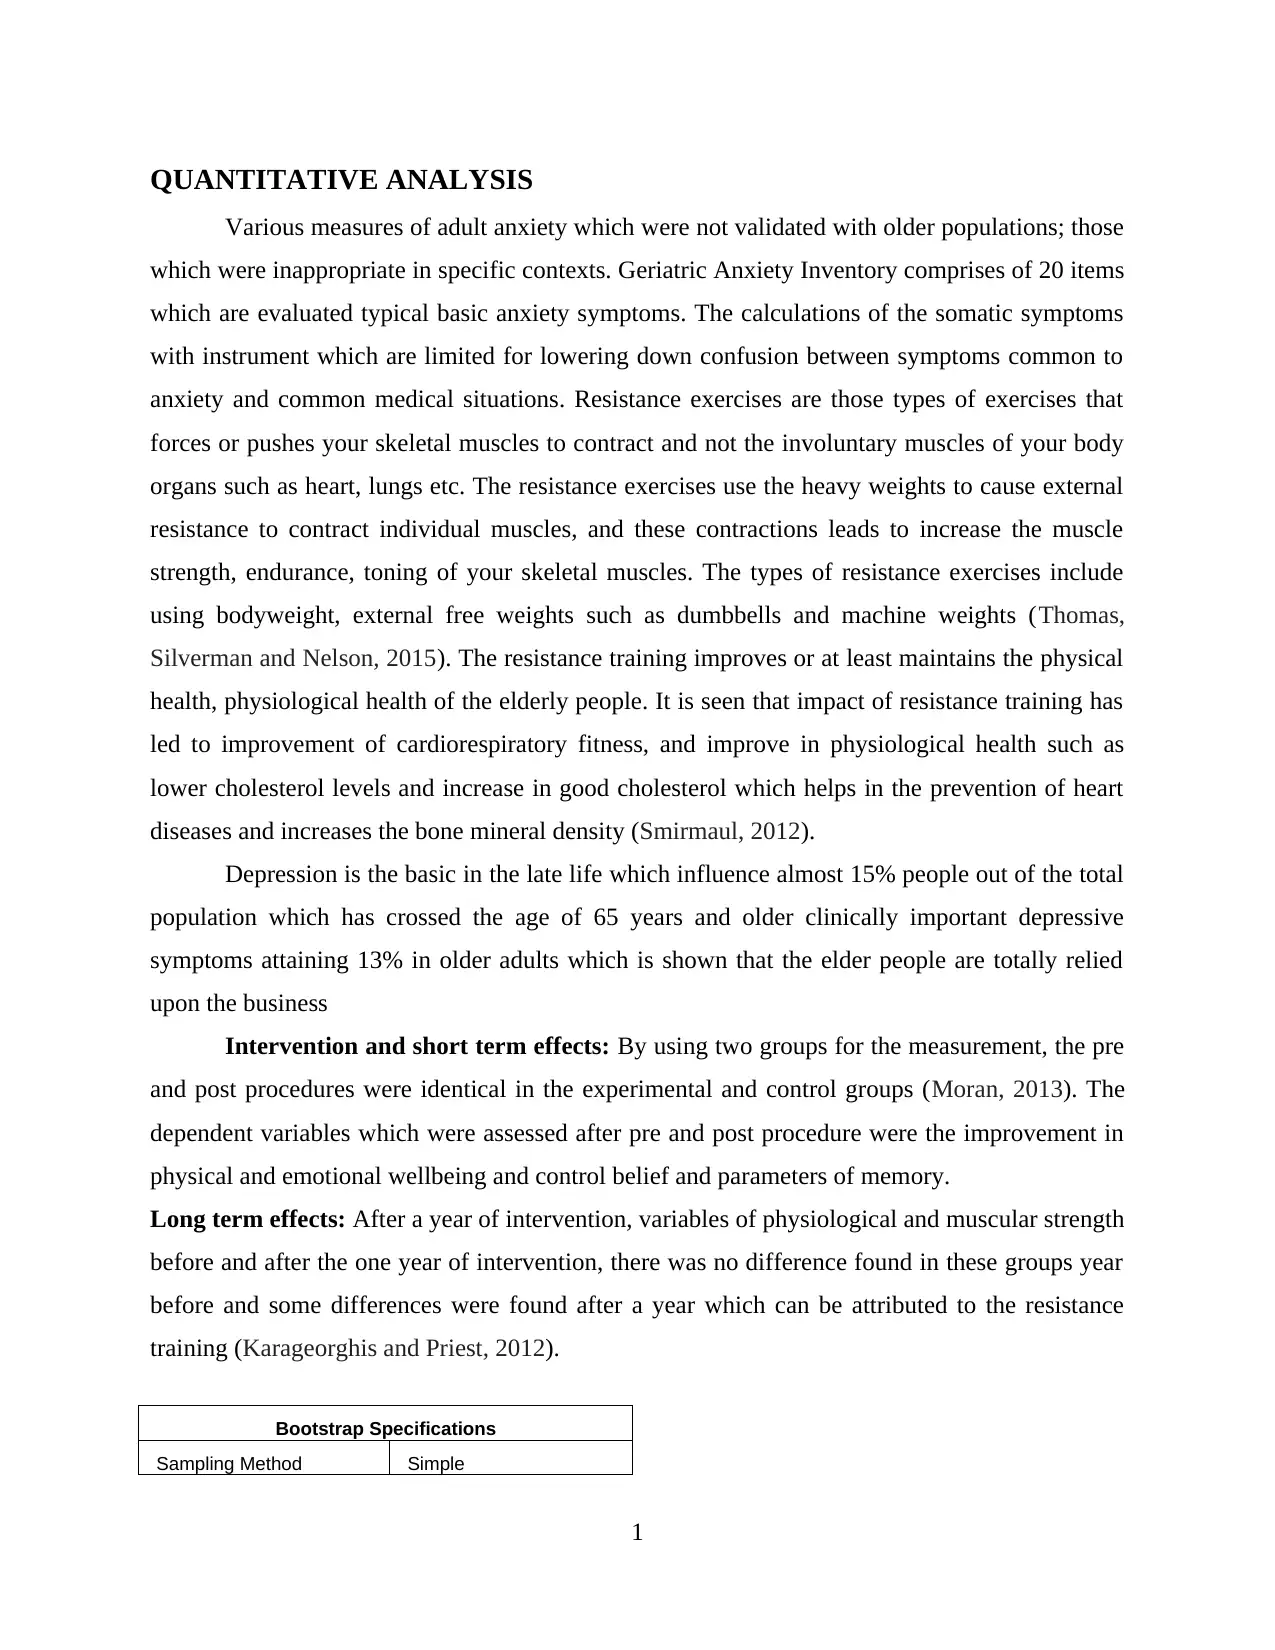
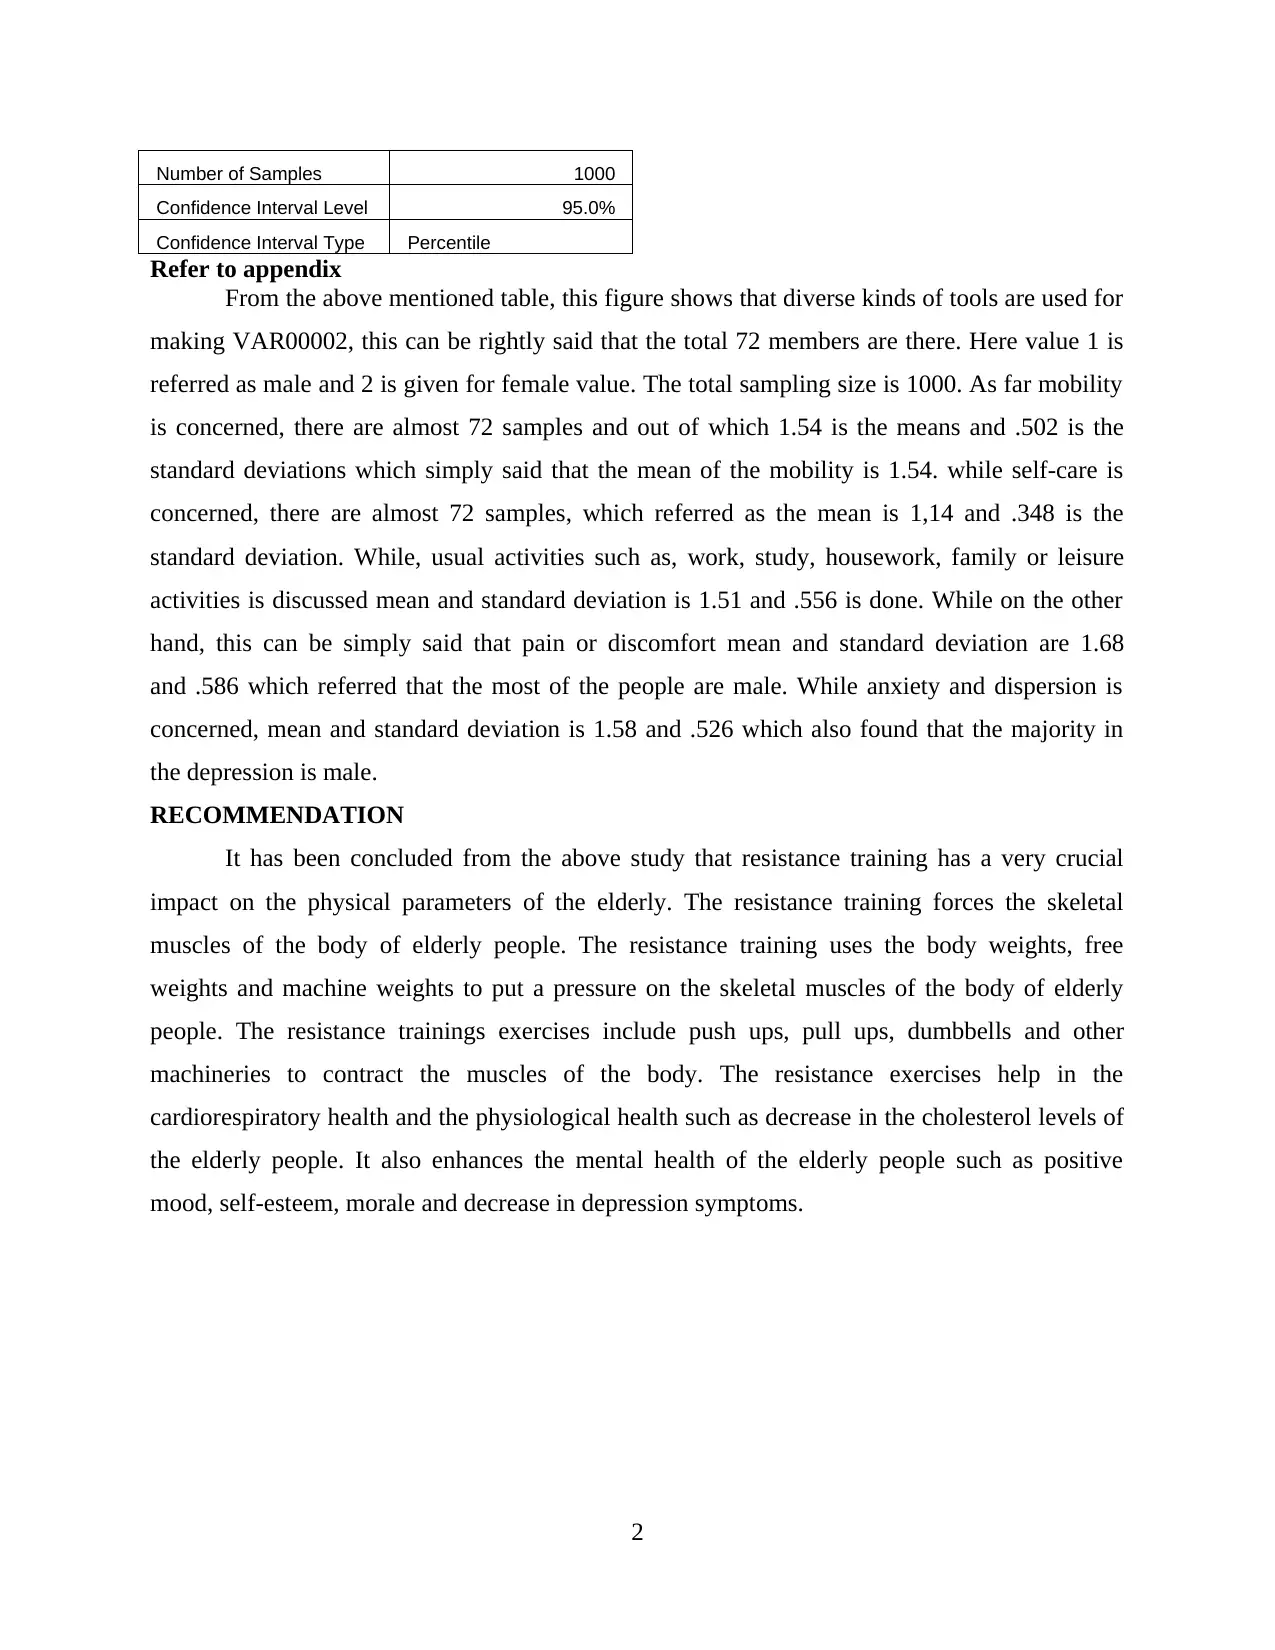
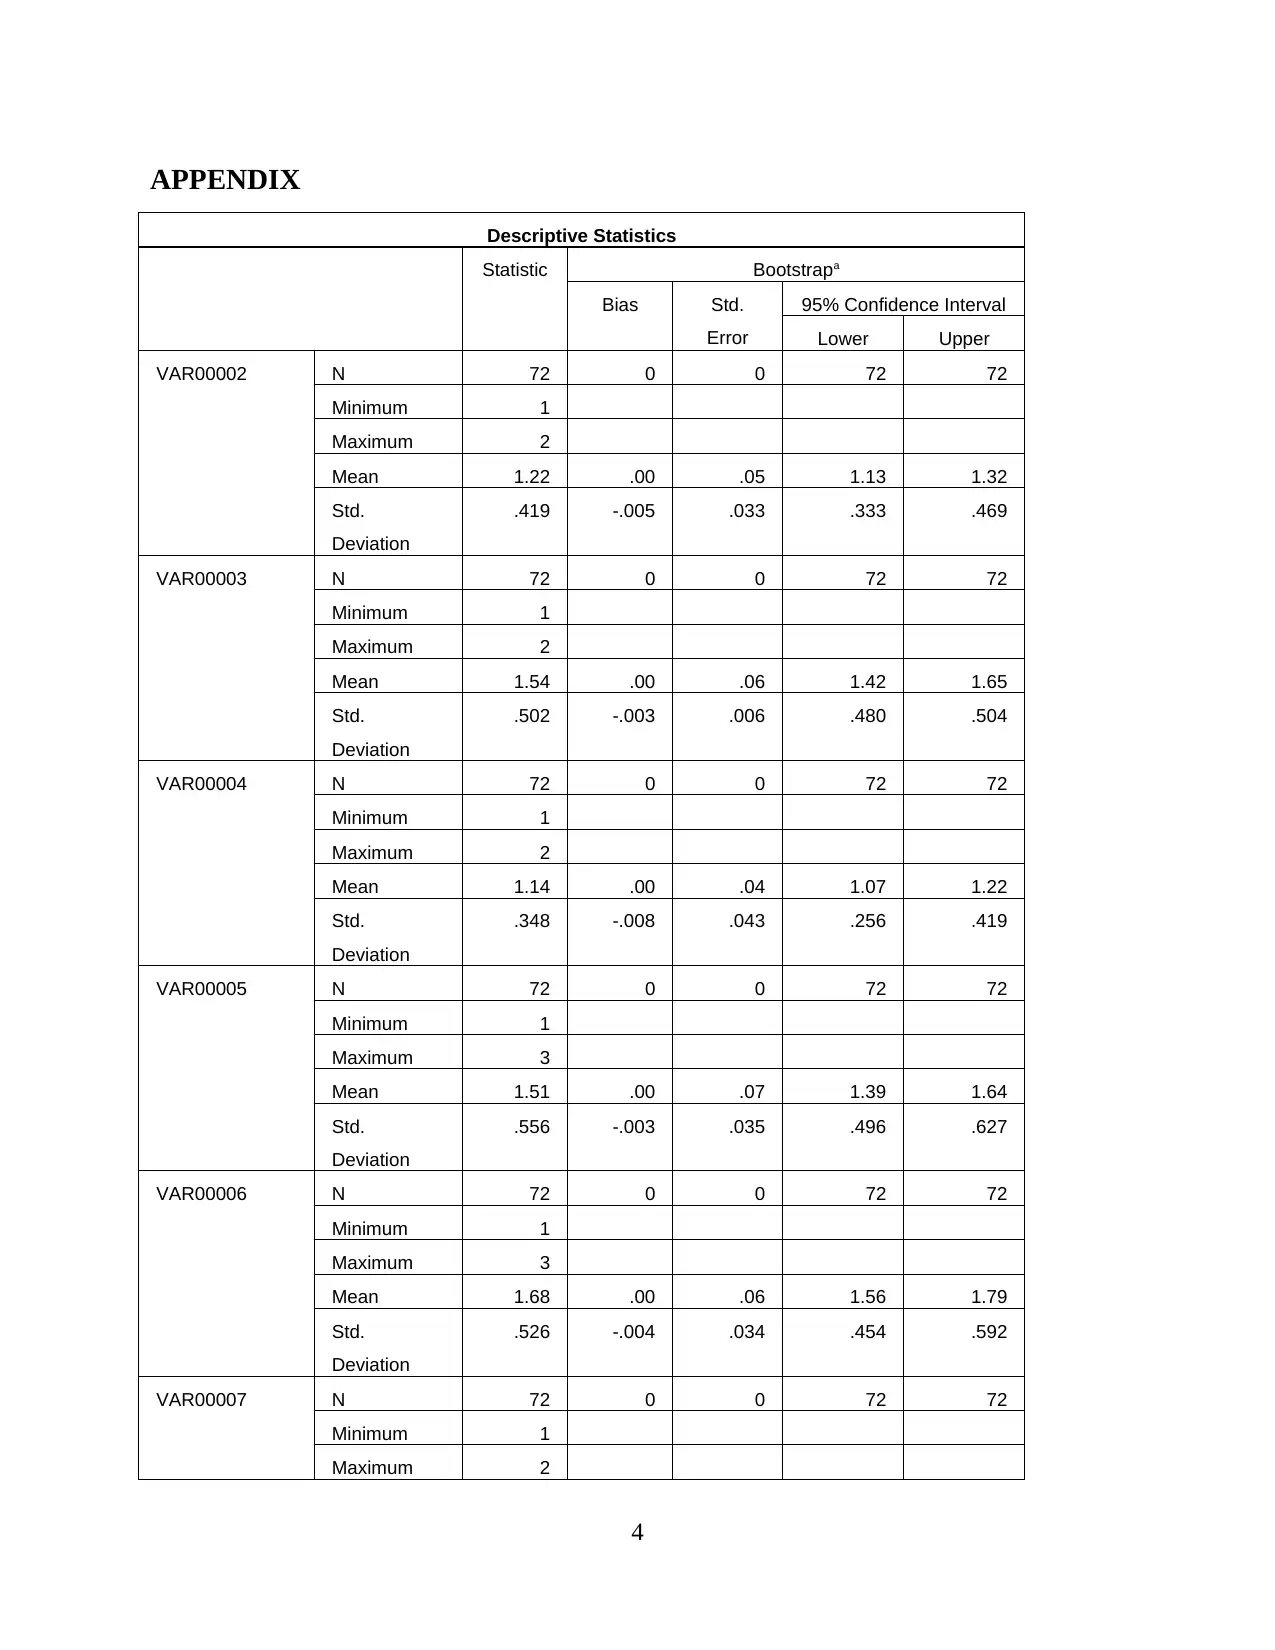
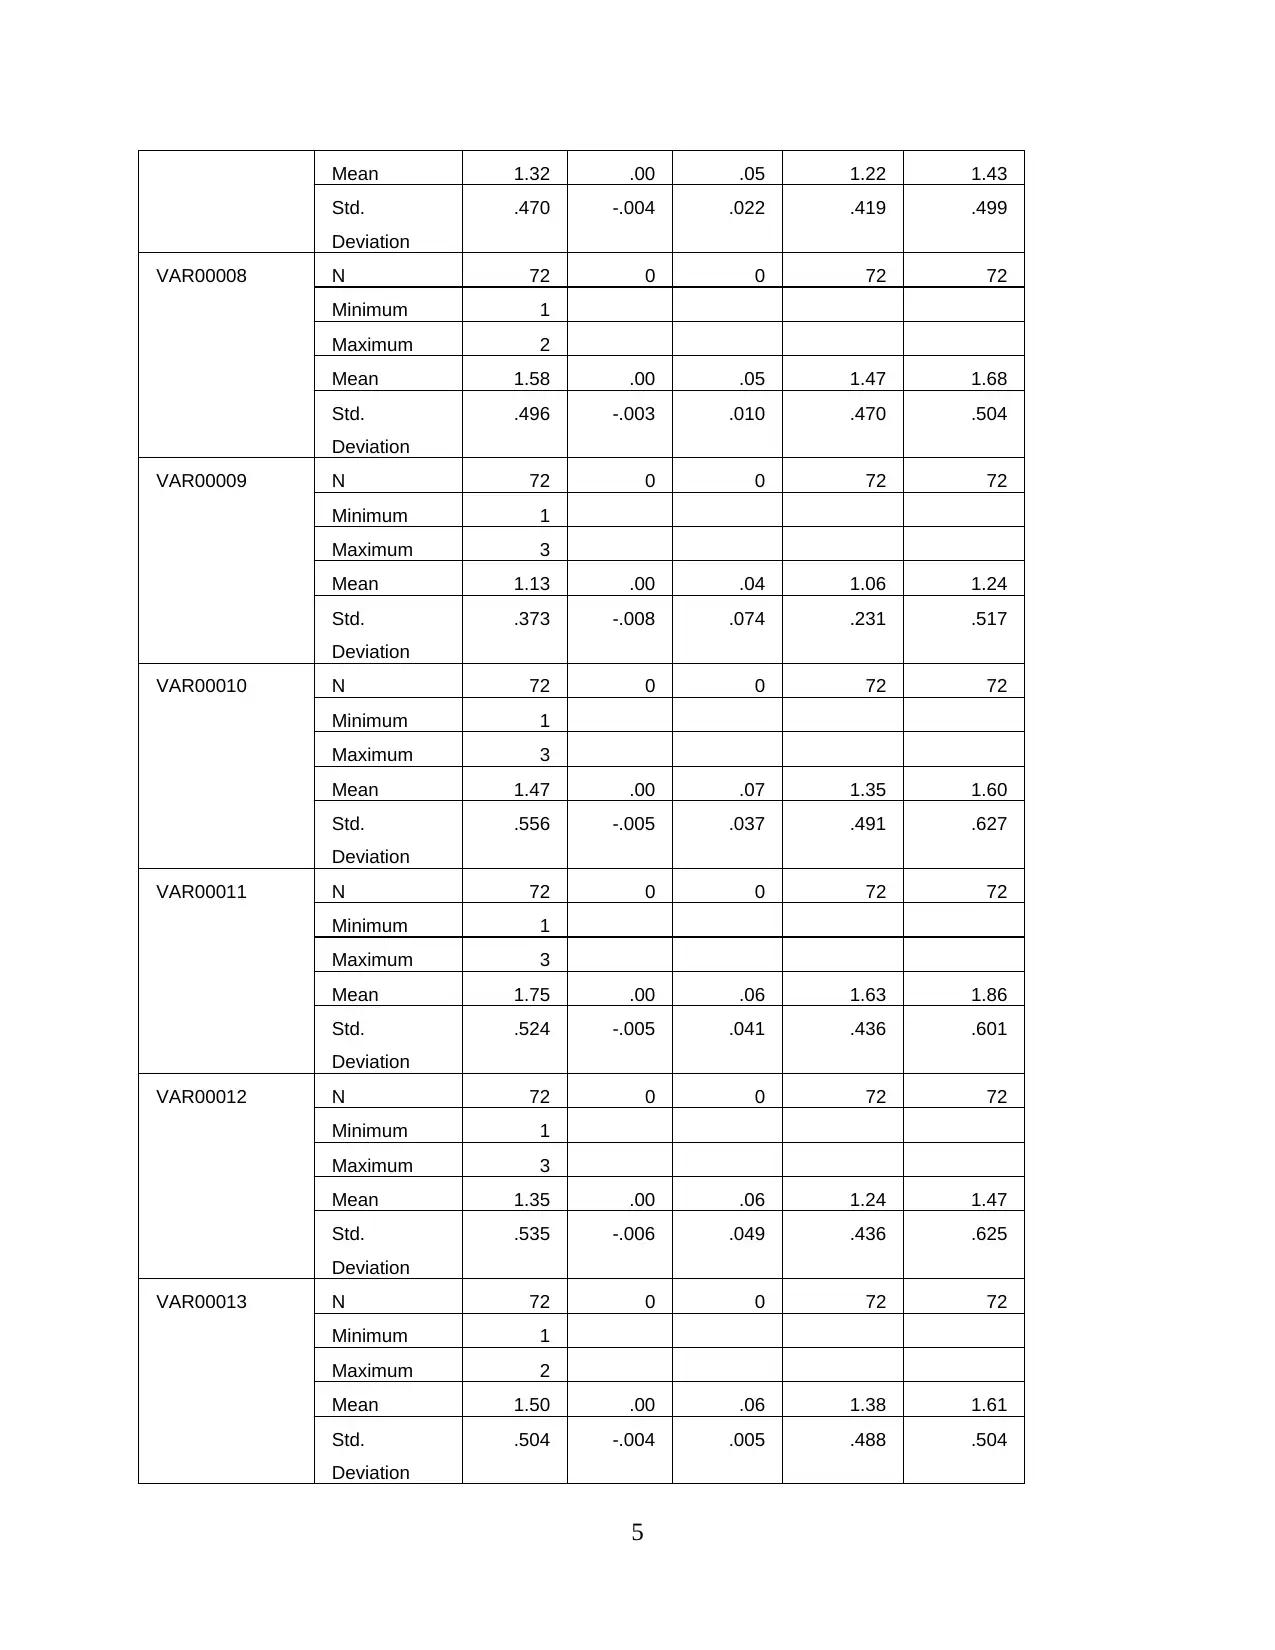
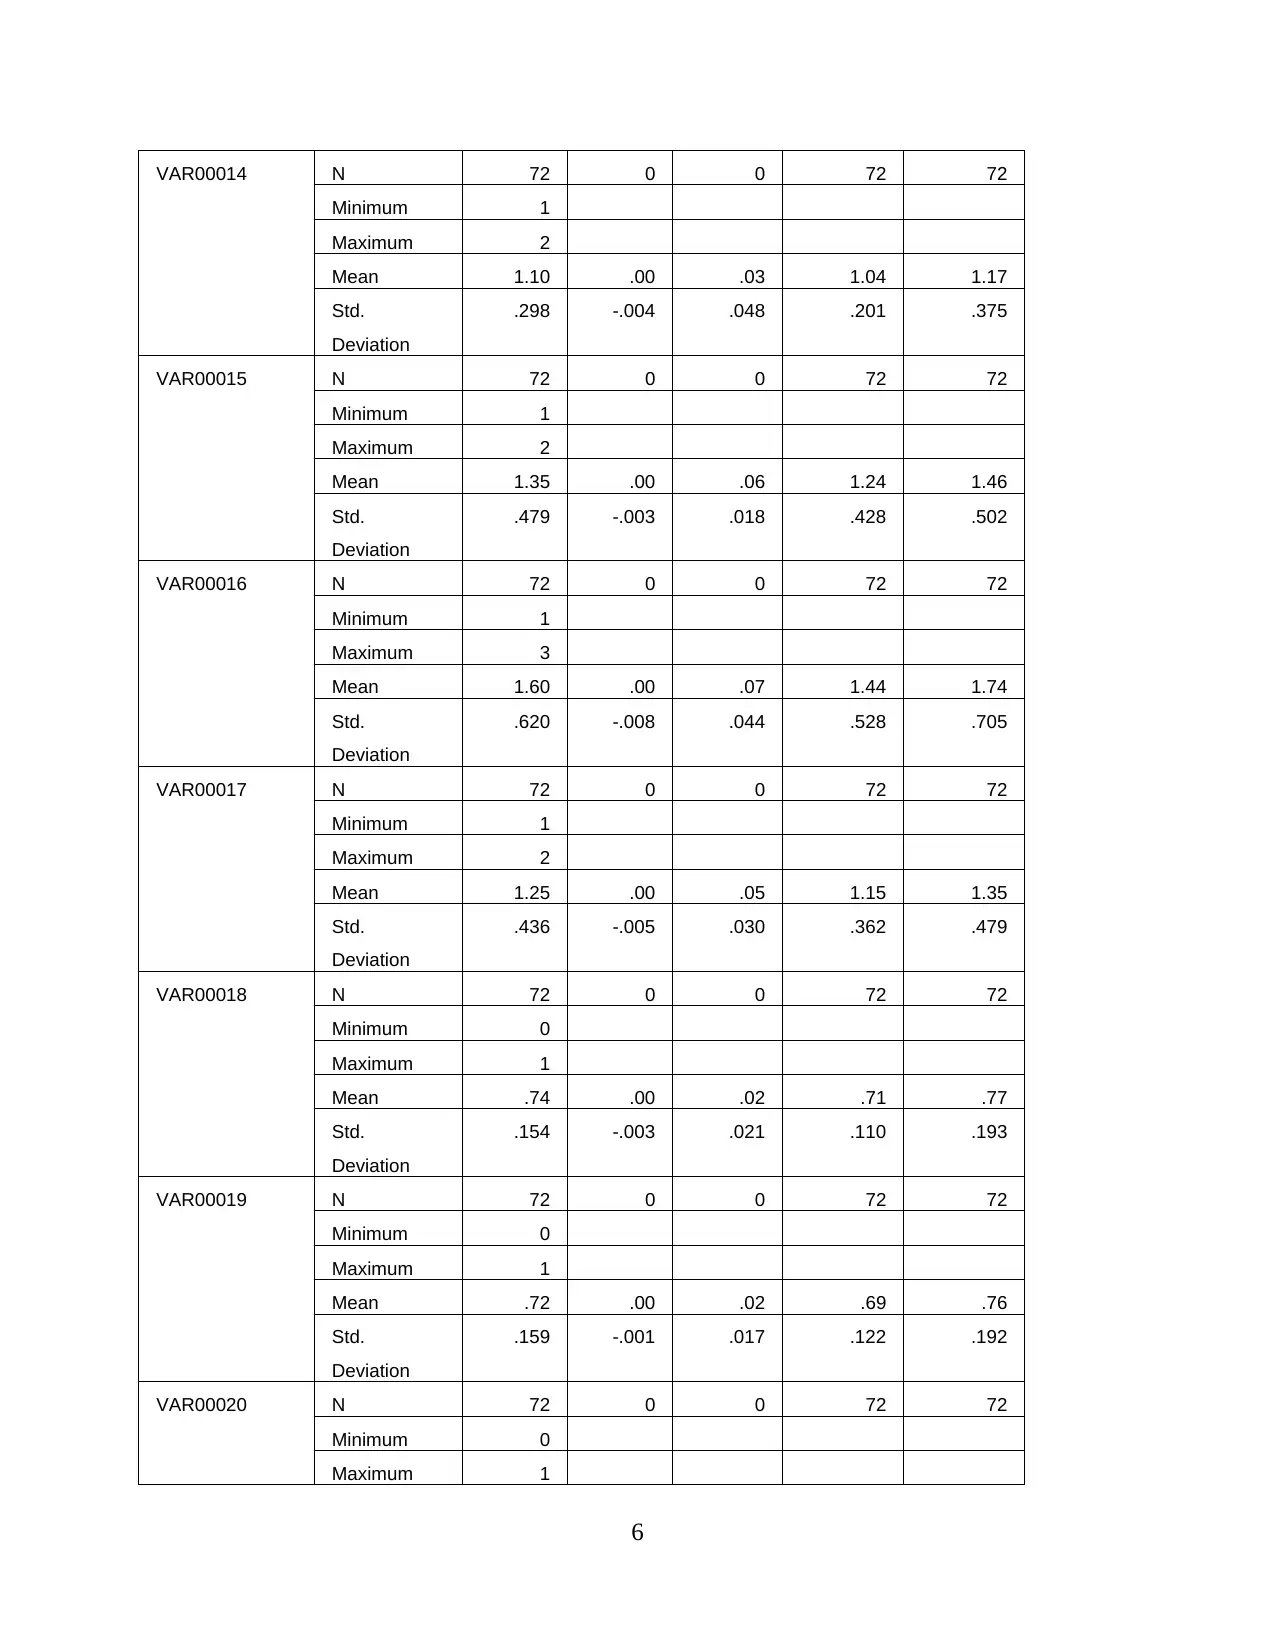
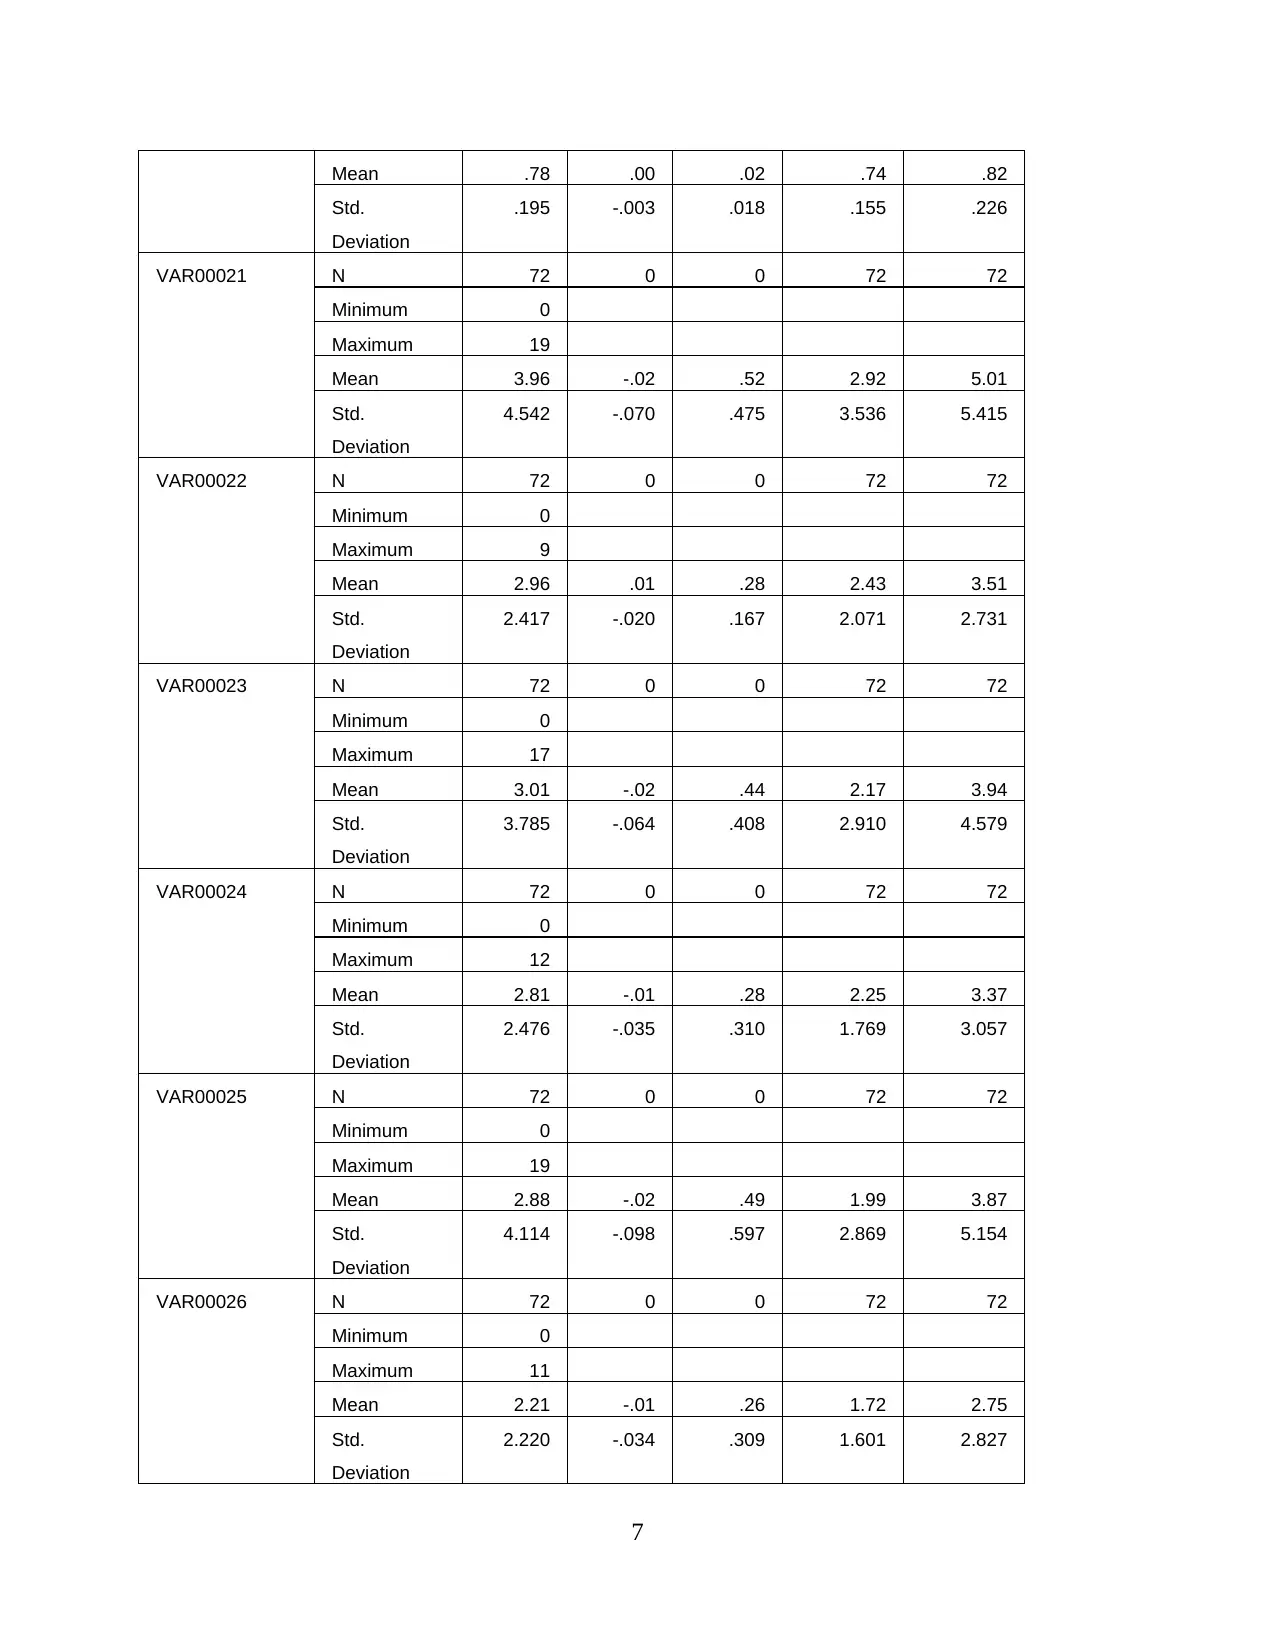
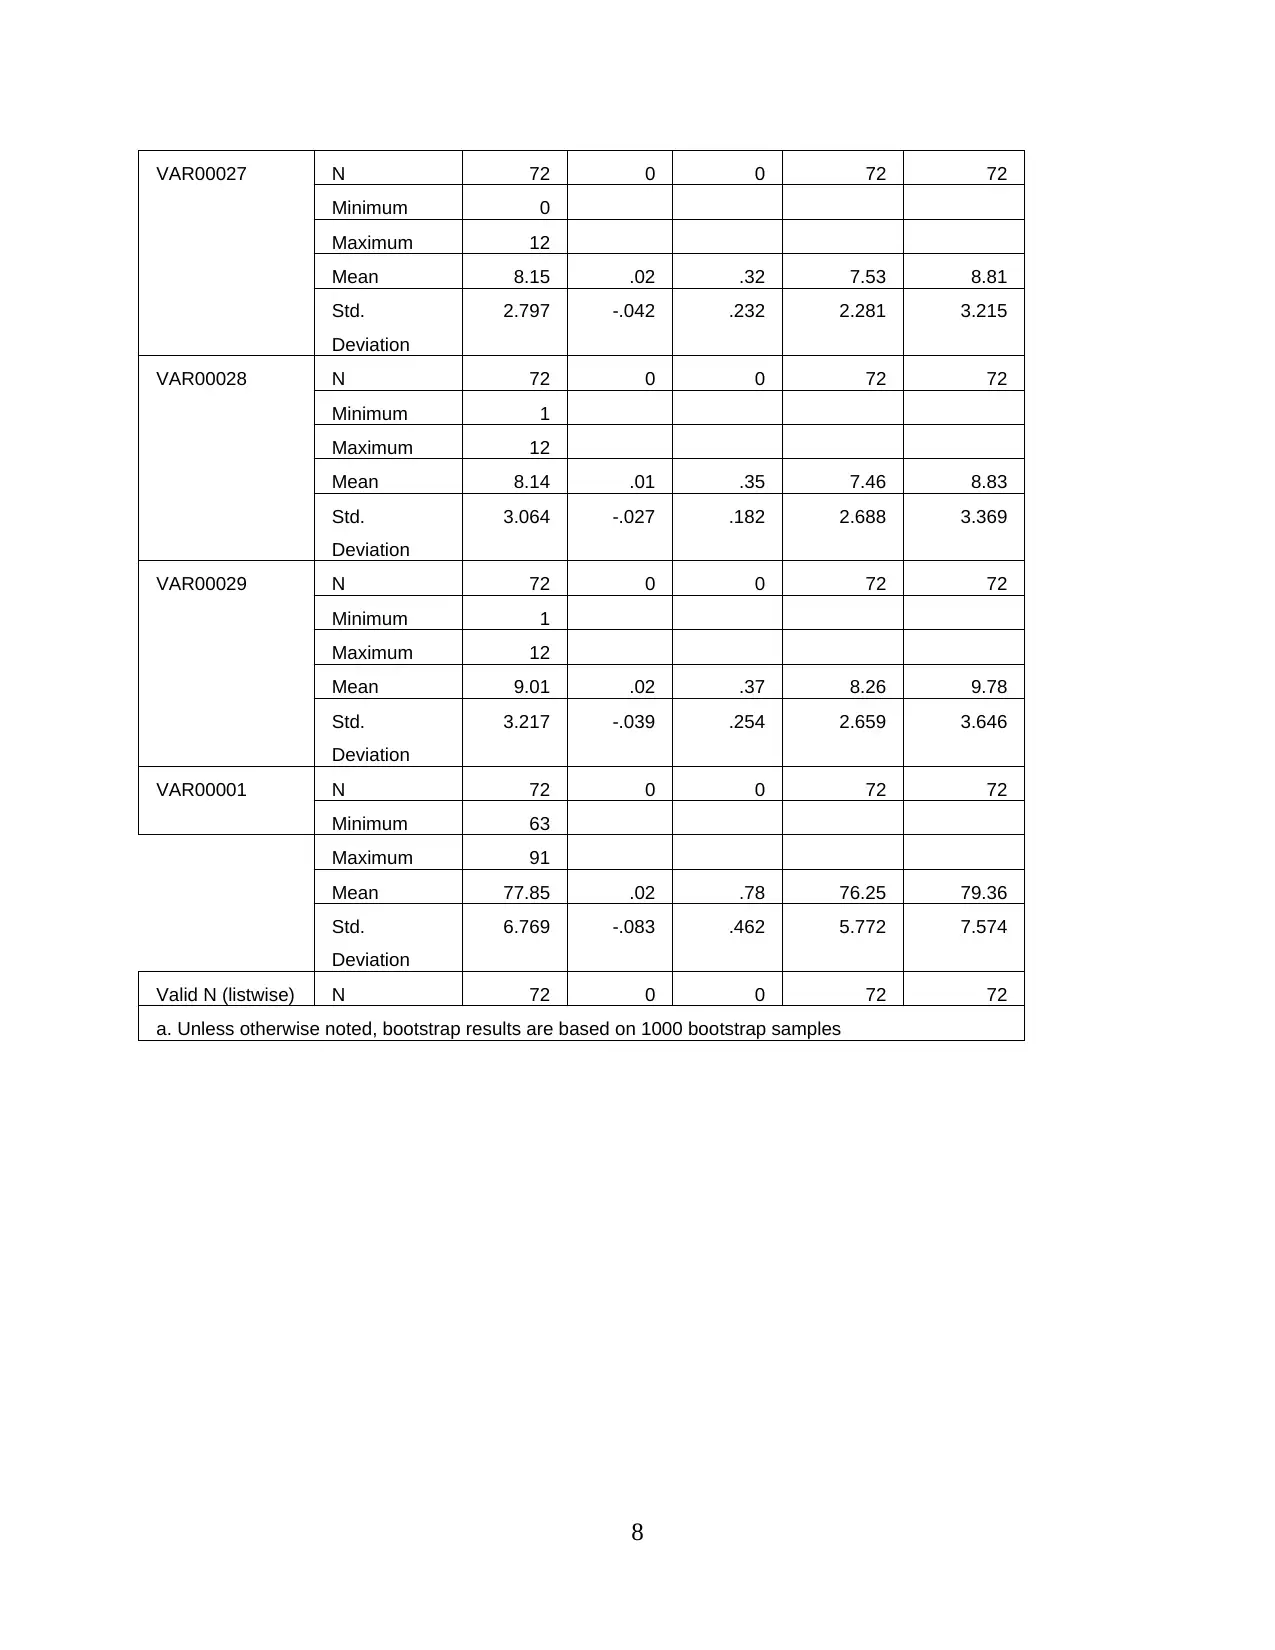
This report presents a quantitative analysis of research concepts in sport and exercise science, specifically focusing on the impact of resistance training on elderly individuals. The analysis includes an examination of various assessment tools, such as the Geriatric Anxiety Inventory, and discusses the limitations of these tools in specific contexts. The report explores the effects of resistance exercises on muscle strength, endurance, and overall health, including cardiorespiratory fitness and physiological health improvements like lower cholesterol levels. The research also investigates the impact of resistance training on depression and mental health in the elderly, referencing pre and post-intervention studies. The report includes a bootstrap specification table detailing sampling methods and confidence intervals and concludes with recommendations based on the study's findings, emphasizing the crucial role of resistance training in enhancing both physical and mental well-being in the elderly. References to key research papers and books support the analysis.
Document Page
Research Concepts in
Sport and Exercise
Science
tabler-icon-diamond-filled.svg

Paraphrase This Document

Need a fresh take? Get an instant paraphrase of this document with our AI Paraphraser
Document Page
Contents
QUANTITATIVE ANALYSIS.......................................................................................................1
REFERENCES................................................................................................................................3
APPENDIX......................................................................................................................................4
Document Page
QUANTITATIVE ANALYSIS
Various measures of adult anxiety which were not validated with older populations; those
which were inappropriate in specific contexts. Geriatric Anxiety Inventory comprises of 20 items
which are evaluated typical basic anxiety symptoms. The calculations of the somatic symptoms
with instrument which are limited for lowering down confusion between symptoms common to
anxiety and common medical situations. Resistance exercises are those types of exercises that
forces or pushes your skeletal muscles to contract and not the involuntary muscles of your body
organs such as heart, lungs etc. The resistance exercises use the heavy weights to cause external
resistance to contract individual muscles, and these contractions leads to increase the muscle
strength, endurance, toning of your skeletal muscles. The types of resistance exercises include
using bodyweight, external free weights such as dumbbells and machine weights (Thomas,
Silverman and Nelson, 2015). The resistance training improves or at least maintains the physical
health, physiological health of the elderly people. It is seen that impact of resistance training has
led to improvement of cardiorespiratory fitness, and improve in physiological health such as
lower cholesterol levels and increase in good cholesterol which helps in the prevention of heart
diseases and increases the bone mineral density (Smirmaul, 2012).
Depression is the basic in the late life which influence almost 15% people out of the total
population which has crossed the age of 65 years and older clinically important depressive
symptoms attaining 13% in older adults which is shown that the elder people are totally relied
upon the business
Intervention and short term effects: By using two groups for the measurement, the pre
and post procedures were identical in the experimental and control groups (Moran, 2013). The
dependent variables which were assessed after pre and post procedure were the improvement in
physical and emotional wellbeing and control belief and parameters of memory.
Long term effects: After a year of intervention, variables of physiological and muscular strength
before and after the one year of intervention, there was no difference found in these groups year
before and some differences were found after a year which can be attributed to the resistance
training (Karageorghis and Priest, 2012).
Bootstrap Specifications
Sampling Method Simple
1
Document Page
Number of Samples 1000
Confidence Interval Level 95.0%
Confidence Interval Type Percentile
Refer to appendix
From the above mentioned table, this figure shows that diverse kinds of tools are used for
making VAR00002, this can be rightly said that the total 72 members are there. Here value 1 is
referred as male and 2 is given for female value. The total sampling size is 1000. As far mobility
is concerned, there are almost 72 samples and out of which 1.54 is the means and .502 is the
standard deviations which simply said that the mean of the mobility is 1.54. while self-care is
concerned, there are almost 72 samples, which referred as the mean is 1,14 and .348 is the
standard deviation. While, usual activities such as, work, study, housework, family or leisure
activities is discussed mean and standard deviation is 1.51 and .556 is done. While on the other
hand, this can be simply said that pain or discomfort mean and standard deviation are 1.68
and .586 which referred that the most of the people are male. While anxiety and dispersion is
concerned, mean and standard deviation is 1.58 and .526 which also found that the majority in
the depression is male.
RECOMMENDATION
It has been concluded from the above study that resistance training has a very crucial
impact on the physical parameters of the elderly. The resistance training forces the skeletal
muscles of the body of elderly people. The resistance training uses the body weights, free
weights and machine weights to put a pressure on the skeletal muscles of the body of elderly
people. The resistance trainings exercises include push ups, pull ups, dumbbells and other
machineries to contract the muscles of the body. The resistance exercises help in the
cardiorespiratory health and the physiological health such as decrease in the cholesterol levels of
the elderly people. It also enhances the mental health of the elderly people such as positive
mood, self-esteem, morale and decrease in depression symptoms.
2
tabler-icon-diamond-filled.svg

Paraphrase This Document

Need a fresh take? Get an instant paraphrase of this document with our AI Paraphraser
Document Page
REFERENCES
Books and Journals
Thomas, J.R., Silverman, S. and Nelson, J., 2015. Research methods in physical activity, 7E.
Human kinetics.
Moran, A.P., 2013. Sport and exercise psychology: A critical introduction. Routledge.
Smirmaul, B.D.P.C., 2012. Sense of effort and other unpleasant sensations during exercise:
clarifying concepts and mechanisms. Br J Sports Med, 46(5), pp.308-311.
Karageorghis, C.I. and Priest, D.L., 2012. Music in the exercise domain: a review and synthesis
(Part II). International review of sport and exercise psychology, 5(1), pp.67-84.
3
Document Page
APPENDIX
Descriptive Statistics
Statistic Bootstrapa
Bias Std.
Error
95% Confidence Interval
Lower Upper
VAR00002 N 72 0 0 72 72
Minimum 1
Maximum 2
Mean 1.22 .00 .05 1.13 1.32
Std.
Deviation
.419 -.005 .033 .333 .469
VAR00003 N 72 0 0 72 72
Minimum 1
Maximum 2
Mean 1.54 .00 .06 1.42 1.65
Std.
Deviation
.502 -.003 .006 .480 .504
VAR00004 N 72 0 0 72 72
Minimum 1
Maximum 2
Mean 1.14 .00 .04 1.07 1.22
Std.
Deviation
.348 -.008 .043 .256 .419
VAR00005 N 72 0 0 72 72
Minimum 1
Maximum 3
Mean 1.51 .00 .07 1.39 1.64
Std.
Deviation
.556 -.003 .035 .496 .627
VAR00006 N 72 0 0 72 72
Minimum 1
Maximum 3
Mean 1.68 .00 .06 1.56 1.79
Std.
Deviation
.526 -.004 .034 .454 .592
VAR00007 N 72 0 0 72 72
Minimum 1
Maximum 2
4
Document Page
Mean 1.32 .00 .05 1.22 1.43
Std.
Deviation
.470 -.004 .022 .419 .499
VAR00008 N 72 0 0 72 72
Minimum 1
Maximum 2
Mean 1.58 .00 .05 1.47 1.68
Std.
Deviation
.496 -.003 .010 .470 .504
VAR00009 N 72 0 0 72 72
Minimum 1
Maximum 3
Mean 1.13 .00 .04 1.06 1.24
Std.
Deviation
.373 -.008 .074 .231 .517
VAR00010 N 72 0 0 72 72
Minimum 1
Maximum 3
Mean 1.47 .00 .07 1.35 1.60
Std.
Deviation
.556 -.005 .037 .491 .627
VAR00011 N 72 0 0 72 72
Minimum 1
Maximum 3
Mean 1.75 .00 .06 1.63 1.86
Std.
Deviation
.524 -.005 .041 .436 .601
VAR00012 N 72 0 0 72 72
Minimum 1
Maximum 3
Mean 1.35 .00 .06 1.24 1.47
Std.
Deviation
.535 -.006 .049 .436 .625
VAR00013 N 72 0 0 72 72
Minimum 1
Maximum 2
Mean 1.50 .00 .06 1.38 1.61
Std.
Deviation
.504 -.004 .005 .488 .504
5
tabler-icon-diamond-filled.svg

Paraphrase This Document

Need a fresh take? Get an instant paraphrase of this document with our AI Paraphraser
Document Page
VAR00014 N 72 0 0 72 72
Minimum 1
Maximum 2
Mean 1.10 .00 .03 1.04 1.17
Std.
Deviation
.298 -.004 .048 .201 .375
VAR00015 N 72 0 0 72 72
Minimum 1
Maximum 2
Mean 1.35 .00 .06 1.24 1.46
Std.
Deviation
.479 -.003 .018 .428 .502
VAR00016 N 72 0 0 72 72
Minimum 1
Maximum 3
Mean 1.60 .00 .07 1.44 1.74
Std.
Deviation
.620 -.008 .044 .528 .705
VAR00017 N 72 0 0 72 72
Minimum 1
Maximum 2
Mean 1.25 .00 .05 1.15 1.35
Std.
Deviation
.436 -.005 .030 .362 .479
VAR00018 N 72 0 0 72 72
Minimum 0
Maximum 1
Mean .74 .00 .02 .71 .77
Std.
Deviation
.154 -.003 .021 .110 .193
VAR00019 N 72 0 0 72 72
Minimum 0
Maximum 1
Mean .72 .00 .02 .69 .76
Std.
Deviation
.159 -.001 .017 .122 .192
VAR00020 N 72 0 0 72 72
Minimum 0
Maximum 1
6
Document Page
Mean .78 .00 .02 .74 .82
Std.
Deviation
.195 -.003 .018 .155 .226
VAR00021 N 72 0 0 72 72
Minimum 0
Maximum 19
Mean 3.96 -.02 .52 2.92 5.01
Std.
Deviation
4.542 -.070 .475 3.536 5.415
VAR00022 N 72 0 0 72 72
Minimum 0
Maximum 9
Mean 2.96 .01 .28 2.43 3.51
Std.
Deviation
2.417 -.020 .167 2.071 2.731
VAR00023 N 72 0 0 72 72
Minimum 0
Maximum 17
Mean 3.01 -.02 .44 2.17 3.94
Std.
Deviation
3.785 -.064 .408 2.910 4.579
VAR00024 N 72 0 0 72 72
Minimum 0
Maximum 12
Mean 2.81 -.01 .28 2.25 3.37
Std.
Deviation
2.476 -.035 .310 1.769 3.057
VAR00025 N 72 0 0 72 72
Minimum 0
Maximum 19
Mean 2.88 -.02 .49 1.99 3.87
Std.
Deviation
4.114 -.098 .597 2.869 5.154
VAR00026 N 72 0 0 72 72
Minimum 0
Maximum 11
Mean 2.21 -.01 .26 1.72 2.75
Std.
Deviation
2.220 -.034 .309 1.601 2.827
7
Document Page
VAR00027 N 72 0 0 72 72
Minimum 0
Maximum 12
Mean 8.15 .02 .32 7.53 8.81
Std.
Deviation
2.797 -.042 .232 2.281 3.215
VAR00028 N 72 0 0 72 72
Minimum 1
Maximum 12
Mean 8.14 .01 .35 7.46 8.83
Std.
Deviation
3.064 -.027 .182 2.688 3.369
VAR00029 N 72 0 0 72 72
Minimum 1
Maximum 12
Mean 9.01 .02 .37 8.26 9.78
Std.
Deviation
3.217 -.039 .254 2.659 3.646
VAR00001 N 72 0 0 72 72
Minimum 63
Maximum 91
Mean 77.85 .02 .78 76.25 79.36
Std.
Deviation
6.769 -.083 .462 5.772 7.574
Valid N (listwise) N 72 0 0 72 72
a. Unless otherwise noted, bootstrap results are based on 1000 bootstrap samples
8
chevron_up_icon
1 out of 10
circle_padding
hide_on_mobile
zoom_out_icon
[object Object]