Quantitative Research Methods: Data Analysis and Interpretation
VerifiedAdded on  2020/06/05
|29
|1669
|137
Report
AI Summary
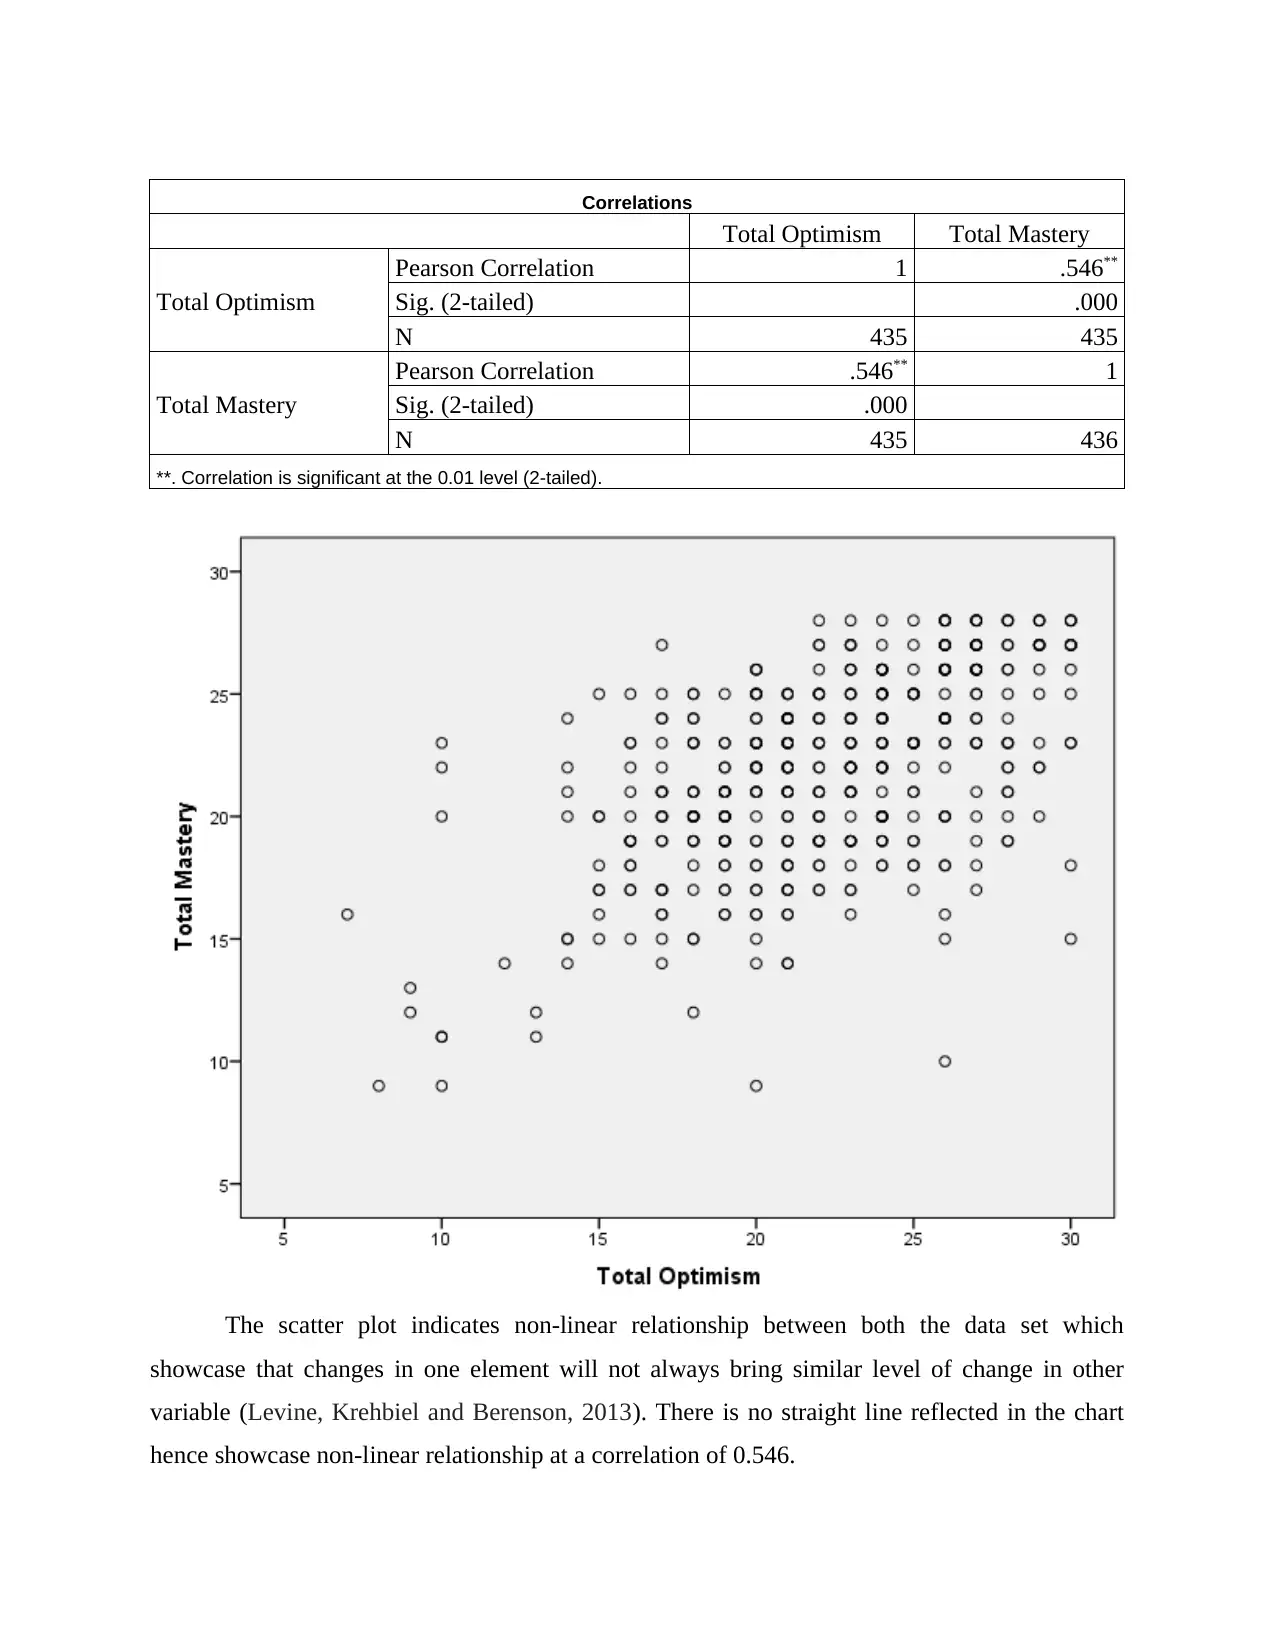
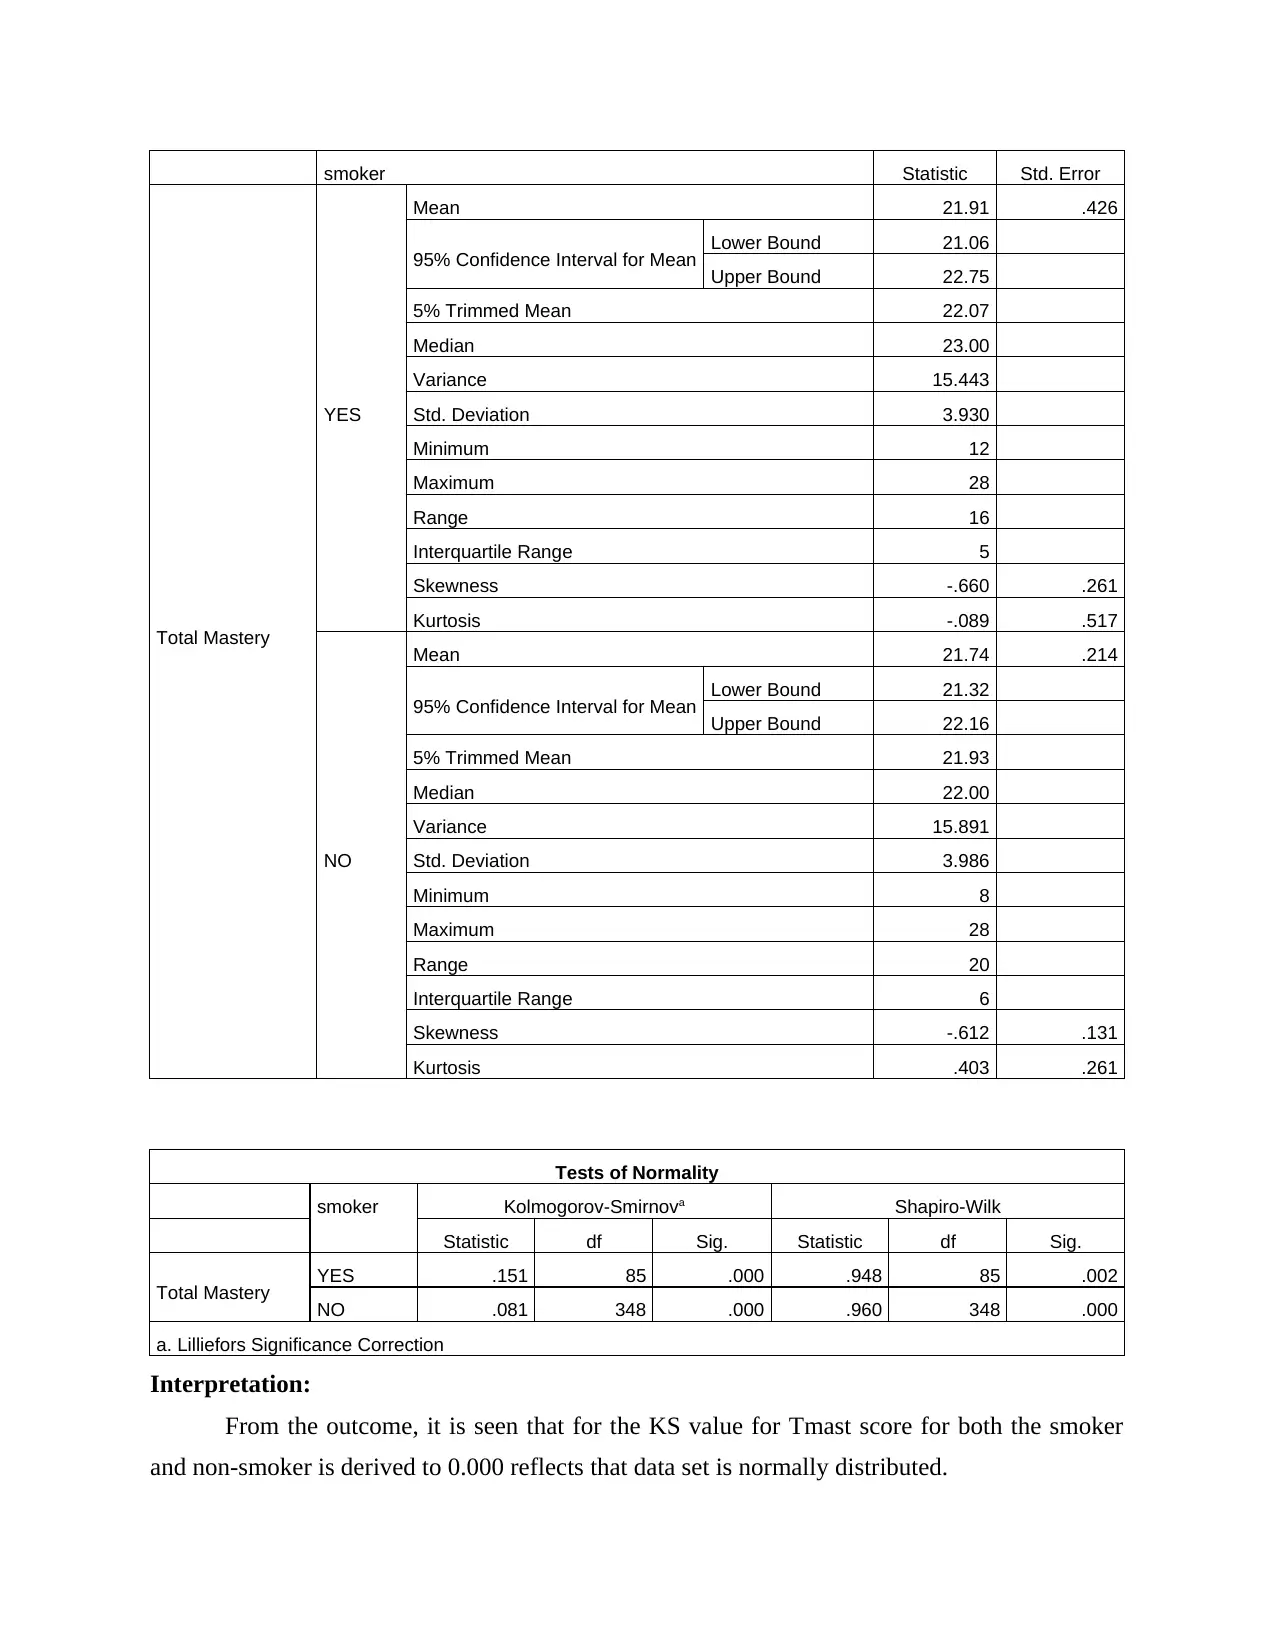
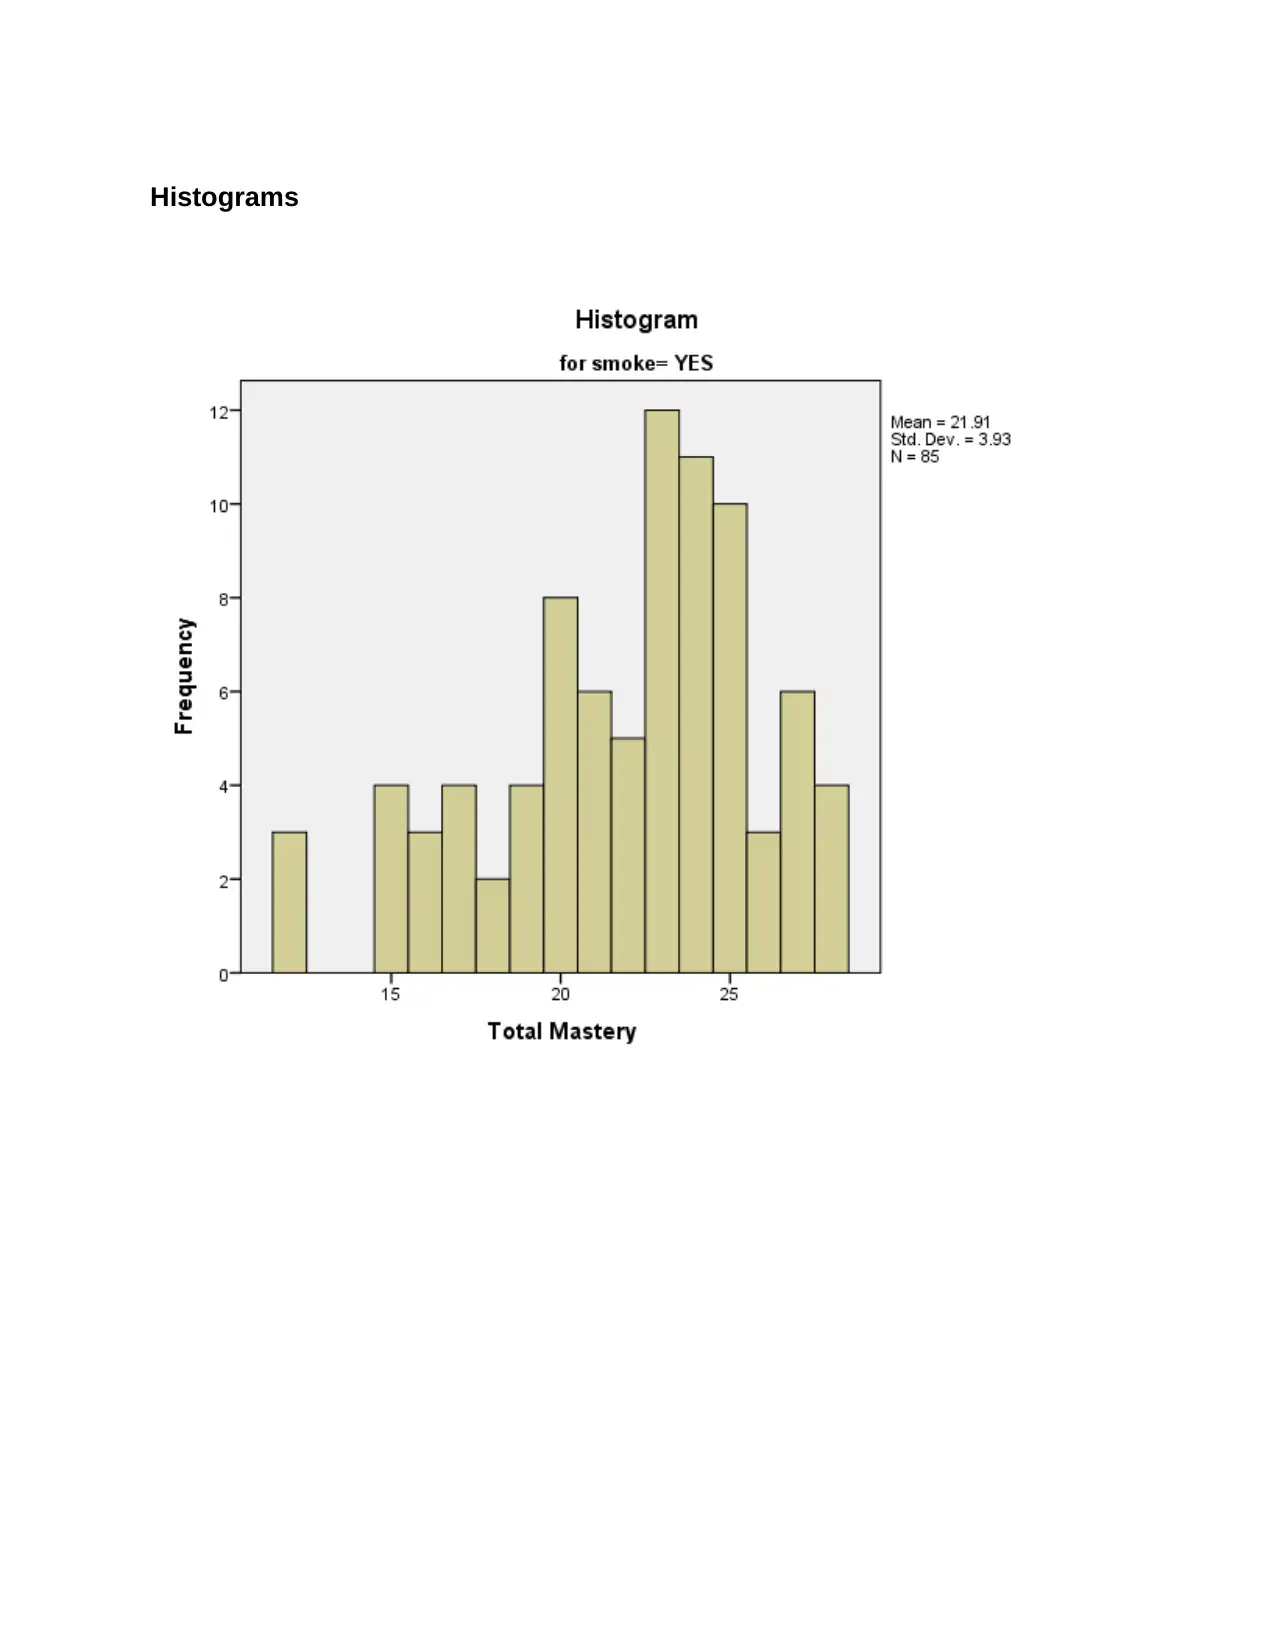
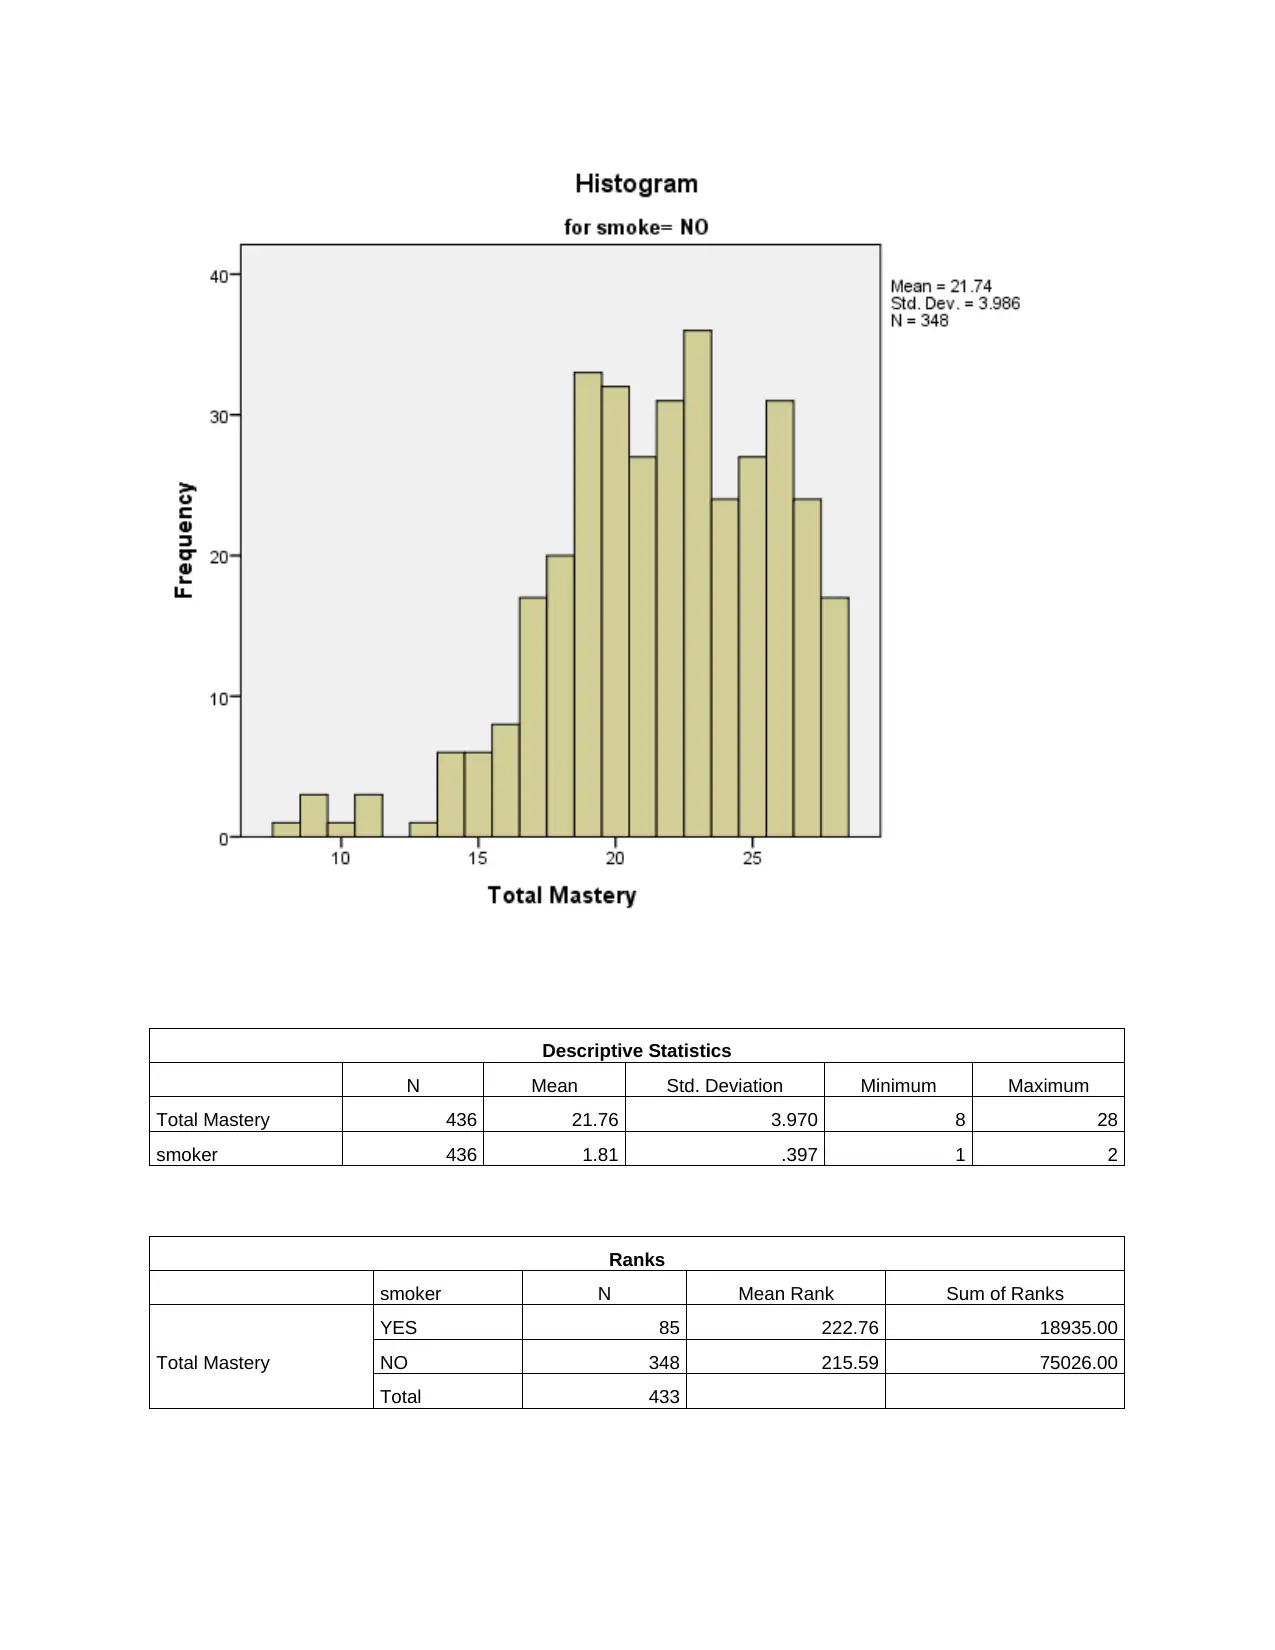
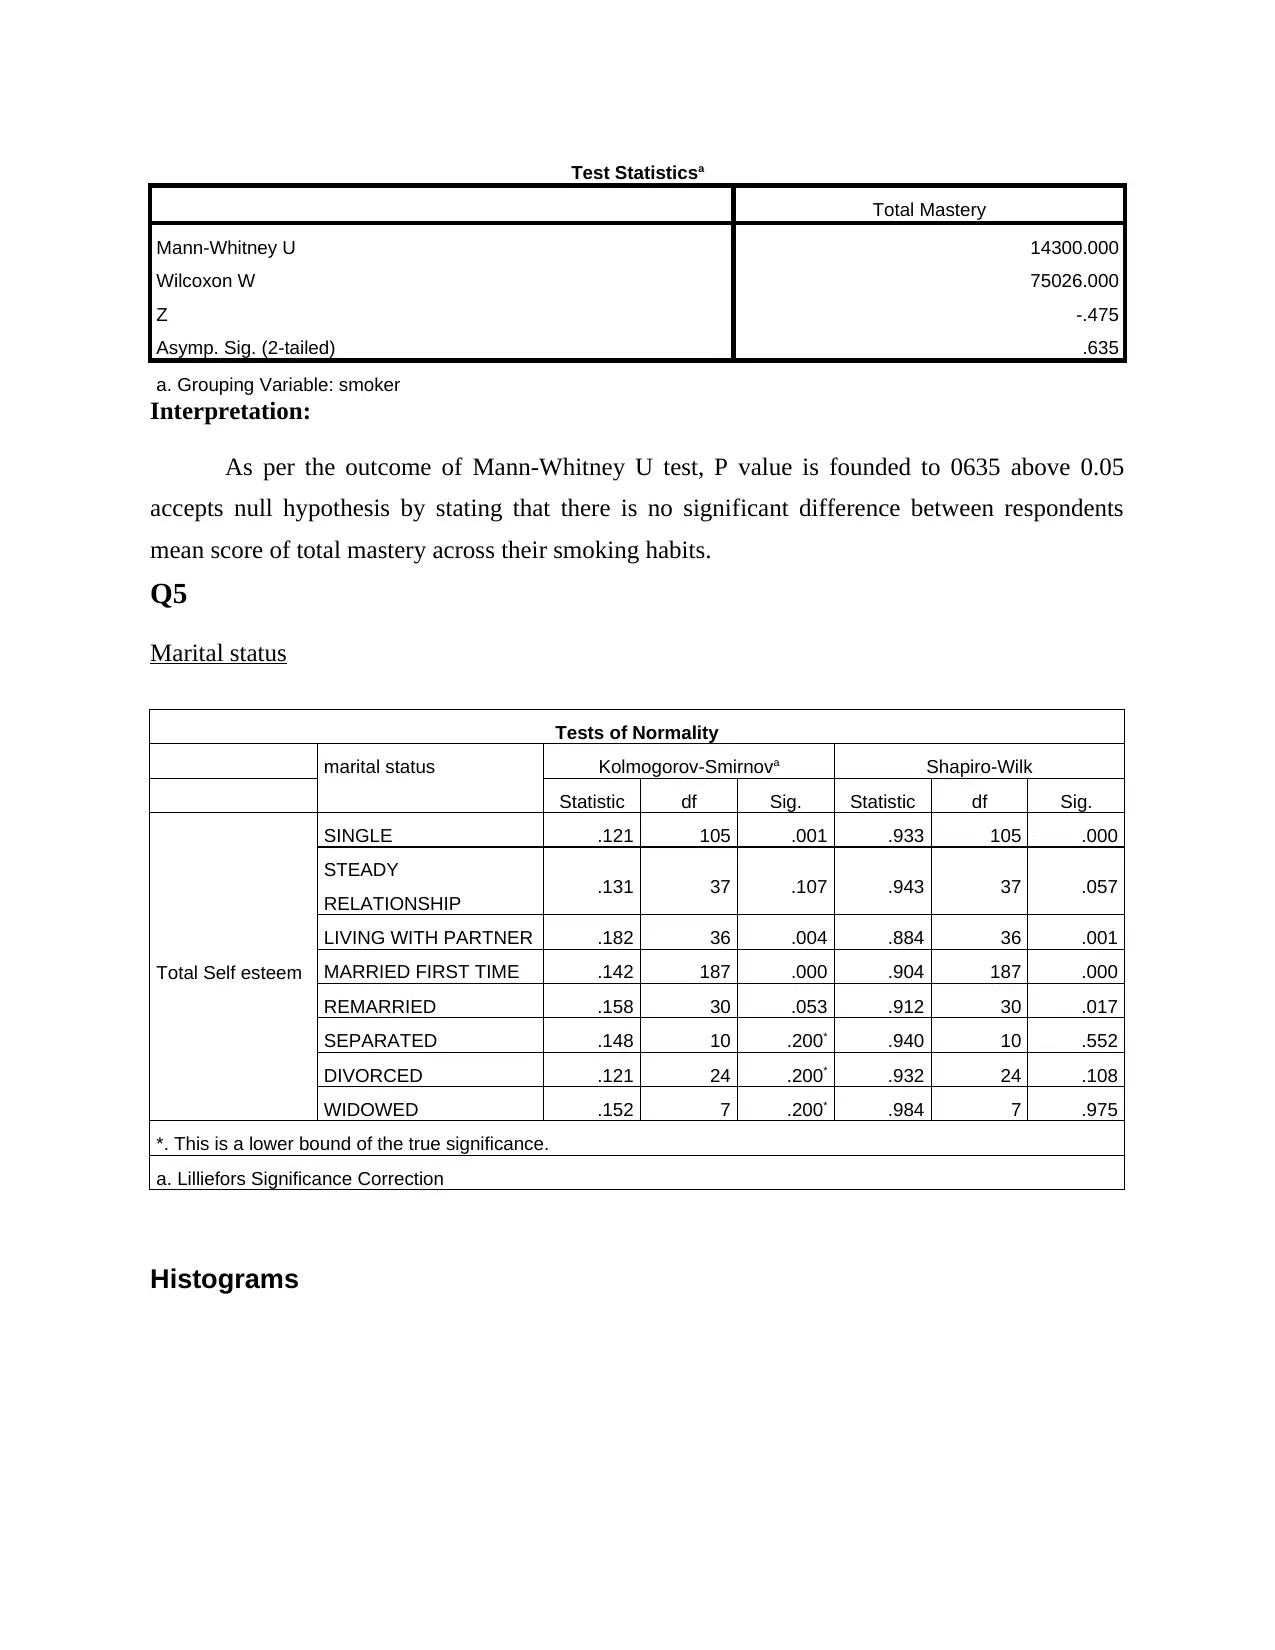
This report presents a comprehensive analysis of quantitative research methods, focusing on statistical analysis and data interpretation. The report begins with an examination of reliability statistics using Cronbach's alpha, assessing the internal consistency of a PANAS scale. It then explores the relationship between total optimism and total mastery using scatter plots and correlation analysis. The report investigates the impact of gender and smoking habits on total mastery through normality tests and Mann-Whitney U tests. Furthermore, the report examines the influence of marital status and educational attainment on self-esteem, employing Mann-Whitney U tests. The findings include interpretations of statistical outcomes, such as p-values and significance levels, providing insights into the relationships between variables and their statistical significance. The report concludes with a list of relevant references.
Contribute Materials
Your contribution can guide someone’s learning journey. Share your
documents today.

QUANTITATIVE RESEARCH METHODS
Secure Best Marks with AI Grader
Need help grading? Try our AI Grader for instant feedback on your assignments.

Table of Contents
Q1...................................................................................................................................................................3
Reliability statistics table...........................................................................................................................3
Q2...................................................................................................................................................................3
Relationship between total optimism and Total Mastery..........................................................................3
Q4...................................................................................................................................................................5
Gender and total mastery...........................................................................................................................5
Smoker.......................................................................................................................................................8
Q5.................................................................................................................................................................12
Marital status............................................................................................................................................12
High education limit................................................................................................................................21
REFERENCES............................................................................................................................................29

Q1
Reliability statistics table
Reliability presents the consistency in measurments and a statistical measures is only
called reliable if the produced results are consistenly similar.
Reliability Statistics
Cronbach's Alpha Cronbach's Alpha Based on
Standardized Items
N of Items
.736 .735 20
As per the results, it can be seen that Cronbach;s Alpha coefficient is derived to 0.736
which indicates good level of internal consistency for the PANAS scale. Cronbach’s alpha (α)
provides overall reliability measure for a given set of variables which is 0.735 reflects that data
set obtained from the questionnaire is reliable (Jaggia and et.al., 2016).
Maximizing scale reliability score by deleting an item
According to the statistical output gained in Item-Total Statistics, it is identified that there
is none of the question or item which removal will increase the Cronbach’s alpha score from the
current level of 0.736. From the output, it is observed that deleting any question except only 7
will result in lower α score. However, although removal of question 7 will not lead to improve
the alpha score, still, there will be no change and it remains constant to the current score of
0.736. It is because, the correlated item-total correlation value is reported very low to 0.177 only.
Thus, it becomes clear that none of the item’s removal will help to improve the reliability score
therefore, all these (pn1 to pn20) should be retained and no deletion must be considered as there
is no variables exists in the data series whose removal will bring upward change in the
Cronbach’s alpha (Freed, Bergquist and Jones, 2014).
Q2
Relationship between total optimism and Total Mastery
Scatter plot is a graph that presents relation between two variables whether linear or non-
linear. Here, correlation is also founded to determine the level & strength of relationship between
total mastery and total optimism variables.

Correlations
Total Optimism Total Mastery
Total Optimism
Pearson Correlation 1 .546**
Sig. (2-tailed) .000
N 435 435
Total Mastery
Pearson Correlation .546** 1
Sig. (2-tailed) .000
N 435 436
**. Correlation is significant at the 0.01 level (2-tailed).
The scatter plot indicates non-linear relationship between both the data set which
showcase that changes in one element will not always bring similar level of change in other
variable (Levine, Krehbiel and Berenson, 2013). There is no straight line reflected in the chart
hence showcase non-linear relationship at a correlation of 0.546.
Secure Best Marks with AI Grader
Need help grading? Try our AI Grader for instant feedback on your assignments.

Q4
Gender and total mastery
Normality test
Case Processing Summary
sex Cases
Valid Missing Total
N Percent N Percent N Percent
Total Mastery MALES 184 99.5% 1 0.5% 185 100.0%
FEMALES 249 98.0% 5 2.0% 254 100.0%
Descriptives
sex Statistic Std. Error
Total Mastery
MALES
Mean 22.33 .262
95% Confidence Interval for
Mean
Lower Bound 21.82
Upper Bound 22.85
5% Trimmed Mean 22.47
Median 23.00
Variance 12.594
Std. Deviation 3.549
Minimum 8
Maximum 28
Range 20
Interquartile Range 5
Skewness -.623 .179
Kurtosis .506 .356
FEMALES Mean 21.37 .267
95% Confidence Interval for
Mean
Lower Bound 20.84
Upper Bound 21.89
5% Trimmed Mean 21.56
Median 22.00
Variance 17.781
Std. Deviation 4.217
Minimum 9
Maximum 28
Range 19
Interquartile Range 6

Skewness -.545 .154
Kurtosis .072 .307
Tests of Normality
sex Kolmogorov-Smirnova Shapiro-Wilk
Statistic df Sig. Statistic df Sig.
Total Mastery MALES .099 184 .000 .962 184 .000
FEMALES .097 249 .000 .964 249 .000
a. Lilliefors Significance Correction
Interpretation
Normality test results under K-S test for Tmast for males and females are derived to
0.000 which is below the set statistics of 0.05 therefore, it can be interpreted that data set is not
normally distributed (Anderson, Sweeney and Williams, 2014).
Mann Whitney test
Descriptive Statistics
N Mean Std. Deviation Minimum Maximum
Total Mastery 436 21.76 3.970 8 28
sex 439 1.58 .494 1 2
Ranks
sex N Mean Rank Sum of Ranks
Total Mastery
MALES 185 233.55 43206.00
FEMALES 251 207.41 52060.00
Total 436
Test Statisticsa
Total Mastery
Mann-Whitney U 20434.000
Wilcoxon W 52060.000
Z -2.147
Asymp. Sig. (2-tailed) .032
a. Grouping Variable: sex

Paraphrase This Document
Need a fresh take? Get an instant paraphrase of this document with our AI Paraphraser

Interpretation:
Looking to the outcome of Mann-Whitney U test, P value is derived to 0.032 below 0.05
accepts alternative hypothesis by stating that there is significant difference between respondents
mean score of total mastery across their genders.
Smoker
Case Processing Summary
smoker Cases
Valid Missing Total
N Percent N Percent N Percent
Total Mastery YES 85 100.0% 0 0.0% 85 100.0%
NO 348 99.1% 3 0.9% 351 100.0%
Descriptives

smoker Statistic Std. Error
Total Mastery
YES
Mean 21.91 .426
95% Confidence Interval for Mean Lower Bound 21.06
Upper Bound 22.75
5% Trimmed Mean 22.07
Median 23.00
Variance 15.443
Std. Deviation 3.930
Minimum 12
Maximum 28
Range 16
Interquartile Range 5
Skewness -.660 .261
Kurtosis -.089 .517
NO
Mean 21.74 .214
95% Confidence Interval for Mean Lower Bound 21.32
Upper Bound 22.16
5% Trimmed Mean 21.93
Median 22.00
Variance 15.891
Std. Deviation 3.986
Minimum 8
Maximum 28
Range 20
Interquartile Range 6
Skewness -.612 .131
Kurtosis .403 .261
Tests of Normality
smoker Kolmogorov-Smirnova Shapiro-Wilk
Statistic df Sig. Statistic df Sig.
Total Mastery YES .151 85 .000 .948 85 .002
NO .081 348 .000 .960 348 .000
a. Lilliefors Significance Correction
Interpretation:
From the outcome, it is seen that for the KS value for Tmast score for both the smoker
and non-smoker is derived to 0.000 reflects that data set is normally distributed.

Histograms
Secure Best Marks with AI Grader
Need help grading? Try our AI Grader for instant feedback on your assignments.

Descriptive Statistics
N Mean Std. Deviation Minimum Maximum
Total Mastery 436 21.76 3.970 8 28
smoker 436 1.81 .397 1 2
Ranks
smoker N Mean Rank Sum of Ranks
Total Mastery
YES 85 222.76 18935.00
NO 348 215.59 75026.00
Total 433
N Mean Std. Deviation Minimum Maximum
Total Mastery 436 21.76 3.970 8 28
smoker 436 1.81 .397 1 2
Ranks
smoker N Mean Rank Sum of Ranks
Total Mastery
YES 85 222.76 18935.00
NO 348 215.59 75026.00
Total 433

Test Statisticsa
Total Mastery
Mann-Whitney U 14300.000
Wilcoxon W 75026.000
Z -.475
Asymp. Sig. (2-tailed) .635
a. Grouping Variable: smoker
Interpretation:
As per the outcome of Mann-Whitney U test, P value is founded to 0635 above 0.05
accepts null hypothesis by stating that there is no significant difference between respondents
mean score of total mastery across their smoking habits.
Q5
Marital status
Tests of Normality
marital status Kolmogorov-Smirnova Shapiro-Wilk
Statistic df Sig. Statistic df Sig.
Total Self esteem
SINGLE .121 105 .001 .933 105 .000
STEADY
RELATIONSHIP .131 37 .107 .943 37 .057
LIVING WITH PARTNER .182 36 .004 .884 36 .001
MARRIED FIRST TIME .142 187 .000 .904 187 .000
REMARRIED .158 30 .053 .912 30 .017
SEPARATED .148 10 .200* .940 10 .552
DIVORCED .121 24 .200* .932 24 .108
WIDOWED .152 7 .200* .984 7 .975
*. This is a lower bound of the true significance.
a. Lilliefors Significance Correction
Histograms

Paraphrase This Document
Need a fresh take? Get an instant paraphrase of this document with our AI Paraphraser


Secure Best Marks with AI Grader
Need help grading? Try our AI Grader for instant feedback on your assignments.


Paraphrase This Document
Need a fresh take? Get an instant paraphrase of this document with our AI Paraphraser

Mann Whitney test
Descriptive Statistics
N Mean Std. Deviation Minimum Maximum
Total Self esteem 436 33.53 5.395 18 40
marital status 439 3.37 1.759 1 8
Ranks
marital status N Mean Rank Sum of Ranks
Total Self esteem
SINGLE 105 72.36 7597.50
STEADY RELATIONSHIP 37 69.07 2555.50
Total 142
Test Statisticsa
Descriptive Statistics
N Mean Std. Deviation Minimum Maximum
Total Self esteem 436 33.53 5.395 18 40
marital status 439 3.37 1.759 1 8
Ranks
marital status N Mean Rank Sum of Ranks
Total Self esteem
SINGLE 105 72.36 7597.50
STEADY RELATIONSHIP 37 69.07 2555.50
Total 142
Test Statisticsa

Total Self esteem
Mann-Whitney U 1852.500
Wilcoxon W 2555.500
Z -.419
Asymp. Sig. (2-tailed) .675
a. Grouping Variable: marital status
Interpretations:
Finding the output, sig value is derived to 0.675 that is above set statistical level of 0.05
presents no significant difference in the mean score of the total self-esteem across their marital
status (Lee and Peters, 2015).
High education limit
Tests of Normality
highest educ completed Kolmogorov-Smirnova Shapiro-Wilk
Statistic df Sig. Statistic df Sig.
Total Self esteem
PRIMARY .260 2 .
SOME SECONDARY .146 52 .007 .911 52 .001
COMPLETED HIGHSCHOOL .142 85 .000 .923 85 .000
SOME ADDITIONAL
TRAINING .138 118 .000 .909 118 .000
COMPLETED
UNDERGRADUATE .140 123 .000 .912 123 .000
POSTGRADUATE
COMPLETED .177 56 .000 .915 56 .001
a. Lilliefors Significance Correction
Histograms

Secure Best Marks with AI Grader
Need help grading? Try our AI Grader for instant feedback on your assignments.


Paraphrase This Document
Need a fresh take? Get an instant paraphrase of this document with our AI Paraphraser


Descriptive Statistics
N Mean Std. Deviation Minimum Maximum
Total Self esteem 436 33.53 5.395 18 40
highest educ completed 439 4.09 1.226 1 6
Ranks
highest educ completed N Mean Rank Sum of Ranks
Total Self esteem
PRIMARY 2 32.25 64.50
SOME SECONDARY 52 27.32 1420.50
Total 54
N Mean Std. Deviation Minimum Maximum
Total Self esteem 436 33.53 5.395 18 40
highest educ completed 439 4.09 1.226 1 6
Ranks
highest educ completed N Mean Rank Sum of Ranks
Total Self esteem
PRIMARY 2 32.25 64.50
SOME SECONDARY 52 27.32 1420.50
Total 54

Test Statisticsa
Total Self esteem
Mann-Whitney U 42.500
Wilcoxon W 1420.500
Z -.437
Asymp. Sig. (2-tailed) .662
Exact Sig. [2*(1-tailed Sig.)] .676b
a. Grouping Variable: highest educ completed
b. Not corrected for ties.
Interpretation:
P value is computed to 0.676 > 0.05 represents no statistical significant difference in the
mean score of the people across their highest educational qualiifcations.
Secure Best Marks with AI Grader
Need help grading? Try our AI Grader for instant feedback on your assignments.

REFERENCES
Books and Journals
Anderson, D.R., Sweeney, D.J. and Williams, T.A., 2014. Modern business statistics with
Microsoft Excel. Nelson Education.
Freed, N., Bergquist, T. and Jones, S., 2014. Understanding business statistics. John Wiley &
Sons.
Jaggia, S. and et.al., 2016. Essentials of business statistics: communicating with numbers.John
Wiley & Sons.
Lee, N. and Peters, M., 2015. Business Statistics Using EXCEL and SPSS. Sage.
Levine, D.M., Krehbiel, T.C. and Berenson, M.L., 2013. Business Statistics: International
Edition. Pearson Higher Ed.
1 out of 29
Related Documents

Your All-in-One AI-Powered Toolkit for Academic Success.
 +13062052269
info@desklib.com
Available 24*7 on WhatsApp / Email
Unlock your academic potential
© 2024  |  Zucol Services PVT LTD  |  All rights reserved.