Quantitative Approaches for Business: Social Media Usage Analysis
VerifiedAdded on 2020/05/16
|15
|2370
|79
Project
AI Summary
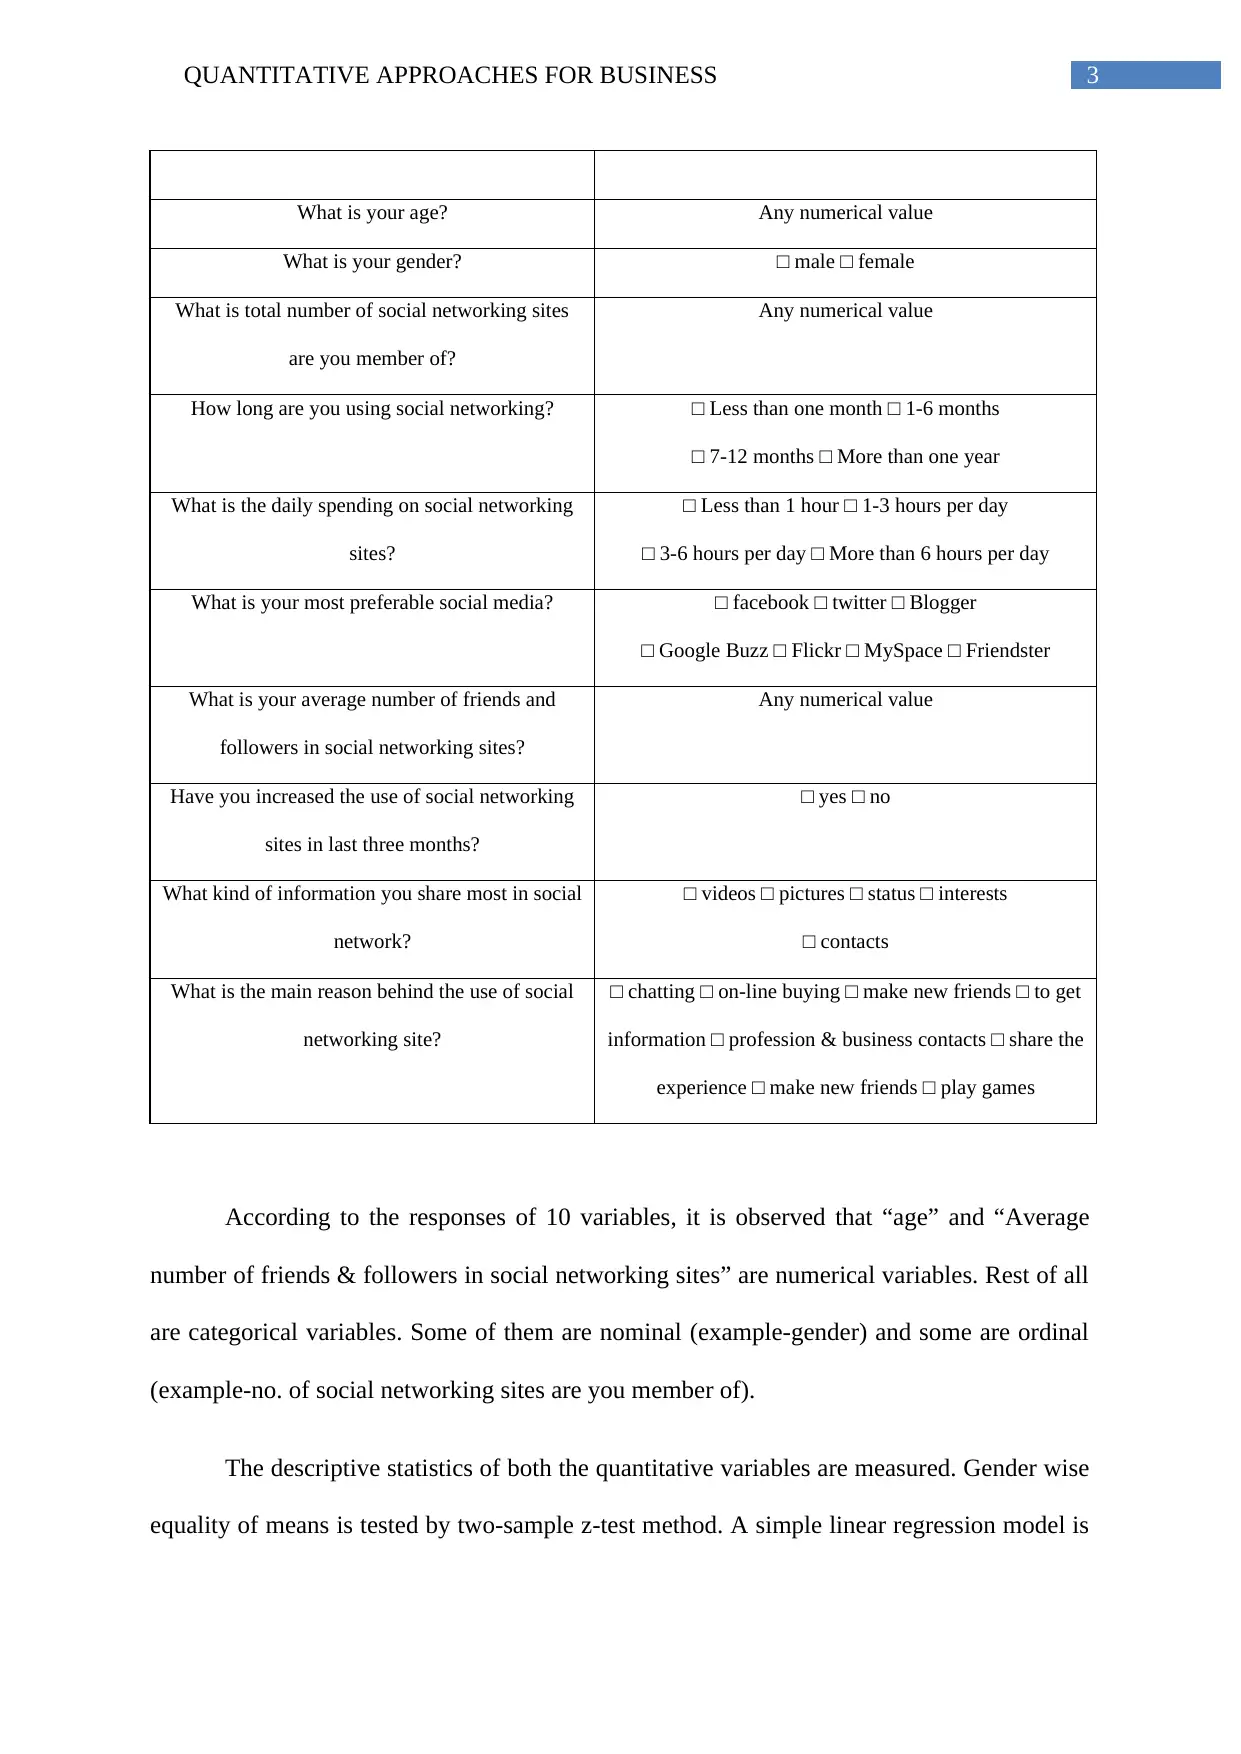
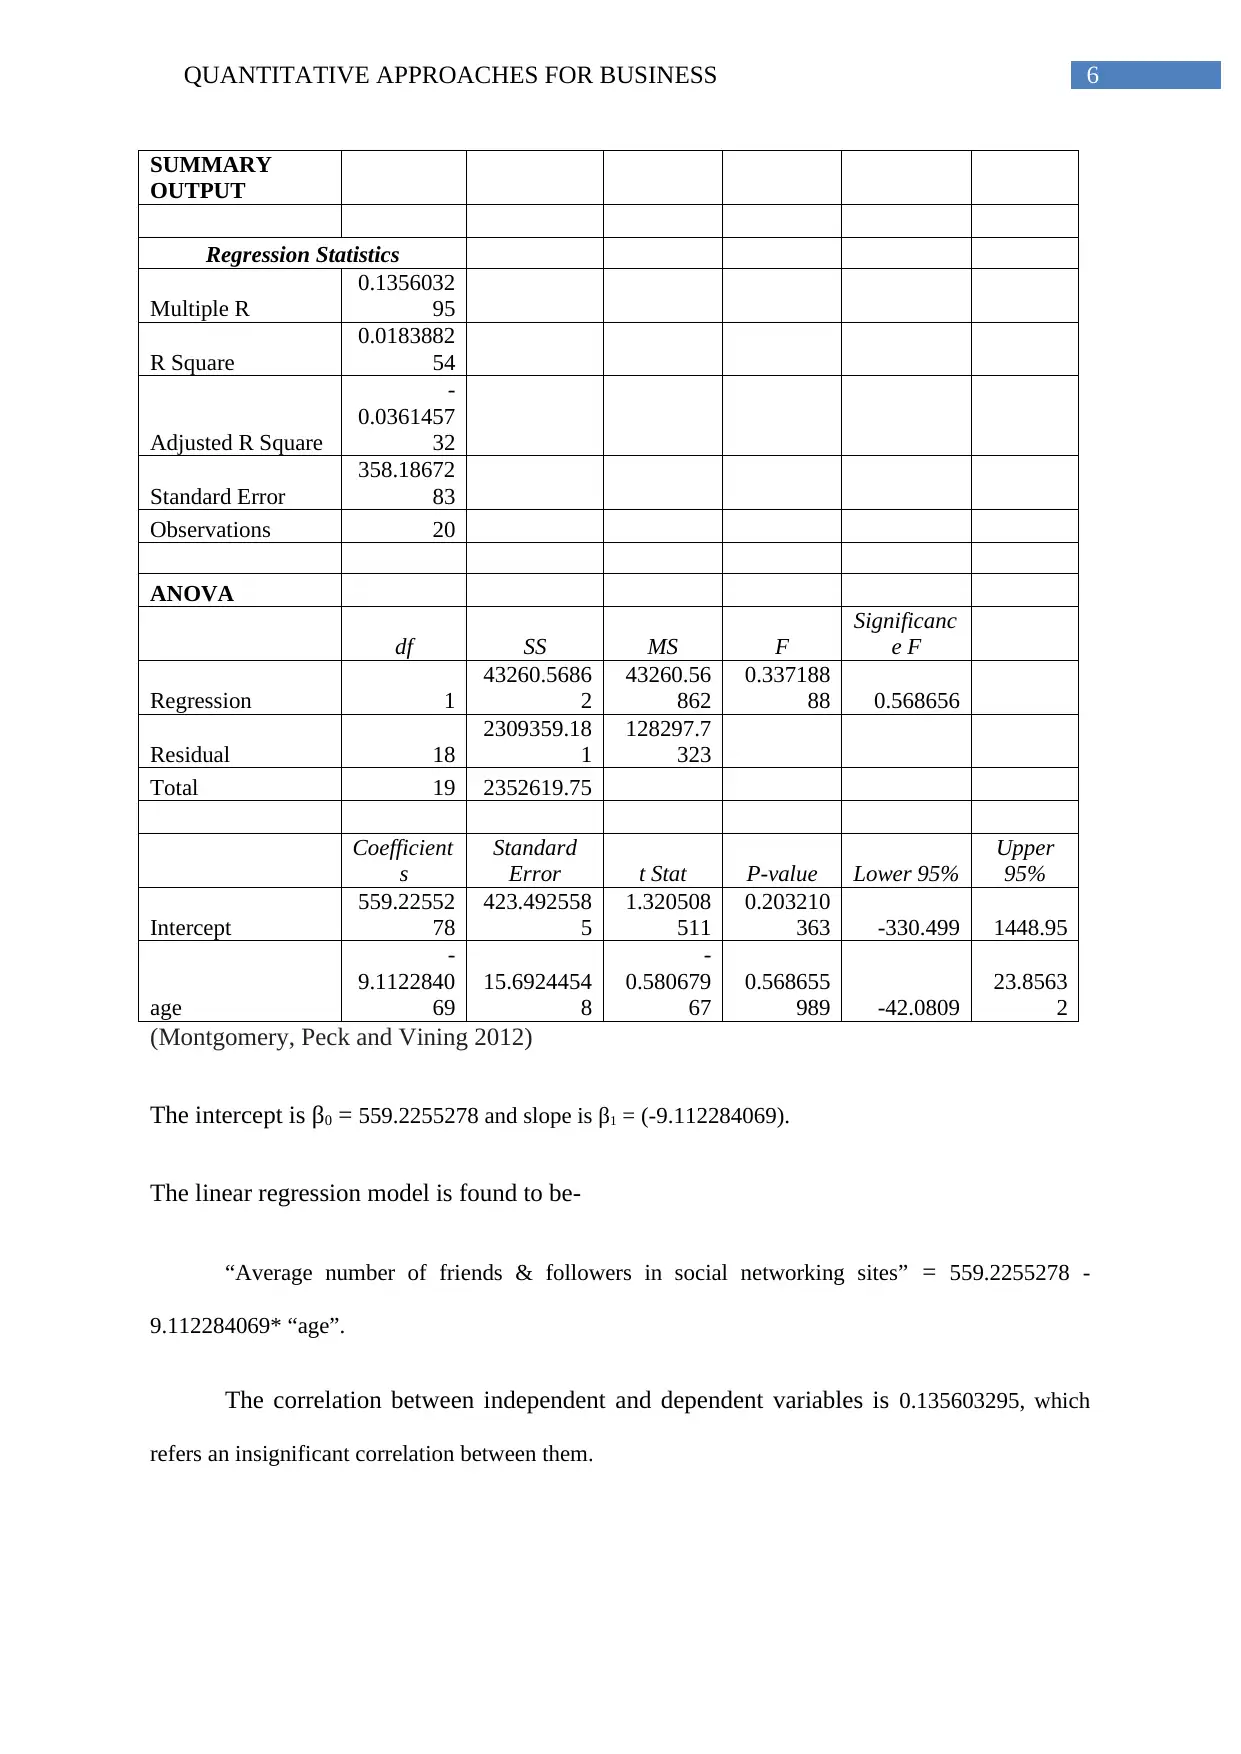
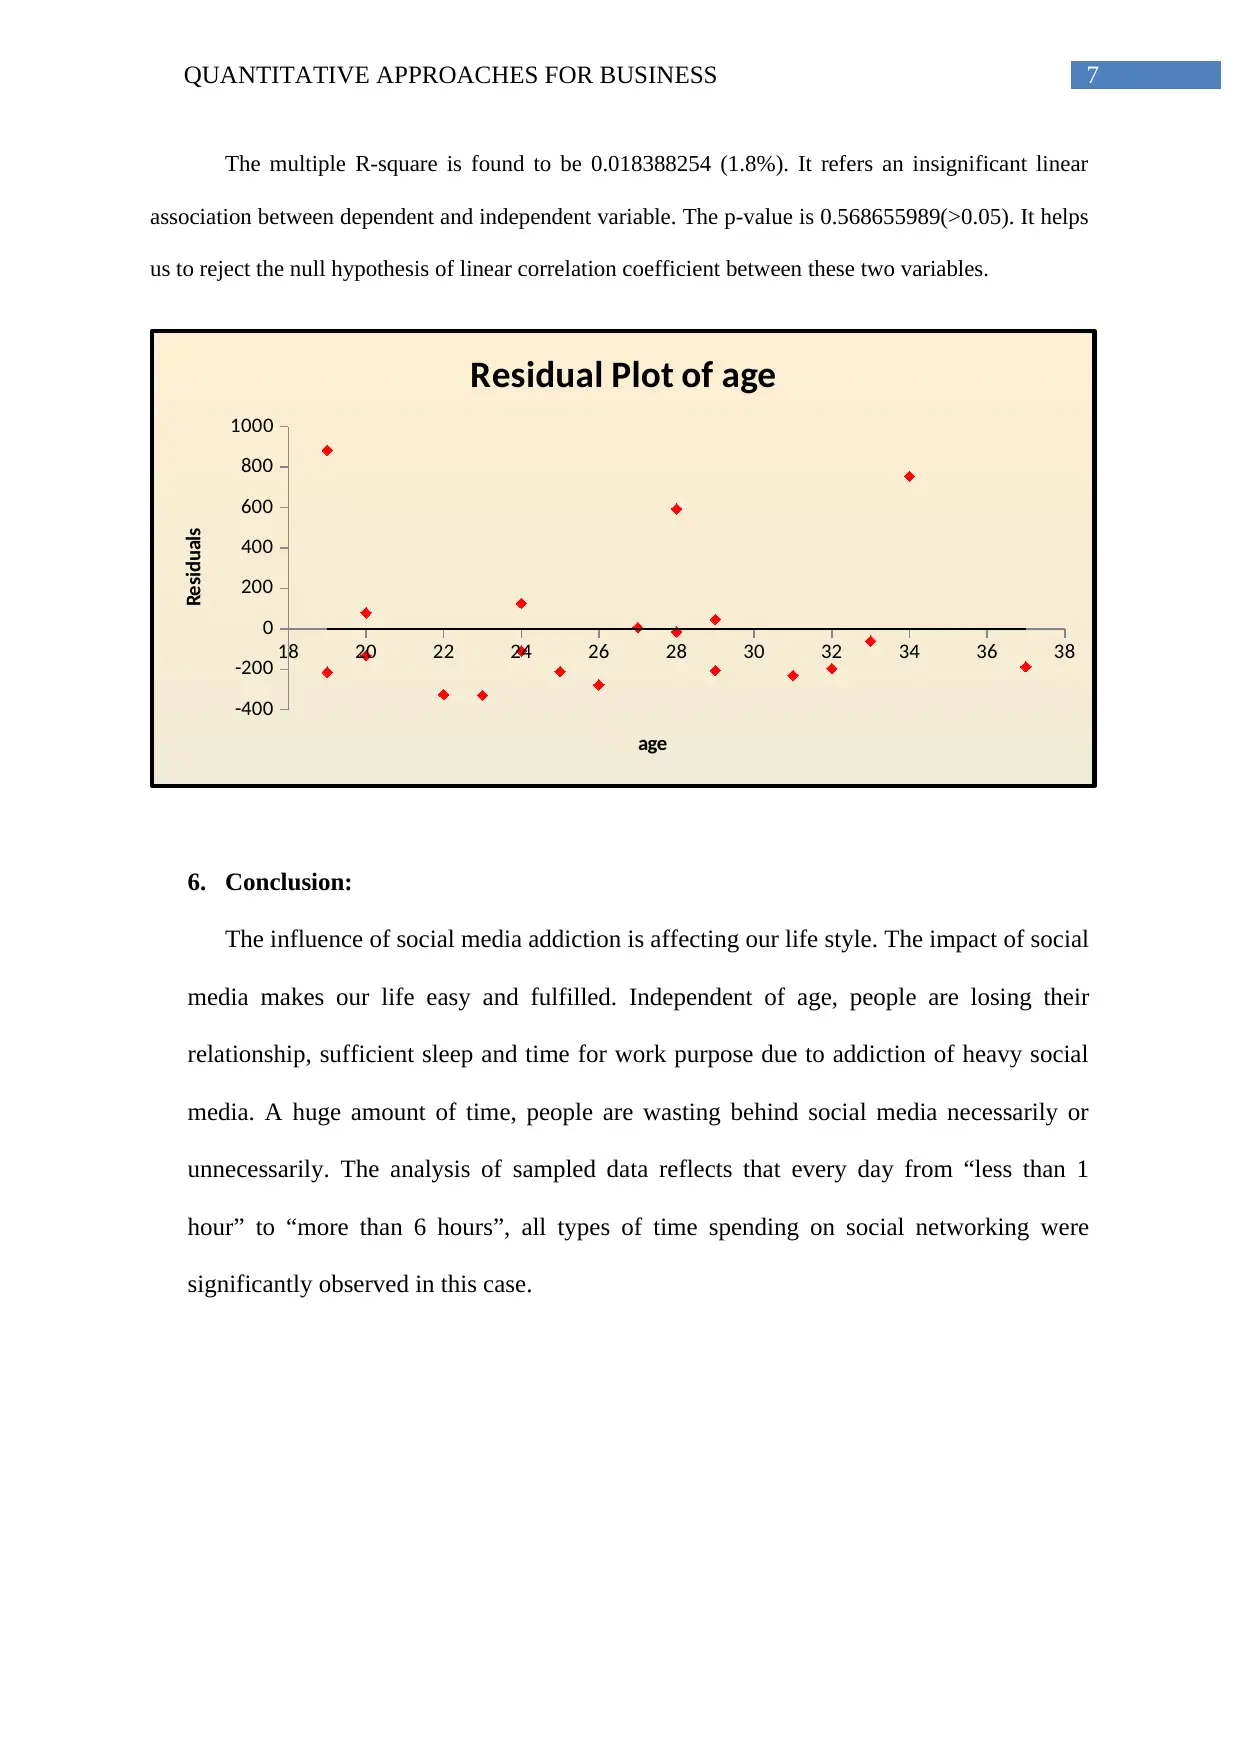
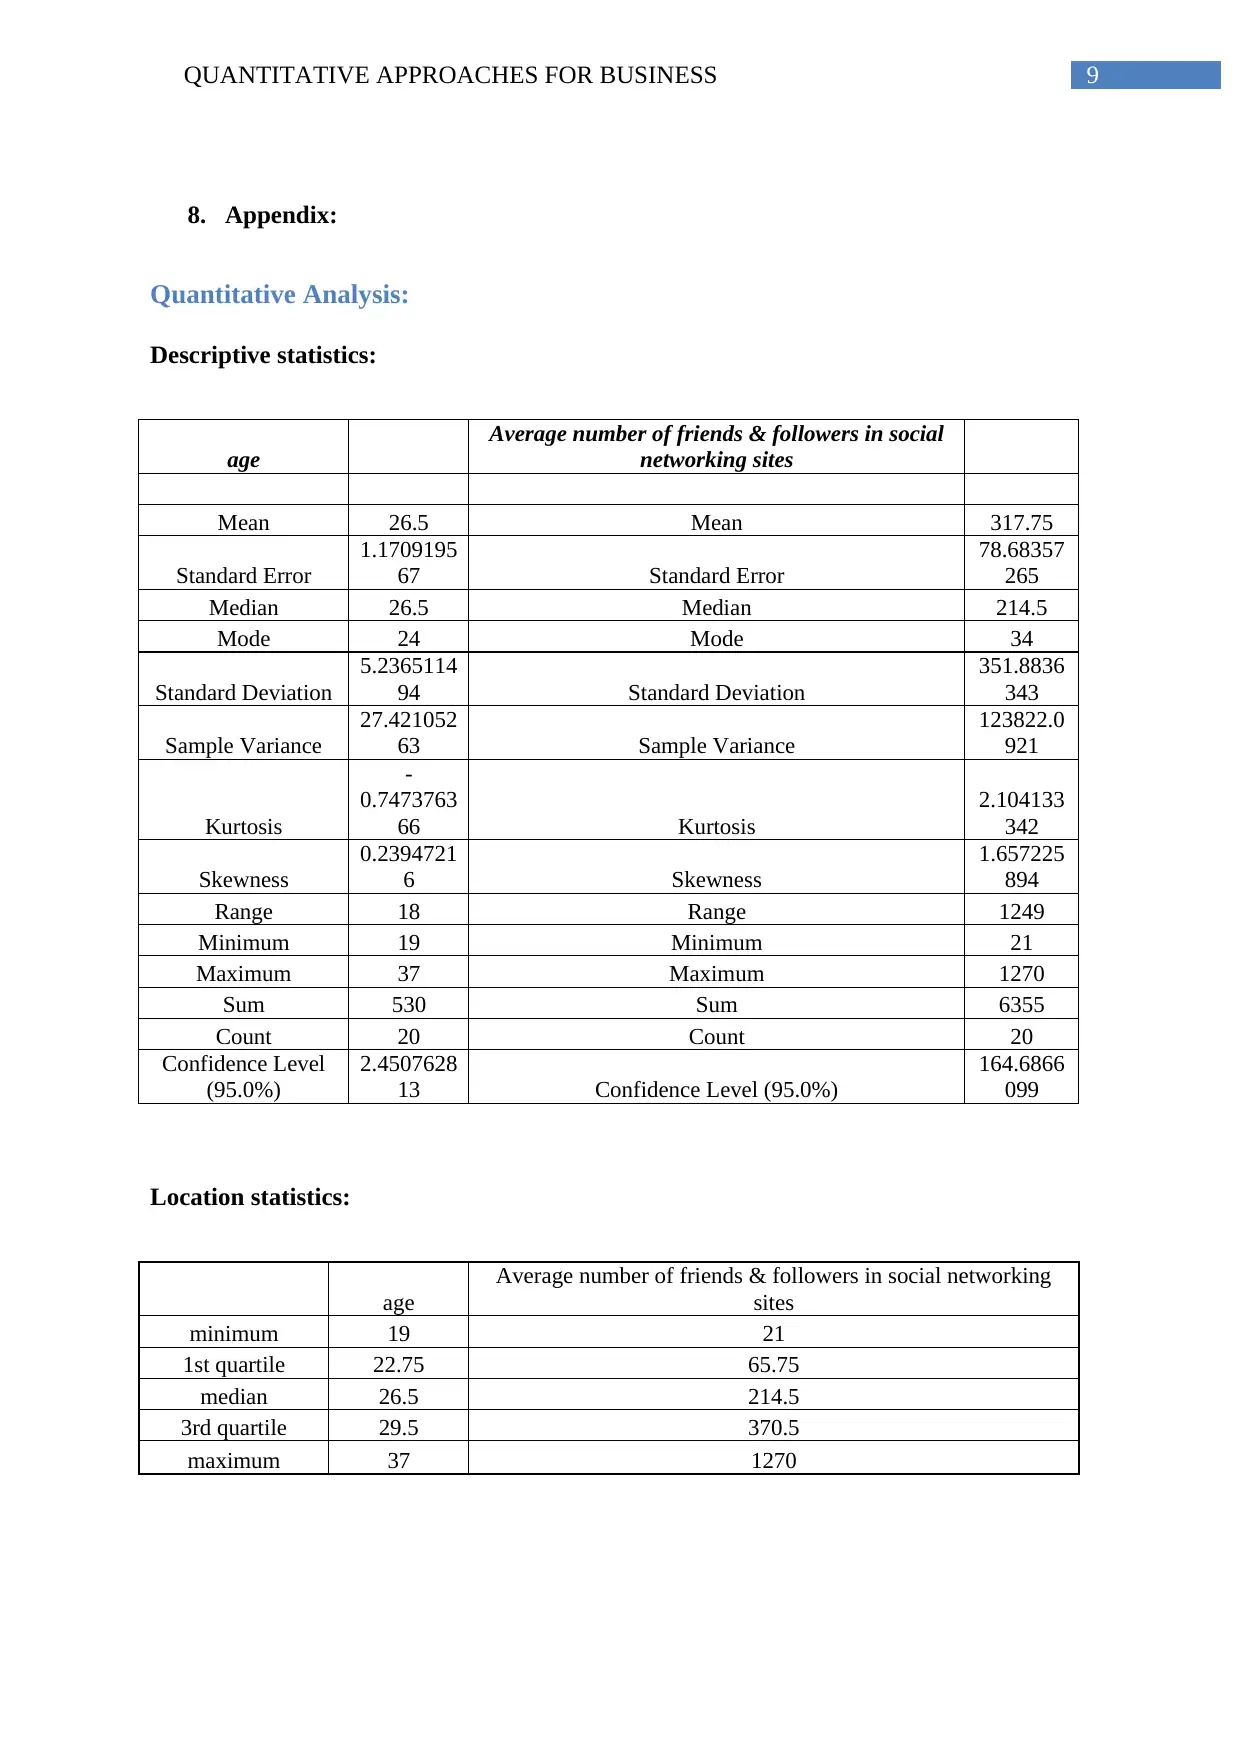
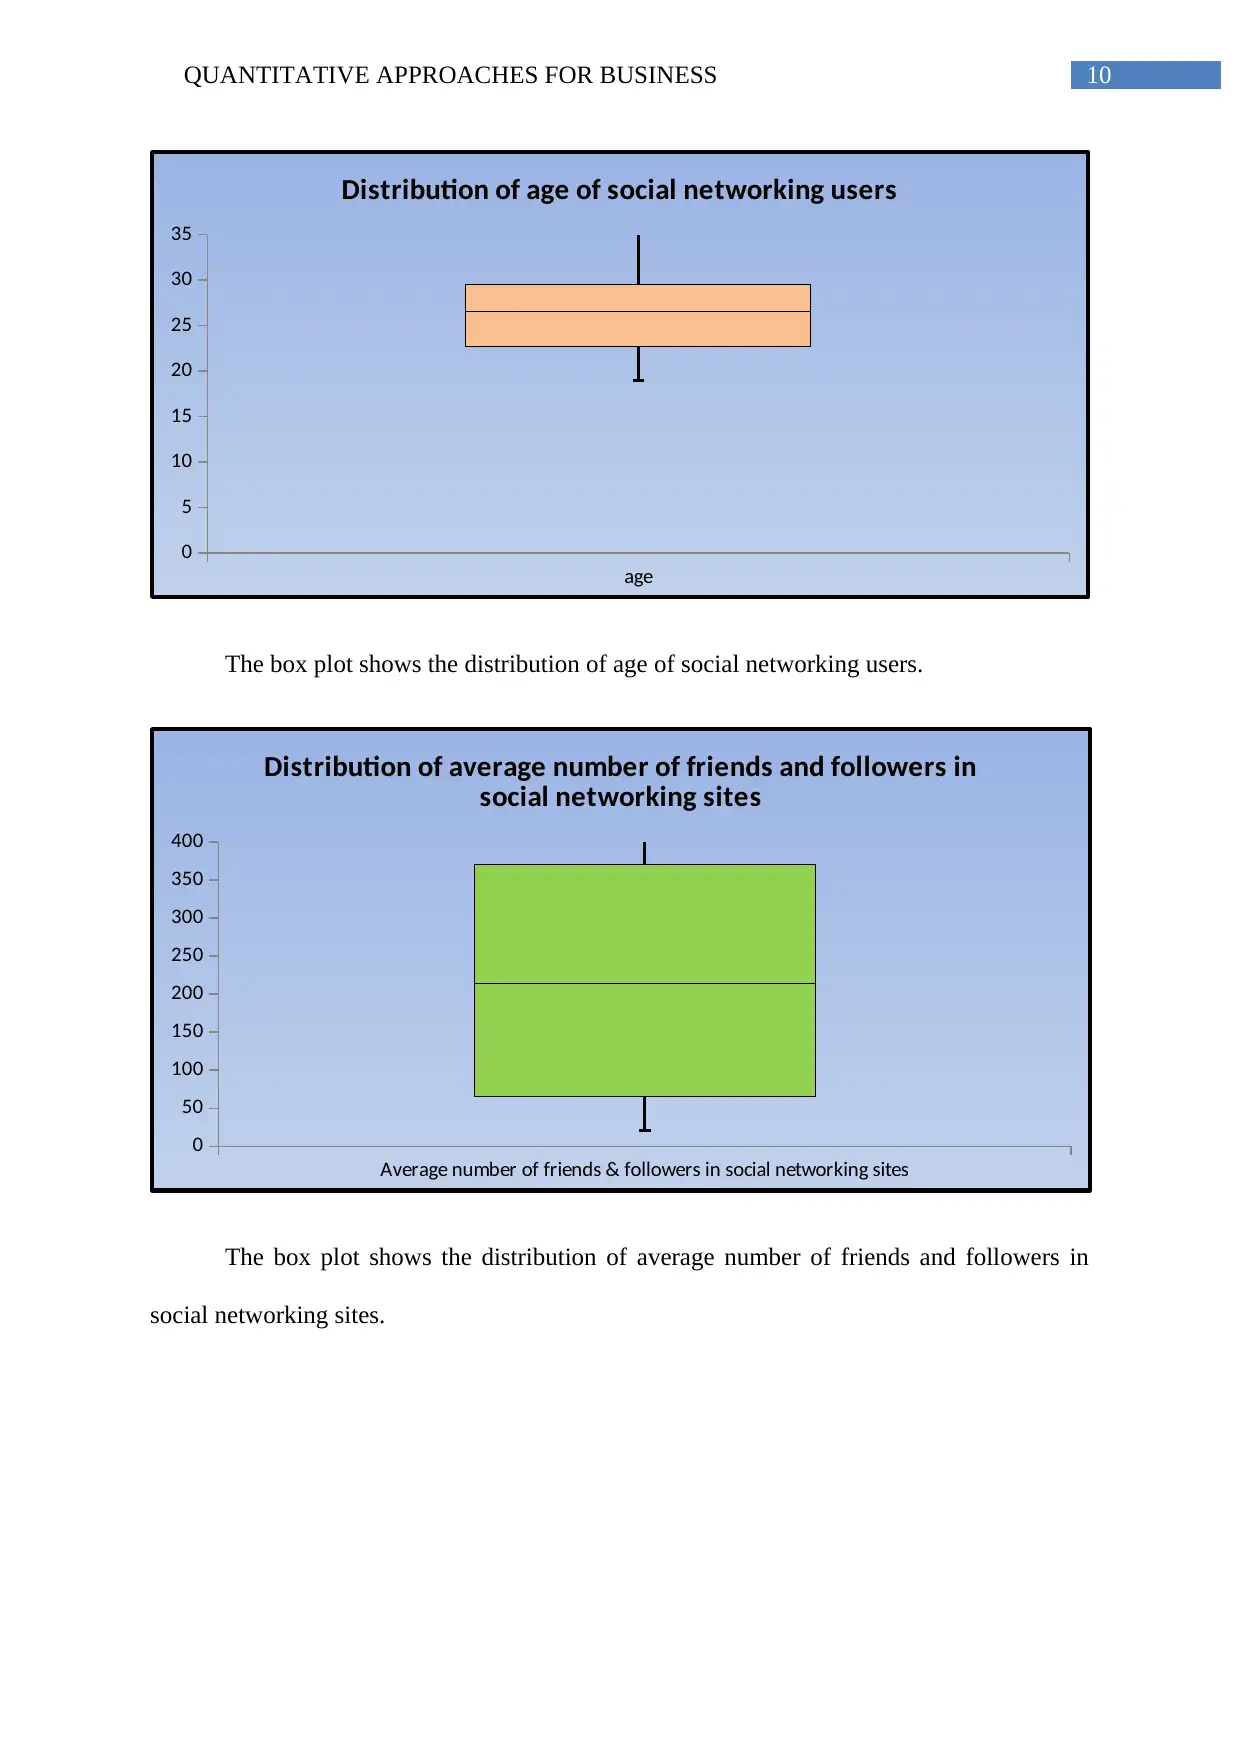
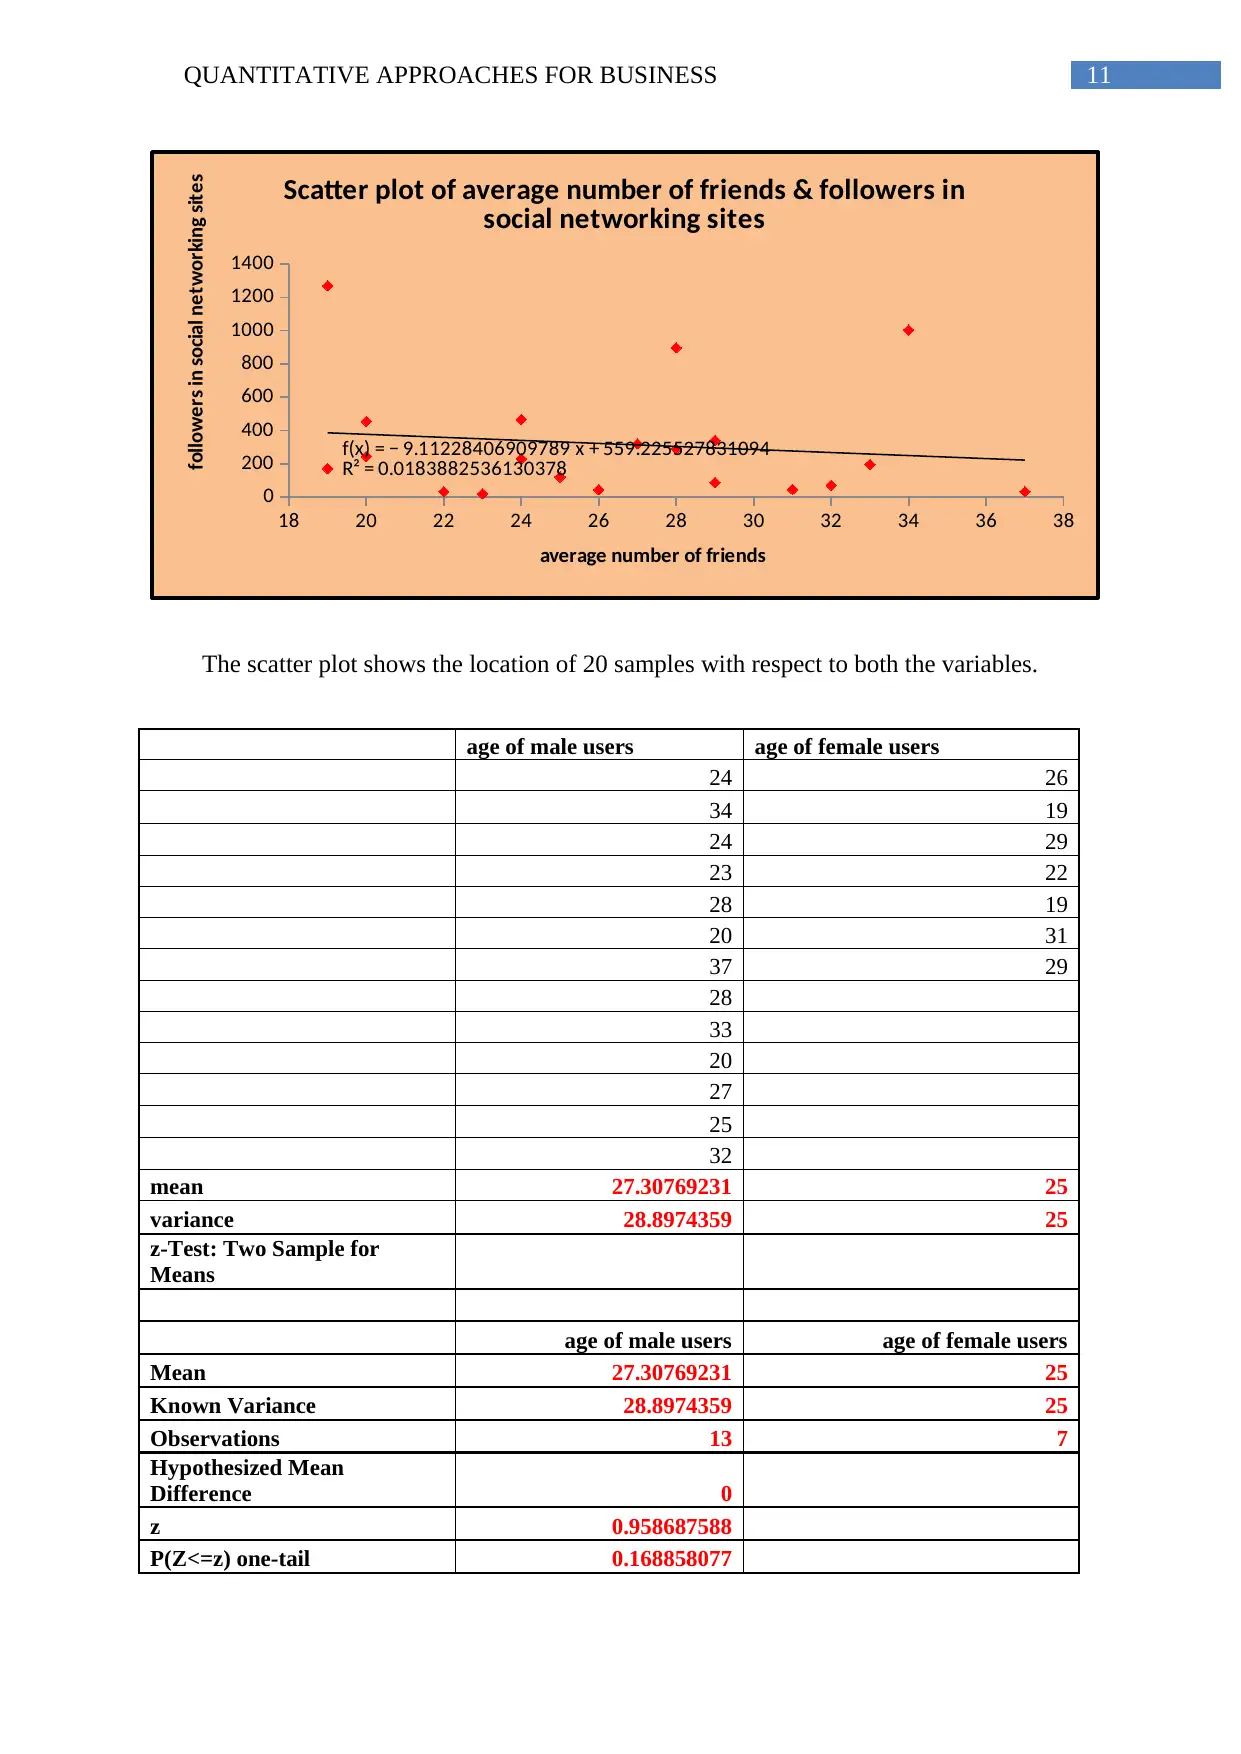
This project presents a quantitative analysis of social media usage, examining trends and user behavior. The study begins with a discussion of the increasing importance of social media and its impact on society. A questionnaire-based data collection method is employed, gathering responses from 20 participants on their social media habits, including age, gender, platform usage, and time spent. The dataset is analyzed using descriptive statistics, including means, standard deviations, and frequency distributions. Quantitative analysis includes a two-sample z-test to compare the means of ages between genders and a simple linear regression model to explore the relationship between age and the number of friends and followers. Qualitative analysis involves pie charts and line diagrams to visualize categorical data. The results reveal insights into social media usage patterns and the potential for addiction. The conclusion emphasizes the impact of social media on lifestyle, relationships, and time management. References to academic sources support the analysis, and appendices provide detailed statistical data, including descriptive and location statistics, box plots, and scatter plots. The project aims to provide a comprehensive understanding of social media usage through quantitative methods.
Contribute Materials
Your contribution can guide someone’s learning journey. Share your
documents today.

Running head: QUANTITATIVE APPROACHES FOR BUSINESS
Quantitative Approaches for Business
Name of the Student:
Name of the University:
Author’s note:
Quantitative Approaches for Business
Name of the Student:
Name of the University:
Author’s note:
Secure Best Marks with AI Grader
Need help grading? Try our AI Grader for instant feedback on your assignments.

1QUANTITATIVE APPROACHES FOR BUSINESS
1. Introduction:
The social media is taking the place of traditional media. Astonishingly, people are
being more willing to spend time in social media than traditional media. However, as digital
media consumption continues to increase, platform of social media also develops. Different
types of gadgets such as Smart phones, mobiles, iPod/iPad, Laptop and PC are getting easily
available in market. Technological facilities are also getting cheap and within the range of
common people.
Social media networking sites has attracted many people for sharing post, images,
video conferencing and all other things. A predicted percentage of active social media users
in case of the global point of view are 28% (Asur and Huberman, 2010). Although people
have hectic schedule, they are still spending a trivial amount of time on the sites of social
media. People are getting more advantages to express their thinking in the platform of social
media by attracting and engaging new audiences. The initiation of live-streaming features and
360-degree photos or videos is creating new platforms together with Snapchat, Instagram and
twitter (Tuten and Solomon 2017).
The quantity of time people squandered on social media is continuously enhancing.
Teenagers are also getting attracted to use social media and websites such as Facebook,
twitter, Google buzz, Flickr etc. People are being habituated to spend their time online with
the interaction of social media. From eight to eighty, corporate to senior citizen, everybody is
indulged in social media in current days (Rapp et al. 2013). The main reason is that it is
difficult to deny social media and its scopes that permit a number of people across the globe.
The different age groups of students spend their valuable time to connect with known or
unknown people rather than paying time for playing or studying. The different age group
majorly utilises the social media sites for enhancing their circle of network and keep

2QUANTITATIVE APPROACHES FOR BUSINESS
themselves updated with the current occurrences of associated interests (Saravanakumar and
SuganthaLakshmi 2012).
To provide readers an improved consideration of the landscape of social media, we
are surveying age wise time tired across the platforms of most popular social medias
anticipated within the lifetime of a consumer. Surprisingly, total time spent on social media
is greater than time spent in eating, drinking, studying, socializing and grooming (Kaplan and
Haenlein 2010). Though surfeit of anything is harmful, an intemperance use of social media
has also bought many fresh and unique problems. This problem is known as addiction. In
recent days, people are paying deficit time on social media websites accounting 28% percent
of online time spent.
2. Method of data collection:
One of the primary methods collects the data used for research study and therefore the
data is primary data. The data is collected by questionnaire method. It is a very easy, cheap
and less time consuming method (Warwick and Lininger 1975). First, a questionnaire of 10
questions is formed and possible answers are provided with each question to choose. Hence,
all the questions are close-ended questions. Secondly, the questionnaire is circulated via e-
mail and 20 complete samples were granting. No missing valued sample was permitted. The
data is authentic and true. Not sampling bias is present while collecting the dataset.
3. Summary of the data set:
The data set have 20 samples with 10 variables. No missing data is present in the dataset.
The responses of the dataset are gathered from questions of the questionnaire. The questions
and responses are collected as per the following table:
Questions Options for responses

3QUANTITATIVE APPROACHES FOR BUSINESS
What is your age? Any numerical value
What is your gender? □ male □ female
What is total number of social networking sites
are you member of?
Any numerical value
How long are you using social networking? □ Less than one month □ 1-6 months
□ 7-12 months □ More than one year
What is the daily spending on social networking
sites?
□ Less than 1 hour □ 1-3 hours per day
□ 3-6 hours per day □ More than 6 hours per day
What is your most preferable social media? □ facebook □ twitter □ Blogger
□ Google Buzz □ Flickr □ MySpace □ Friendster
What is your average number of friends and
followers in social networking sites?
Any numerical value
Have you increased the use of social networking
sites in last three months?
□ yes □ no
What kind of information you share most in social
network?
□ videos □ pictures □ status □ interests
□ contacts
What is the main reason behind the use of social
networking site?
□ chatting □ on-line buying □ make new friends □ to get
information □ profession & business contacts □ share the
experience □ make new friends □ play games
According to the responses of 10 variables, it is observed that “age” and “Average
number of friends & followers in social networking sites” are numerical variables. Rest of all
are categorical variables. Some of them are nominal (example-gender) and some are ordinal
(example-no. of social networking sites are you member of).
The descriptive statistics of both the quantitative variables are measured. Gender wise
equality of means is tested by two-sample z-test method. A simple linear regression model is
Secure Best Marks with AI Grader
Need help grading? Try our AI Grader for instant feedback on your assignments.

4QUANTITATIVE APPROACHES FOR BUSINESS
structured assuming “age” independent variable and “Average number of friends & followers
in social networking sites” dependent variable to find their linear relationship.
With the help of qualitative variables, necessary graphical summaries and frequency
distributions are executed.
4. Descriptive data analysis:
Quantitative Data Analysis:
The mean value of ages of social network users is 26.5 years. The mean value of
average number of friends and followers in social networking sites is 317.75. The standard
deviations of these two variables are respectively 5.236 years and 351.884 years. The
variance of age is 27.421 and variance of “average number of friends and followers in social
networking sites” is 123822.0921 (Oja 1983). The minimum and maximum values of age of
social network sites users are 19 and 37. The median age is calculated as 26.5. The minimum
and maximum values of average number of friends and followers in social networking sites
are 21 and 1270 with a median value 214.5.
The dependent variable is taken as average number of friends & followers in social
networking sites and independent variable is the age of the users. A scatter plot is created
according to that.
Now, we would like to find the difference of means of ages for male and female
social networking sites users. The calculated z-statistic is 0.958687588. The p-value of two-tail
z-statistic is 0.337716153. Therefore, we accept the null hypothesis of equality of averages of ages of
both the genders at 95% confidence interval.

5QUANTITATIVE APPROACHES FOR BUSINESS
Qualitative Data Analysis:
The pie chart indicates that number of social networking sites is highest for 3-4 and
lowest for 8-10. The line diagram infers that maximum people (7) are using social
networking sites for more than one year. Minimum number of people (3) is using social
networking sites for 1-6 months. The main reasons behind the use of social networking site
are chatting (4) and sharing the experience (4). The minor reasons behind social networking
site are the use of on-line buying (1) and play games (1). Most of the people (6) spend time
daily on social networking sites for 1 to 3 hours per day. Minimum number of people (4)
spends time daily on social networking sites for less than 1 hour per day.
The preferable social media according to survey is found to be Facebook (7) followed by
twitter (4). 65% people consider that their use of social sites has increased in last three
months and only 35% people incur that consideration. Among 20 people, 6 people consider
that they mostly share pictures followed by videos (5 people). Only 1 people uses social
network for contacts sharing.
5. Simple linear regression model:
The linear regression model is given as-
y = β0 + β1 * x.
(Zou, Tuncali and Silverman 2003)
Dependent variable (y): average number of friends & followers in social networking sites
Independent variable (x): age of the users

6QUANTITATIVE APPROACHES FOR BUSINESS
SUMMARY
OUTPUT
Regression Statistics
Multiple R
0.1356032
95
R Square
0.0183882
54
Adjusted R Square
-
0.0361457
32
Standard Error
358.18672
83
Observations 20
ANOVA
df SS MS F
Significanc
e F
Regression 1
43260.5686
2
43260.56
862
0.337188
88 0.568656
Residual 18
2309359.18
1
128297.7
323
Total 19 2352619.75
Coefficient
s
Standard
Error t Stat P-value Lower 95%
Upper
95%
Intercept
559.22552
78
423.492558
5
1.320508
511
0.203210
363 -330.499 1448.95
age
-
9.1122840
69
15.6924454
8
-
0.580679
67
0.568655
989 -42.0809
23.8563
2
(Montgomery, Peck and Vining 2012)
The intercept is β0 = 559.2255278 and slope is β1 = (-9.112284069).
The linear regression model is found to be-
“Average number of friends & followers in social networking sites” = 559.2255278 -
9.112284069* “age”.
The correlation between independent and dependent variables is 0.135603295, which
refers an insignificant correlation between them.
Paraphrase This Document
Need a fresh take? Get an instant paraphrase of this document with our AI Paraphraser

7QUANTITATIVE APPROACHES FOR BUSINESS
The multiple R-square is found to be 0.018388254 (1.8%). It refers an insignificant linear
association between dependent and independent variable. The p-value is 0.568655989(>0.05). It helps
us to reject the null hypothesis of linear correlation coefficient between these two variables.
18 20 22 24 26 28 30 32 34 36 38
-400
-200
0
200
400
600
800
1000
Residual Plot of age
age
Residuals
6. Conclusion:
The influence of social media addiction is affecting our life style. The impact of social
media makes our life easy and fulfilled. Independent of age, people are losing their
relationship, sufficient sleep and time for work purpose due to addiction of heavy social
media. A huge amount of time, people are wasting behind social media necessarily or
unnecessarily. The analysis of sampled data reflects that every day from “less than 1
hour” to “more than 6 hours”, all types of time spending on social networking were
significantly observed in this case.

8QUANTITATIVE APPROACHES FOR BUSINESS
7. References:
Asur, S. and Huberman, B.A., 2010, August. Predicting the future with social media.
In Proceedings of the 2010 IEEE/WIC/ACM International Conference on Web Intelligence
and Intelligent Agent Technology-Volume 01 (pp. 492-499). IEEE Computer Society.
Kaplan, A.M. and Haenlein, M., 2010. Users of the world, unite! The challenges and
opportunities of Social Media. Business horizons, 53(1), pp.59-68.
Montgomery, D.C., Peck, E.A. and Vining, G.G., 2012. Introduction to linear regression
analysis (Vol. 821). John Wiley & Sons.
Oja, H., 1983. Descriptive statistics for multivariate distributions. Statistics & Probability
Letters, 1(6), pp.327-332.
Rapp, A., Beitelspacher, L.S., Grewal, D. and Hughes, D.E., 2013. Understanding social
media effects across seller, retailer, and consumer interactions. Journal of the Academy of
Marketing Science, 41(5), pp.547-566.
Saravanakumar, M. and SuganthaLakshmi, T., 2012. Social media marketing. Life Science
Journal, 9(4), pp.4444-4451.
Tuten, T.L. and Solomon, M.R., 2017. Social media marketing. Sage.
Warwick, D.P. and Lininger, C.A., 1975. The sample survey: Theory and practice. McGraw-
Hill.
Zou, K.H., Tuncali, K. and Silverman, S.G., 2003. Correlation and simple linear
regression. Radiology, 227(3), pp.617-628.

9QUANTITATIVE APPROACHES FOR BUSINESS
8. Appendix:
Quantitative Analysis:
Descriptive statistics:
age
Average number of friends & followers in social
networking sites
Mean 26.5 Mean 317.75
Standard Error
1.1709195
67 Standard Error
78.68357
265
Median 26.5 Median 214.5
Mode 24 Mode 34
Standard Deviation
5.2365114
94 Standard Deviation
351.8836
343
Sample Variance
27.421052
63 Sample Variance
123822.0
921
Kurtosis
-
0.7473763
66 Kurtosis
2.104133
342
Skewness
0.2394721
6 Skewness
1.657225
894
Range 18 Range 1249
Minimum 19 Minimum 21
Maximum 37 Maximum 1270
Sum 530 Sum 6355
Count 20 Count 20
Confidence Level
(95.0%)
2.4507628
13 Confidence Level (95.0%)
164.6866
099
Location statistics:
age
Average number of friends & followers in social networking
sites
minimum 19 21
1st quartile 22.75 65.75
median 26.5 214.5
3rd quartile 29.5 370.5
maximum 37 1270
Secure Best Marks with AI Grader
Need help grading? Try our AI Grader for instant feedback on your assignments.

10QUANTITATIVE APPROACHES FOR BUSINESS
age
0
5
10
15
20
25
30
35
Distribution of age of social networking users
The box plot shows the distribution of age of social networking users.
Average number of friends & followers in social networking sites
0
50
100
150
200
250
300
350
400
Distribution of average number of friends and followers in
social networking sites
The box plot shows the distribution of average number of friends and followers in
social networking sites.

11QUANTITATIVE APPROACHES FOR BUSINESS
18 20 22 24 26 28 30 32 34 36 38
0
200
400
600
800
1000
1200
1400
f(x) = − 9.11228406909789 x + 559.225527831094
R² = 0.0183882536130378
Scatter plot of average number of friends & followers in
social networking sites
average number of friends
followers in social networking sites
The scatter plot shows the location of 20 samples with respect to both the variables.
age of male users age of female users
24 26
34 19
24 29
23 22
28 19
20 31
37 29
28
33
20
27
25
32
mean 27.30769231 25
variance 28.8974359 25
z-Test: Two Sample for
Means
age of male users age of female users
Mean 27.30769231 25
Known Variance 28.8974359 25
Observations 13 7
Hypothesized Mean
Difference 0
z 0.958687588
P(Z<=z) one-tail 0.168858077

12QUANTITATIVE APPROACHES FOR BUSINESS
z Critical one-tail 1.644853627
P(Z<=z) two-tail 0.337716153
z Critical two-tail 1.959963985
Qualitative Analysis:
5; 25%
6; 30%
5; 25%
4; 20%
Number of social networking sites you are member of
1-2
3-4
5-7
8-10
Less than one month "1-6" months "7-12" months More than one year
0
1
2
3
4
5
6
7
8
5
3
5
7
Distribution of duration of use of social networking sites
Frequency
Paraphrase This Document
Need a fresh take? Get an instant paraphrase of this document with our AI Paraphraser

13QUANTITATIVE APPROACHES FOR BUSINESS
chatting on-line
buying make new
friends to get
information profession
& business
contacts
share the
experience share
videos/
pics/music
play games
0
0.5
1
1.5
2
2.5
3
3.5
4
4.5
4
1
2
3
2
4
3
1
Main reason behind use of social networking site
Frequency
Less than 1 hour 1-3 hours per day 3-6 haours per day More than 6 hours per
day
0
1
2
3
4
5
6
7
4
6
5 5
Daily spending on social networking sites
Frequency

14QUANTITATIVE APPROACHES FOR BUSINESS
facebook twitter Blogger Google Buzz Flickr MySpace Friendster
0
1
2
3
4
5
6
7
6
4
2
3
2
1
2
Most preferable social media
Frequency
13; 65%
7; 35%
You incresed the use of social sites in last three months
yes
no
pictures videos interests status contacts
0
1
2
3
4
5
6
7
8
9
8
5 4
2 1
The information you share most in social network
Frequency
1 out of 15
Related Documents

Your All-in-One AI-Powered Toolkit for Academic Success.
+13062052269
info@desklib.com
Available 24*7 on WhatsApp / Email
Unlock your academic potential
© 2024 | Zucol Services PVT LTD | All rights reserved.