UOW Library Ground Floor Computer Usage Analysis Report 2018

Verified

Added on  2023/06/03

|6
|1695
|63
Report
AI Summary
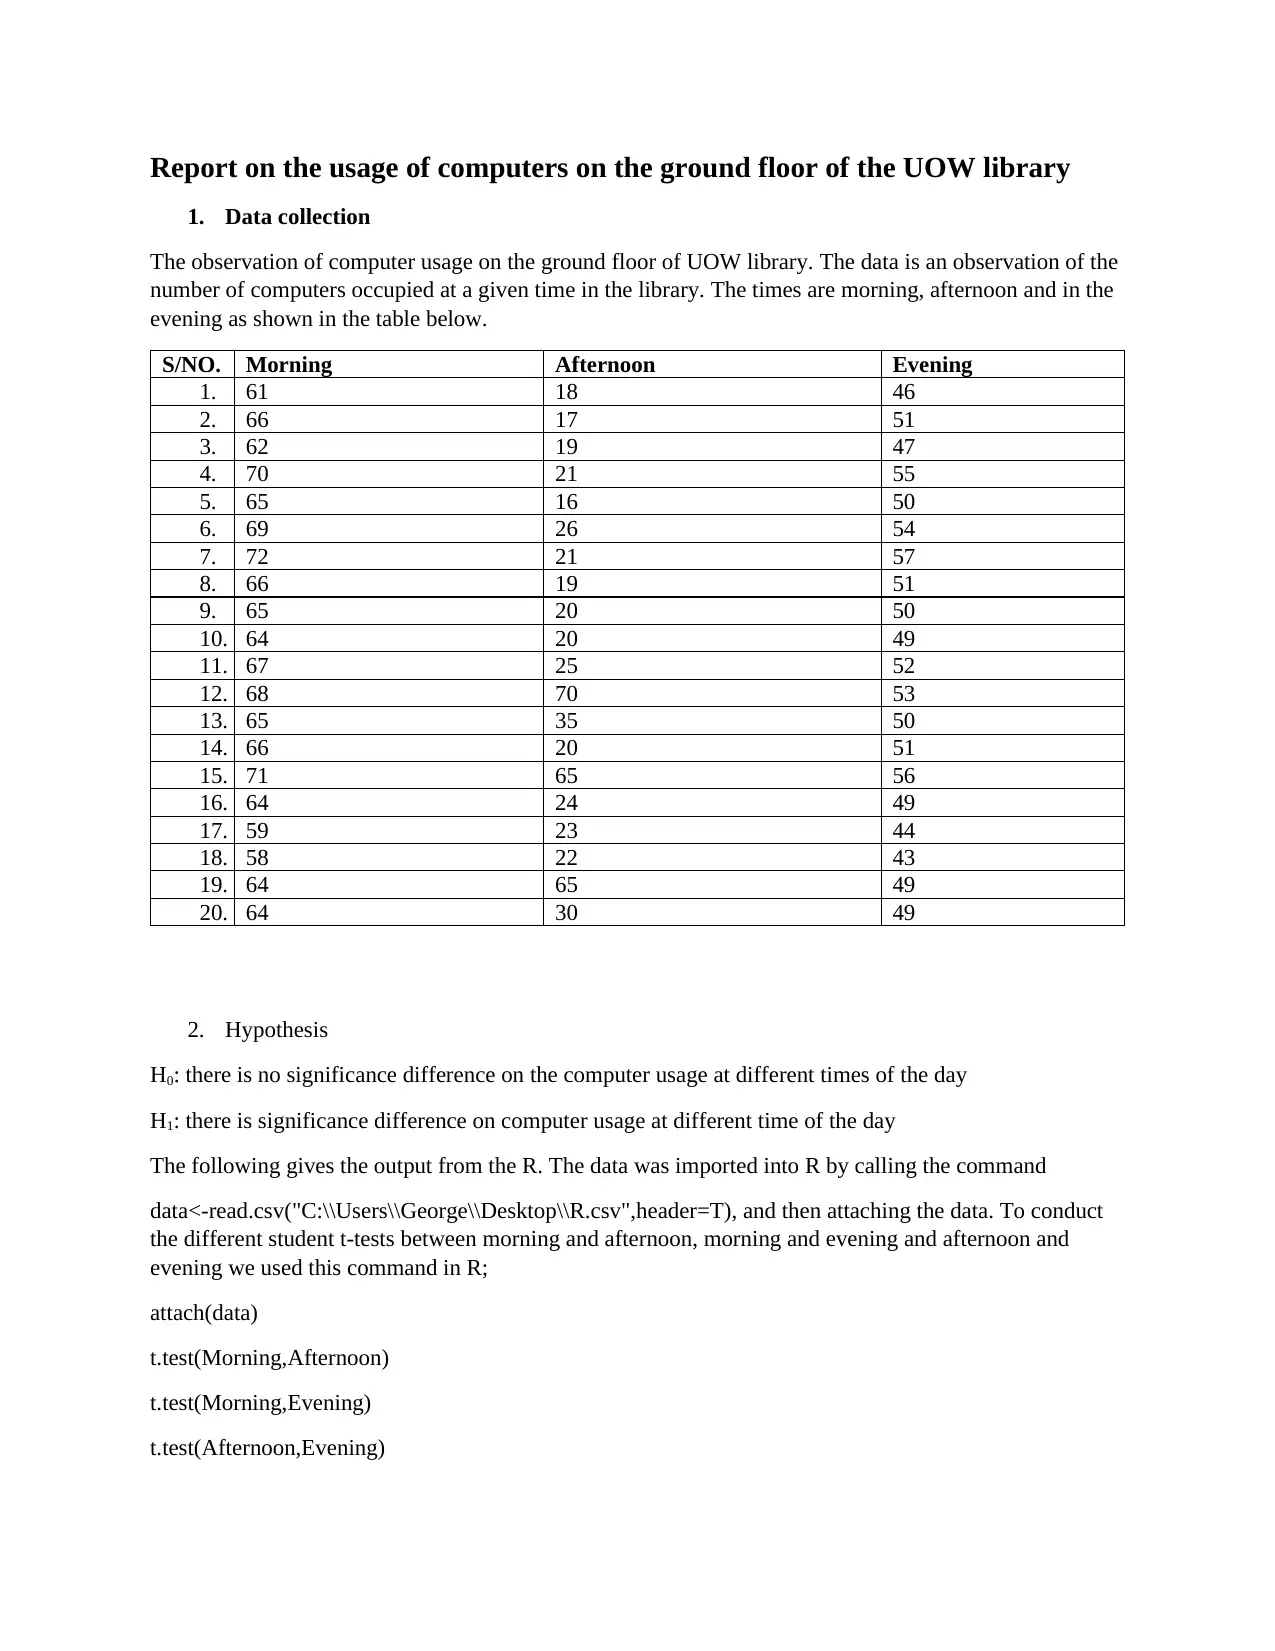
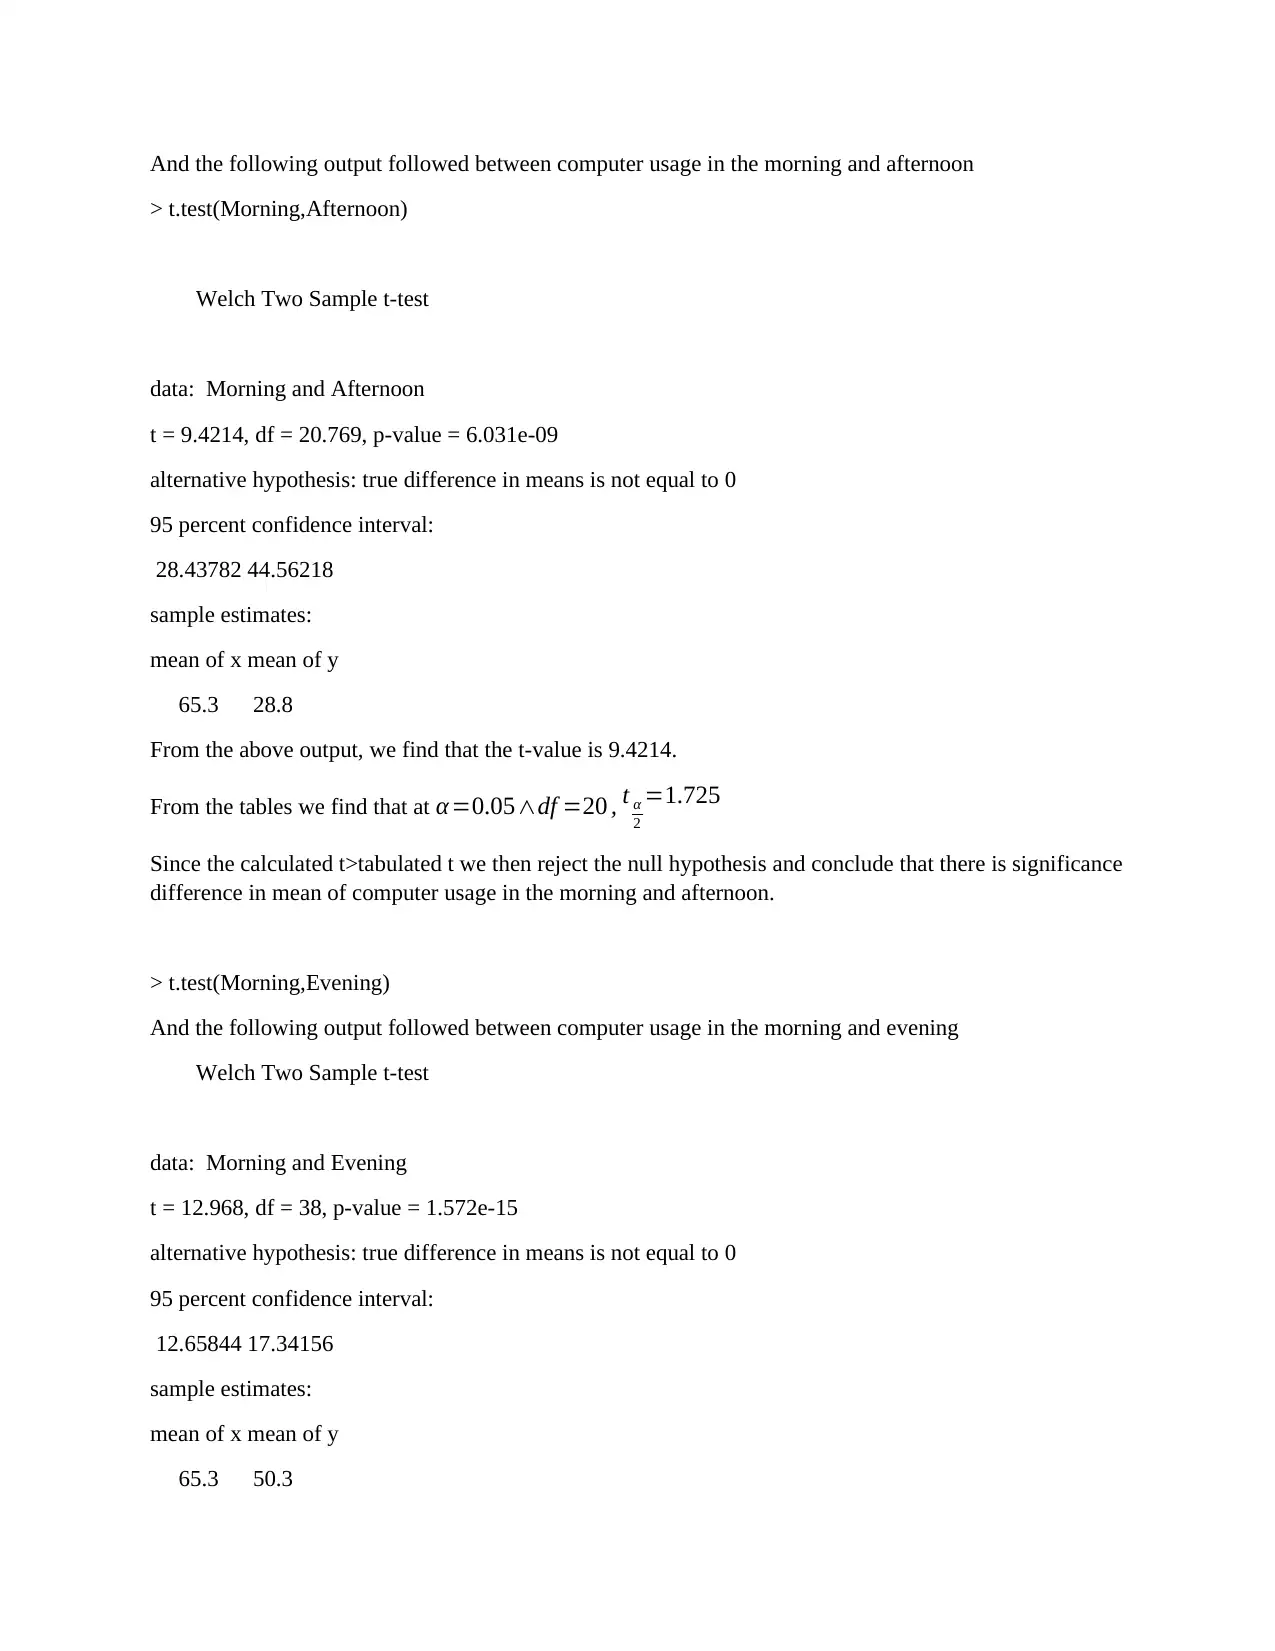
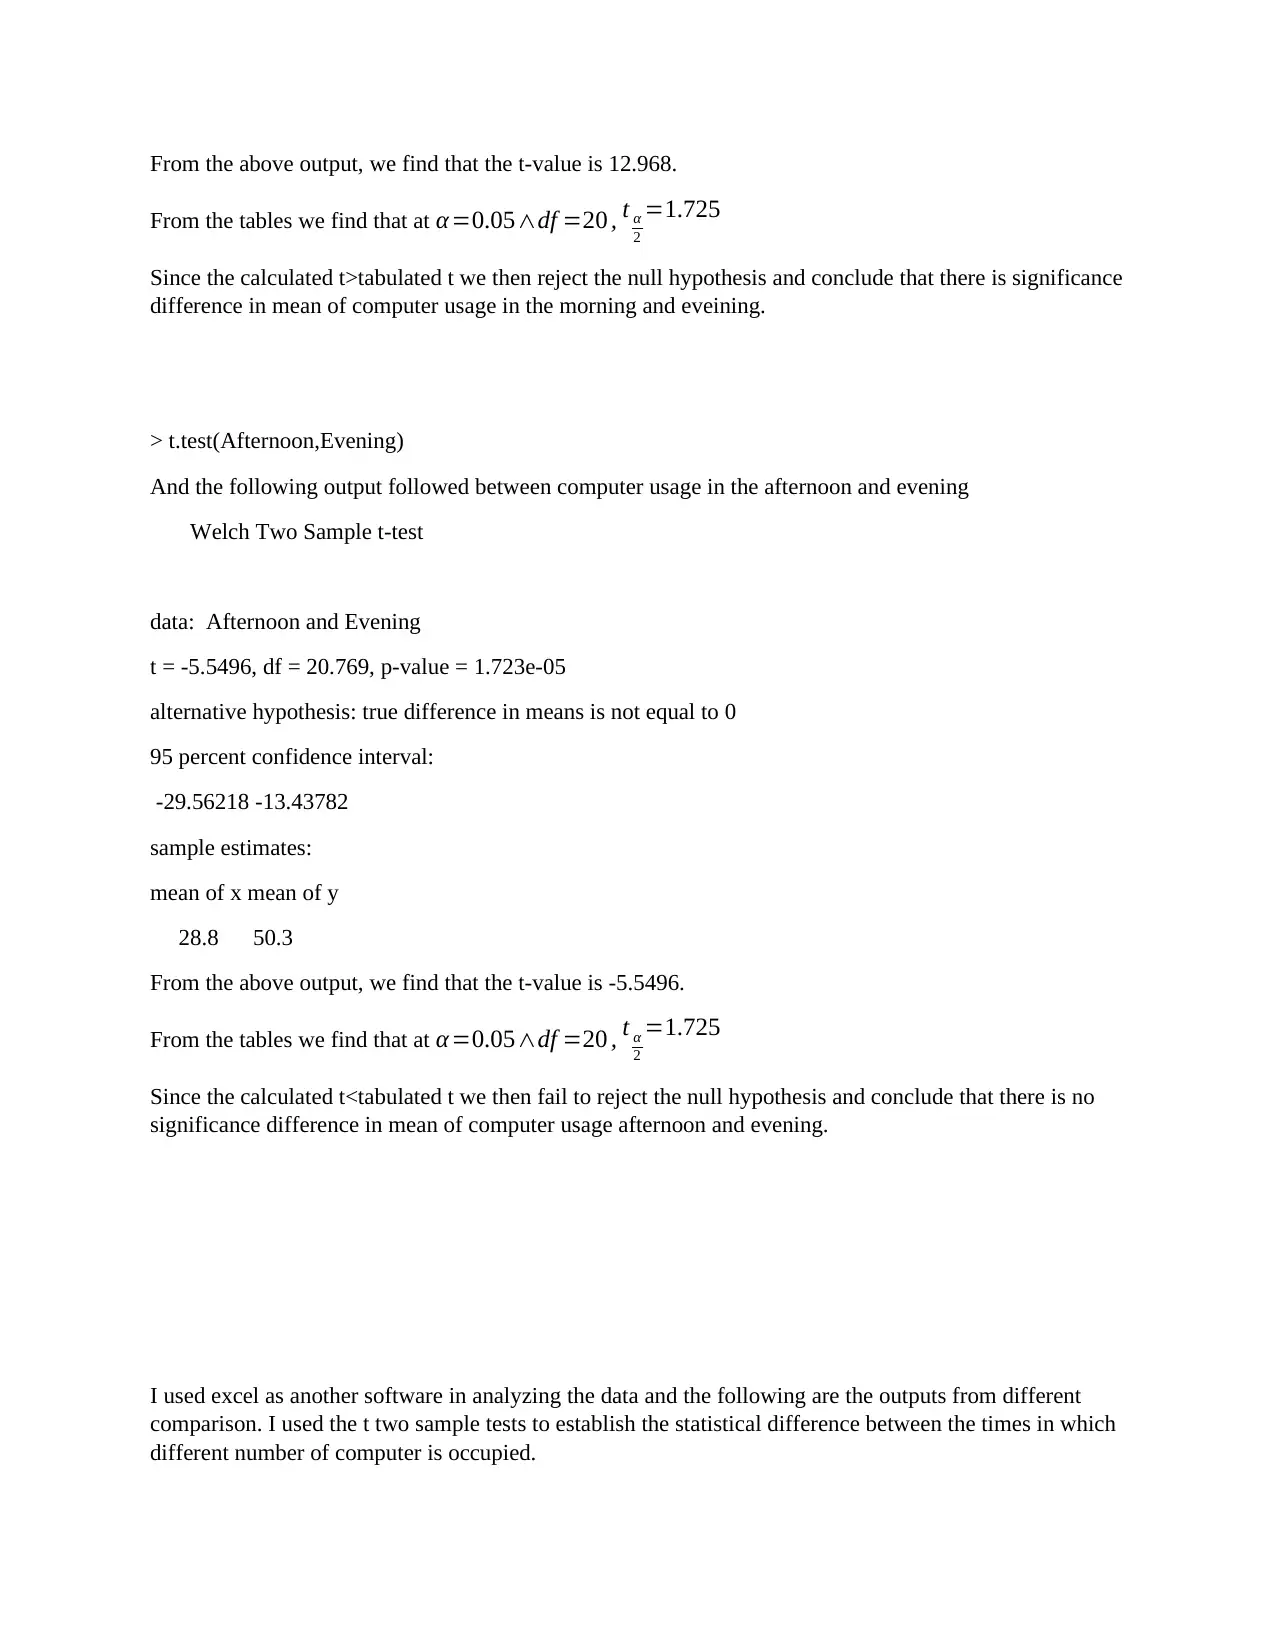
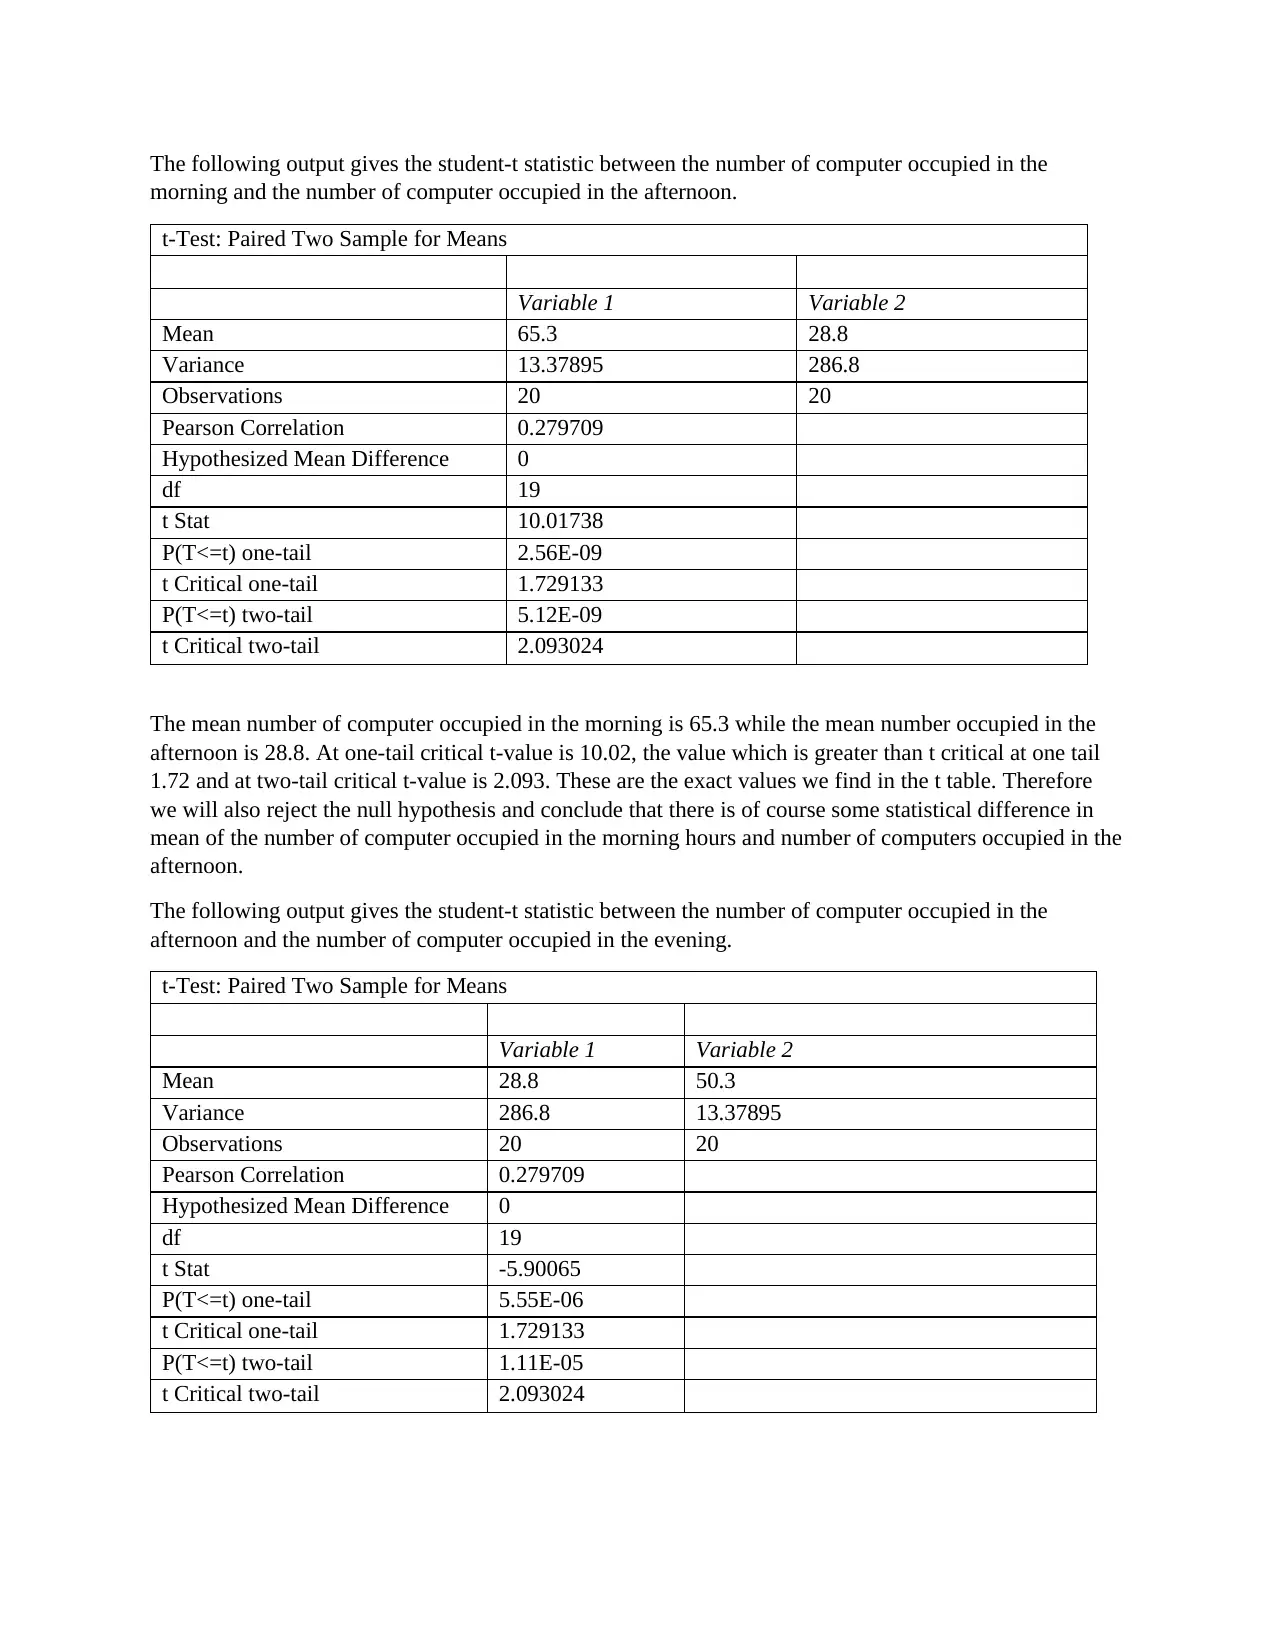
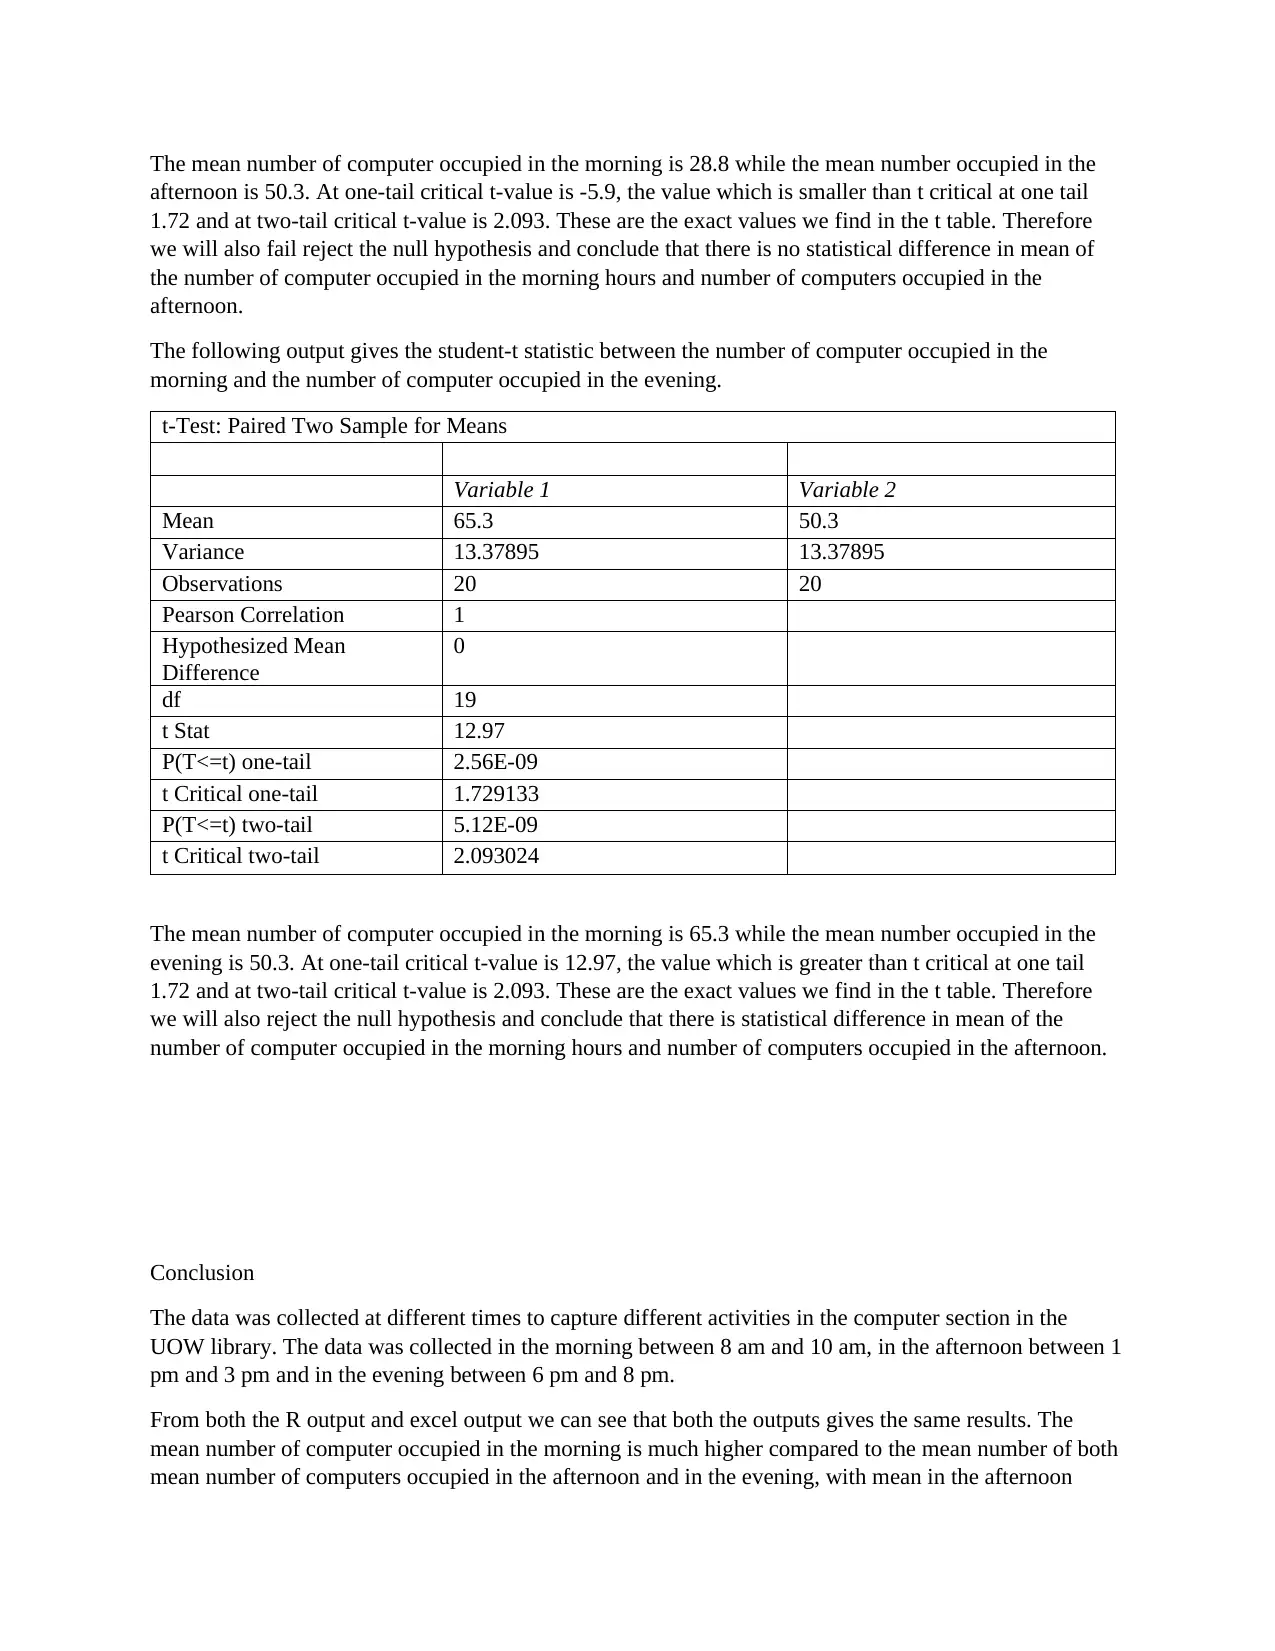
This report presents an analysis of computer usage on the ground floor of the University of Wollongong (UOW) library. The study involved collecting data on computer occupancy during morning, afternoon, and evening hours. A hypothesis was formulated to determine if there was a significant difference in computer usage across these times. The data was analyzed using t-tests in both R and Excel to compare the mean number of computers occupied during different periods. The results indicated statistically significant differences in computer usage between morning and afternoon, and morning and evening. However, no significant difference was found between afternoon and evening computer usage. The report concludes that the time of day significantly impacts computer usage patterns within the library, which may be influenced by student schedules and preferences. The findings are supported by both R and Excel outputs, providing robust evidence for the conclusions. The report includes detailed statistical outputs from both software packages and discusses potential reasons behind the observed trends.
Document Page
Report on the usage of computers on the ground floor of the UOW library
1. Data collection
The observation of computer usage on the ground floor of UOW library. The data is an observation of the
number of computers occupied at a given time in the library. The times are morning, afternoon and in the
evening as shown in the table below.
S/NO. Morning Afternoon Evening
1. 61 18 46
2. 66 17 51
3. 62 19 47
4. 70 21 55
5. 65 16 50
6. 69 26 54
7. 72 21 57
8. 66 19 51
9. 65 20 50
10. 64 20 49
11. 67 25 52
12. 68 70 53
13. 65 35 50
14. 66 20 51
15. 71 65 56
16. 64 24 49
17. 59 23 44
18. 58 22 43
19. 64 65 49
20. 64 30 49
2. Hypothesis
H0: there is no significance difference on the computer usage at different times of the day
H1: there is significance difference on computer usage at different time of the day
The following gives the output from the R. The data was imported into R by calling the command
data<-read.csv("C:\\Users\\George\\Desktop\\R.csv",header=T), and then attaching the data. To conduct
the different student t-tests between morning and afternoon, morning and evening and afternoon and
evening we used this command in R;
attach(data)
t.test(Morning,Afternoon)
t.test(Morning,Evening)
t.test(Afternoon,Evening)
tabler-icon-diamond-filled.svg

Secure Best Marks with AI Grader

Need help grading? Try our AI Grader for instant feedback on your assignments.
Document Page
And the following output followed between computer usage in the morning and afternoon
> t.test(Morning,Afternoon)
Welch Two Sample t-test
data: Morning and Afternoon
t = 9.4214, df = 20.769, p-value = 6.031e-09
alternative hypothesis: true difference in means is not equal to 0
95 percent confidence interval:
28.43782 44.56218
sample estimates:
mean of x mean of y
65.3 28.8
From the above output, we find that the t-value is 9.4214.
From the tables we find that at α =0.05df =20 , t α
2
=1.725
Since the calculated t>tabulated t we then reject the null hypothesis and conclude that there is significance
difference in mean of computer usage in the morning and afternoon.
> t.test(Morning,Evening)
And the following output followed between computer usage in the morning and evening
Welch Two Sample t-test
data: Morning and Evening
t = 12.968, df = 38, p-value = 1.572e-15
alternative hypothesis: true difference in means is not equal to 0
95 percent confidence interval:
12.65844 17.34156
sample estimates:
mean of x mean of y
65.3 50.3
Document Page
From the above output, we find that the t-value is 12.968.
From the tables we find that at α =0.05df =20 , t α
2
=1.725
Since the calculated t>tabulated t we then reject the null hypothesis and conclude that there is significance
difference in mean of computer usage in the morning and eveining.
> t.test(Afternoon,Evening)
And the following output followed between computer usage in the afternoon and evening
Welch Two Sample t-test
data: Afternoon and Evening
t = -5.5496, df = 20.769, p-value = 1.723e-05
alternative hypothesis: true difference in means is not equal to 0
95 percent confidence interval:
-29.56218 -13.43782
sample estimates:
mean of x mean of y
28.8 50.3
From the above output, we find that the t-value is -5.5496.
From the tables we find that at α =0.05df =20 , t α
2
=1.725
Since the calculated t<tabulated t we then fail to reject the null hypothesis and conclude that there is no
significance difference in mean of computer usage afternoon and evening.
I used excel as another software in analyzing the data and the following are the outputs from different
comparison. I used the t two sample tests to establish the statistical difference between the times in which
different number of computer is occupied.
Document Page
The following output gives the student-t statistic between the number of computer occupied in the
morning and the number of computer occupied in the afternoon.
t-Test: Paired Two Sample for Means
Variable 1 Variable 2
Mean 65.3 28.8
Variance 13.37895 286.8
Observations 20 20
Pearson Correlation 0.279709
Hypothesized Mean Difference 0
df 19
t Stat 10.01738
P(T<=t) one-tail 2.56E-09
t Critical one-tail 1.729133
P(T<=t) two-tail 5.12E-09
t Critical two-tail 2.093024
The mean number of computer occupied in the morning is 65.3 while the mean number occupied in the
afternoon is 28.8. At one-tail critical t-value is 10.02, the value which is greater than t critical at one tail
1.72 and at two-tail critical t-value is 2.093. These are the exact values we find in the t table. Therefore
we will also reject the null hypothesis and conclude that there is of course some statistical difference in
mean of the number of computer occupied in the morning hours and number of computers occupied in the
afternoon.
The following output gives the student-t statistic between the number of computer occupied in the
afternoon and the number of computer occupied in the evening.
t-Test: Paired Two Sample for Means
Variable 1 Variable 2
Mean 28.8 50.3
Variance 286.8 13.37895
Observations 20 20
Pearson Correlation 0.279709
Hypothesized Mean Difference 0
df 19
t Stat -5.90065
P(T<=t) one-tail 5.55E-06
t Critical one-tail 1.729133
P(T<=t) two-tail 1.11E-05
t Critical two-tail 2.093024
tabler-icon-diamond-filled.svg

Secure Best Marks with AI Grader

Need help grading? Try our AI Grader for instant feedback on your assignments.
Document Page
The mean number of computer occupied in the morning is 28.8 while the mean number occupied in the
afternoon is 50.3. At one-tail critical t-value is -5.9, the value which is smaller than t critical at one tail
1.72 and at two-tail critical t-value is 2.093. These are the exact values we find in the t table. Therefore
we will also fail reject the null hypothesis and conclude that there is no statistical difference in mean of
the number of computer occupied in the morning hours and number of computers occupied in the
afternoon.
The following output gives the student-t statistic between the number of computer occupied in the
morning and the number of computer occupied in the evening.
t-Test: Paired Two Sample for Means
Variable 1 Variable 2
Mean 65.3 50.3
Variance 13.37895 13.37895
Observations 20 20
Pearson Correlation 1
Hypothesized Mean
Difference
0
df 19
t Stat 12.97
P(T<=t) one-tail 2.56E-09
t Critical one-tail 1.729133
P(T<=t) two-tail 5.12E-09
t Critical two-tail 2.093024
The mean number of computer occupied in the morning is 65.3 while the mean number occupied in the
evening is 50.3. At one-tail critical t-value is 12.97, the value which is greater than t critical at one tail
1.72 and at two-tail critical t-value is 2.093. These are the exact values we find in the t table. Therefore
we will also reject the null hypothesis and conclude that there is statistical difference in mean of the
number of computer occupied in the morning hours and number of computers occupied in the afternoon.
Conclusion
The data was collected at different times to capture different activities in the computer section in the
UOW library. The data was collected in the morning between 8 am and 10 am, in the afternoon between 1
pm and 3 pm and in the evening between 6 pm and 8 pm.
From both the R output and excel output we can see that both the outputs gives the same results. The
mean number of computer occupied in the morning is much higher compared to the mean number of both
mean number of computers occupied in the afternoon and in the evening, with mean in the afternoon
Document Page
much lower. From both the output we realize that there exist no statistical mean difference between
computer occupied in the afternoon and in the evening. The mean number of computer occupied in the
morning is 65.3 followed by mean number of computers occupied in the evening at 50.3 and mean
number of computer occupied in the afternoon at 28.8.
The different in mean those time can be explained by the fact that most students prefer to go there in the
morning when their minds are still fresh and maybe want to spend the rest of the day doing other things.
Less occupation of computers is recorded in the afternoon maybe because of few student who have
classes other times beside the afternoon. Another reason why afternoon receive few guest are received by
the computers due to the fact that it is on the ground floor and people are few attending library at that
time, and many may prefer higher floors. Evening has high mean following morning due to the fact that it
find many people unoccupied with other things especially classes. Most classes end before six hence
many people find time.
Considering the standard deviation, we realize that in the afternoon the standard deviation of computer
occupied is 16.93. This number is large when compared with both the standard deviations of computer
occupied in the morning and in the evening. This is of interest as it can be seen that some days had influx
of students occupying computers in the afternoon. This can be as a result of urgent work needed by the
lecturer or when the project work is needed and time is limited. Some students may also find it difficult to
study after lunch maybe after heavy lunch as some may prefer other activities during that time of that
particular day.
chevron_up_icon
1 out of 6
circle_padding
hide_on_mobile
zoom_out_icon
logo.png

Your All-in-One AI-Powered Toolkit for Academic Success.

Available 24*7 on WhatsApp / Email

[object Object]