Report on Quantitative Analysis of Footwear User Study Data
VerifiedAdded on 2023/06/11
|11
|1479
|201
Report
AI Summary
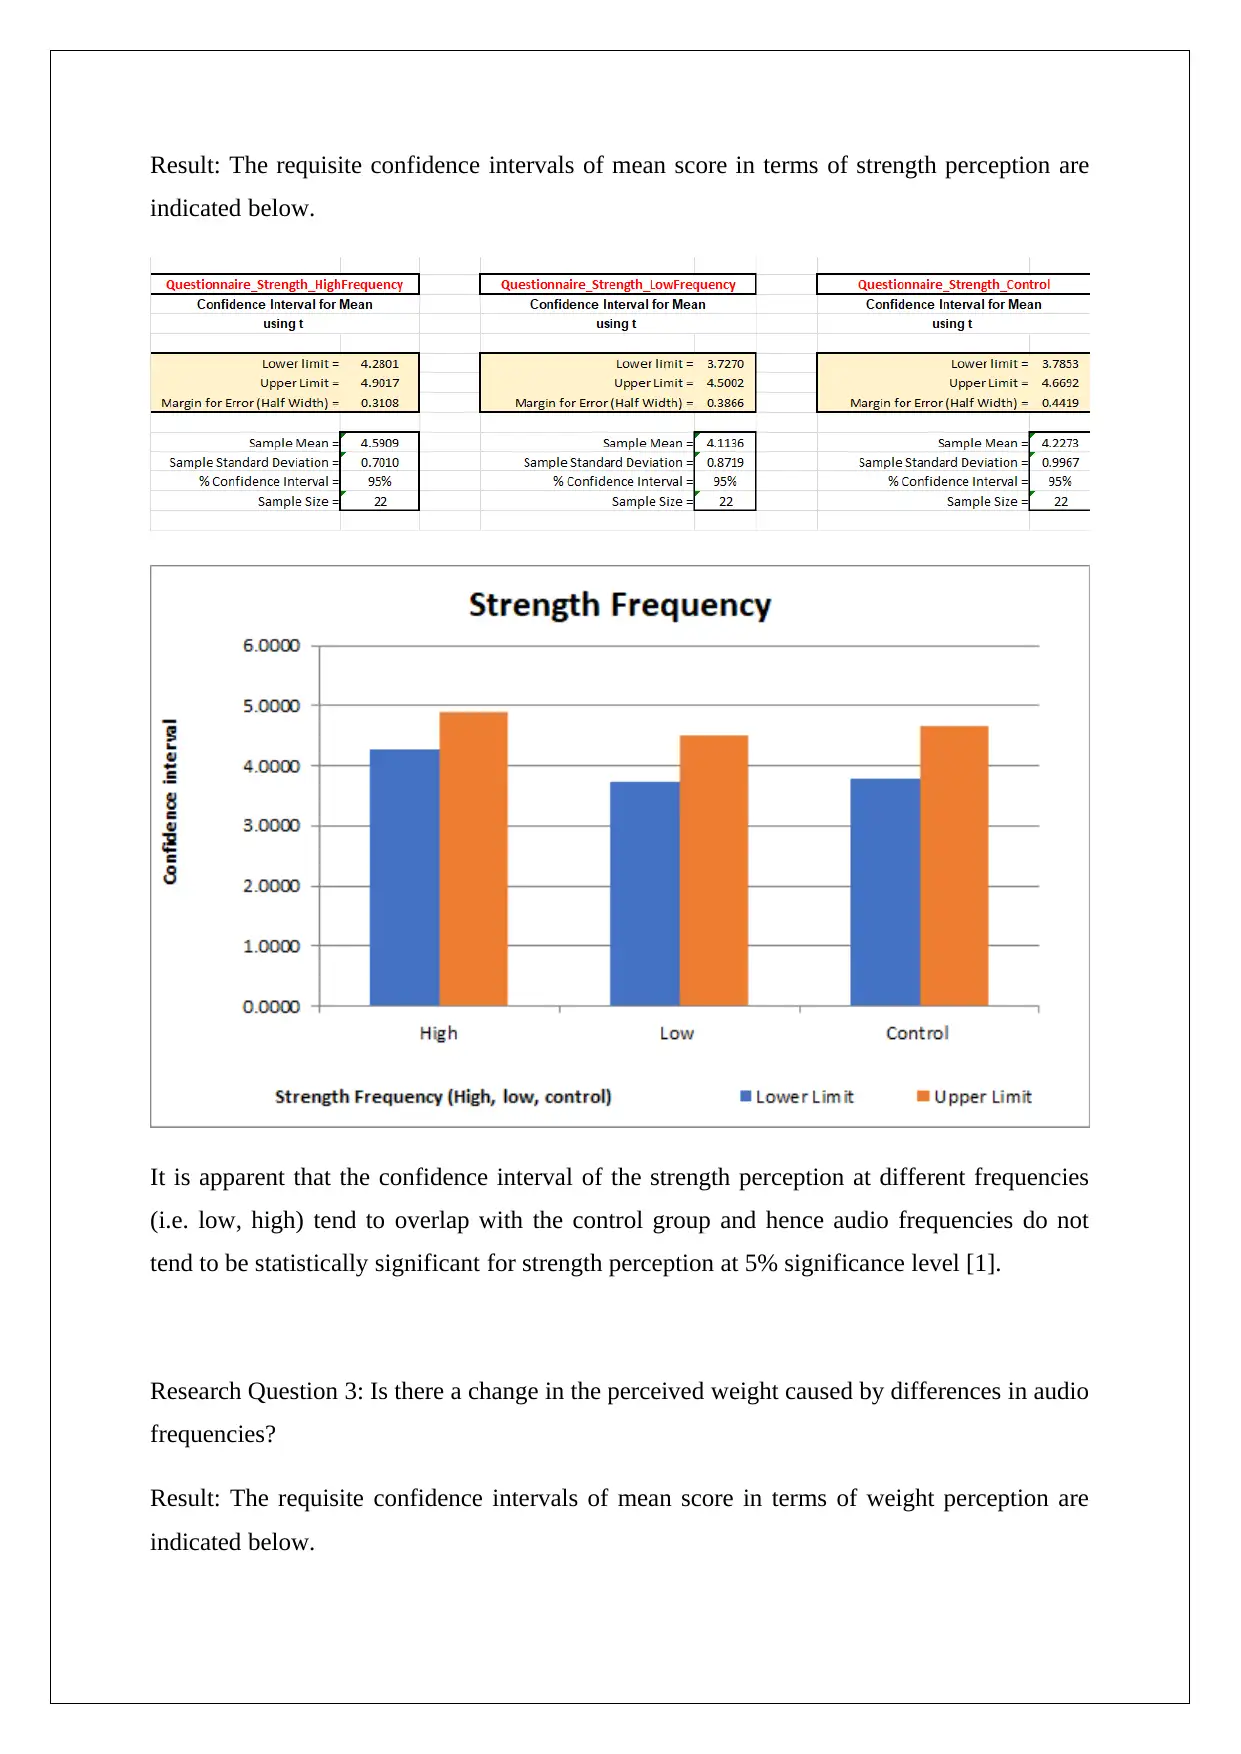
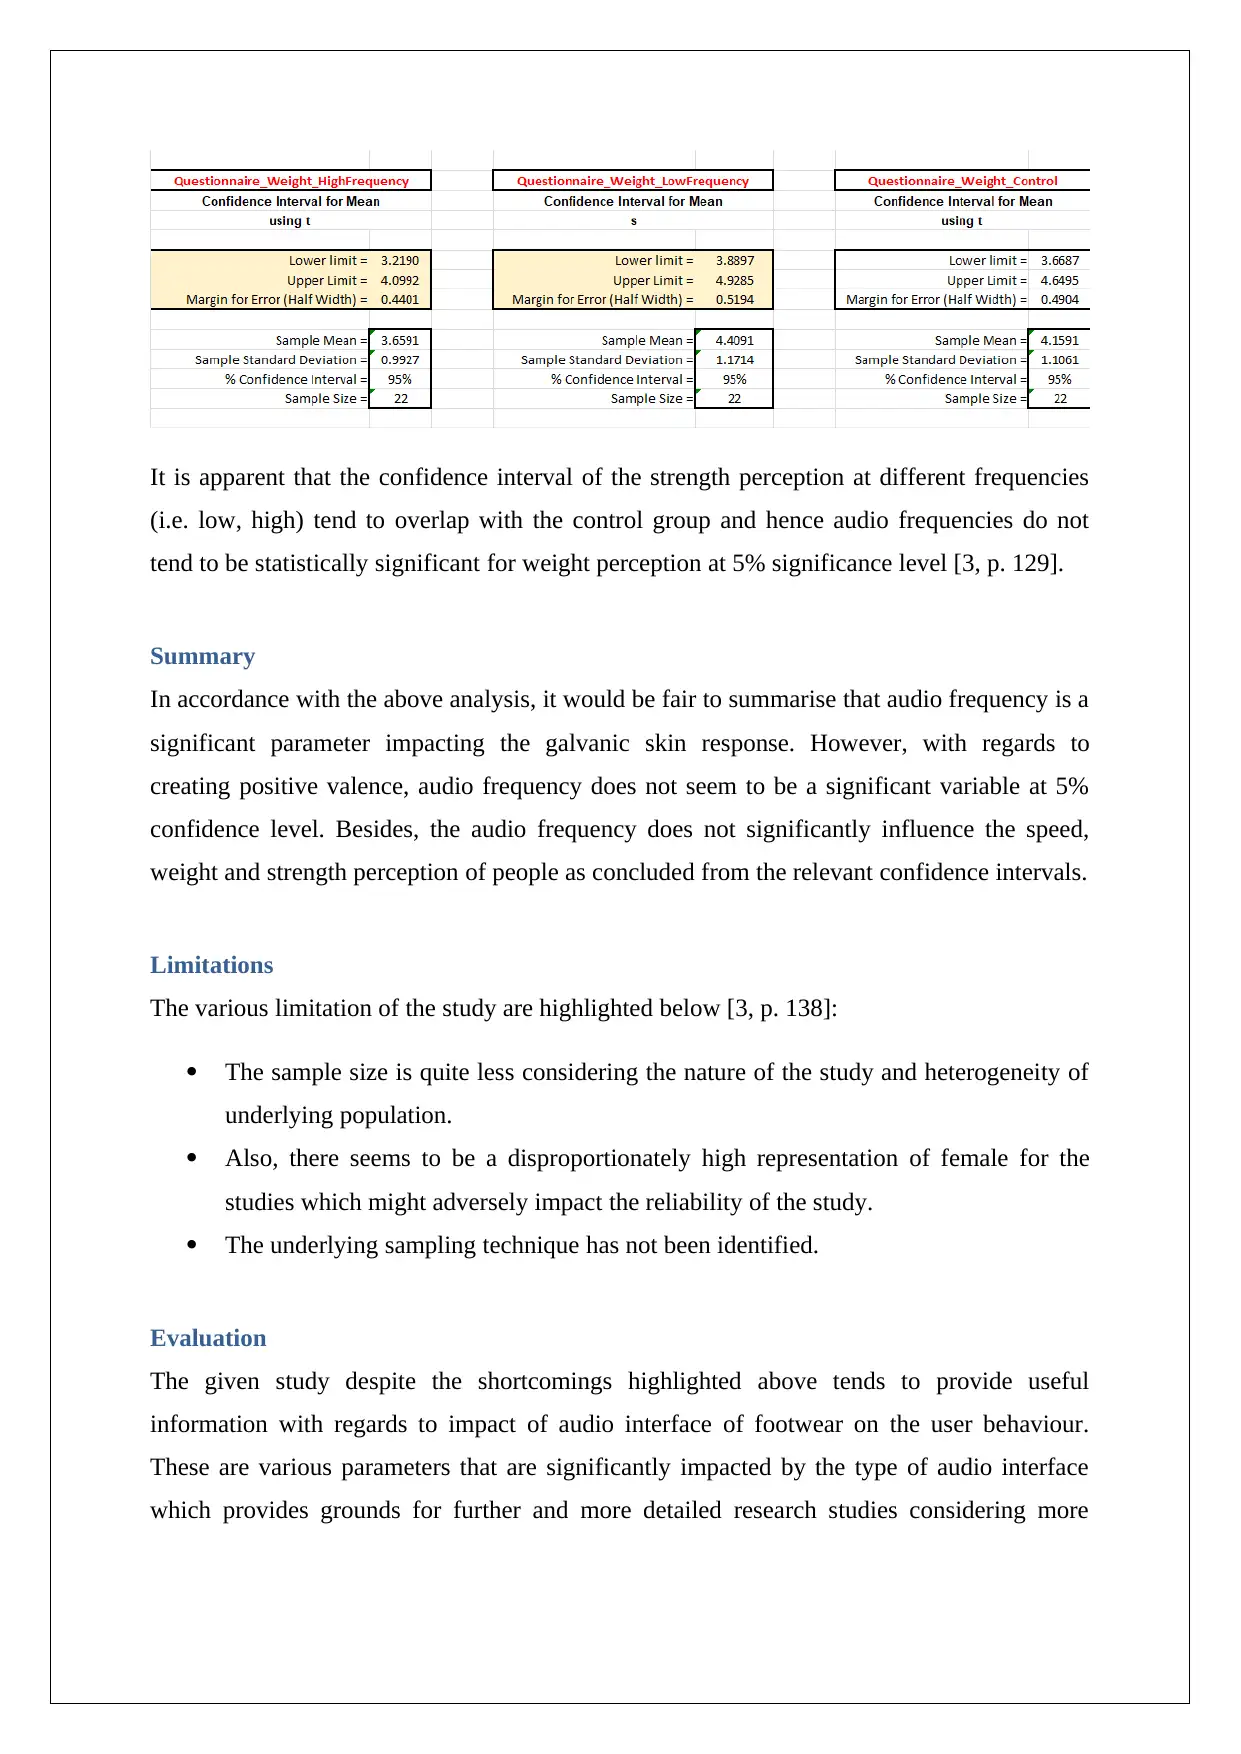
This report presents a quantitative analysis of data from a footwear user study, investigating the impact of different audio frequencies on user behavior. The analysis includes descriptive statistics and inferential statistical techniques, such as confidence intervals, to assess the significance of audio frequency on galvanic skin response, emotional valence, and perceptions of speed, strength, and weight. The findings indicate that audio frequency significantly impacts galvanic skin response but not necessarily emotional valence or the perception of speed, weight, and strength. The report acknowledges limitations such as the sample size and disproportionate gender representation and concludes with recommendations for future research to validate these findings with a larger and more diverse sample. Desklib provides access to similar solved assignments and past papers for students.

QUANTITATIVE ANALYSIS
ASSIGNMENT 3
STUDENT ID /NAME
[Pick the date]
ASSIGNMENT 3
STUDENT ID /NAME
[Pick the date]
Paraphrase This Document
Need a fresh take? Get an instant paraphrase of this document with our AI Paraphraser

Table of Contents
Data Encoding............................................................................................................................1
Missing or Mismatched Data.....................................................................................................2
Statistical Techniques and Parameters.......................................................................................2
Descriptive Statistics..................................................................................................................2
Analysis......................................................................................................................................4
Summary....................................................................................................................................9
Limitations.................................................................................................................................9
Evaluation..................................................................................................................................9
References..................................................................................................................................9
Data Encoding
With regards to data encoding, there was no requirement for cleaning of data and related
encoding. The data presented in the original form has been used for conducting the analysis.

Missing or Mismatched Data
The problem of missing data was indeed encountered while conducting analysis based on the
given data. In order to resolve the same, two pronged strategy has been considered. In cases
where the data was found missing for all the variables that were being compared, then instead
of substituting the blanks with some values, it was decided that the whole observation be
ignored for all the three variables so as to reduce any inaccuracy in the results. However, in
cases where, one of the data was found missing while the other variables had that particular
data, then in such cases, the blank was substituted with the average value of the given
variable. Considering that there were only limited blanks in the data where data has to be
filled, hence no significant impact on the accuracy of the analysis is expected [1].
Statistical Techniques and Parameters
Considering that the focus of the given exercise was to derive conclusions for the population
based on the given sample, hence the use of inferential statistical techniques was quite
prevalent. In particular confidence interval has been computed for the various variables and
also used to conduct hypothesis test. The confidence interval has been taken as 95%. The
parameters used have been proportion as well as mean depending upon the underlying
demand of the task. Further, descriptive statistics has also been used to highlight the summary
of certain selected variables in the sample data presented [3, p. 125].
Descriptive Statistics
The summary statistics of the selected variables is indicated below.
⊘ This is a preview!⊘
Do you want full access?
Subscribe today to unlock all pages.

Trusted by 1+ million students worldwide

Based on the above summary statistics, it is apparent that the average responses for
perception of speed under the high and low frequency for the given sample tends to differ. An
indication of this is provided by the comparison of the median score which is 1 point lower
for low frequency in comparison with high frequency. However, in case of low frequency
related speed perception, there is high variability as indicated from the various measures of
dispersion such as range, standard deviation and variance [2, p. 433].
Paraphrase This Document
Need a fresh take? Get an instant paraphrase of this document with our AI Paraphraser

It is apparent that average value of the speed related perception in the control case is 4.32
which incidentally lies between the mean value for high frequency audio and low frequency
audio. This hints at the existence of a positive relationship between audio frequency and
speed perception. Further, variability parameters are comparable to that of low audio
frequency related speed perception [2, p. 412].
The descriptive statistics highlighted above indicate that the high frequency feet localization
score on the average tends to exceed the corresponding scores for low frequency audio.
However, the variation seems to be higher for the low frequency audio based response in
comparison to the high frequency based audio as is apparent from the various dispersion
related statistics [1].

Analysis
The requisite confidence intervals for comparison of galvanic skin response for the three
different frequencies are highlighted below.
From the above confidence intervals, it is apparent that the three confidence intervals show
no overlapping and each of these has a unique confidence interval. This is indicative of the
response of the audio frequency being significant in regards to galvanic skin response. If
there was an overlapping confidence interval, then it would have been concluded that the
underlying difference in not statistically significant. However, in this case, it would be
appropriate to conclude that audio frequency is a significant variable impacting galvanic skin
response [3, p. 138].
⊘ This is a preview!⊘
Do you want full access?
Subscribe today to unlock all pages.

Trusted by 1+ million students worldwide

The 95% confidence intervals in relation to the proportion of participants who had a positive
emotional valence for the three frequencies are captured below based on the sample data
provided [2, p. 433].
Based on the above, we can conclude with 95% confidence that proportion of people who
would have a positive emotional valence for high frequency audio would lie between 0.5976
and 0.9478. Also, it can be concluded with 95% confidence that proportion of people who
would have a positive emotional valence for low frequency audio would lie between 0.2911
and 0.7089. Also, the conclusion can be made with 95% confidence that that proportion of
people who would have a positive emotional valence without any audio would lie between
0.3855 and 0.7964. Owing to overlapping of the above confidence intervals, it cannot be
assumed that the given variable is statistically significant at 5% significance level [2, p. 422].
Paraphrase This Document
Need a fresh take? Get an instant paraphrase of this document with our AI Paraphraser

Research Question 1: Is there a change in the perceived speed caused by differences in audio
frequencies?
Result: The requisite confidence intervals of mean score in terms of speed perception are
indicated below.
It is apparent that the confidence interval of the speed perception at different frequencies (i.e.
low, high) tend to overlap with the control group and hence audio frequencies do not tend to
be statistically significant for speed perception at 5% significance level [3, p. 125].
Research Question 2: Is there a change in the perceived strength caused by differences in
audio frequencies?

Result: The requisite confidence intervals of mean score in terms of strength perception are
indicated below.
It is apparent that the confidence interval of the strength perception at different frequencies
(i.e. low, high) tend to overlap with the control group and hence audio frequencies do not
tend to be statistically significant for strength perception at 5% significance level [1].
Research Question 3: Is there a change in the perceived weight caused by differences in audio
frequencies?
Result: The requisite confidence intervals of mean score in terms of weight perception are
indicated below.
indicated below.
It is apparent that the confidence interval of the strength perception at different frequencies
(i.e. low, high) tend to overlap with the control group and hence audio frequencies do not
tend to be statistically significant for strength perception at 5% significance level [1].
Research Question 3: Is there a change in the perceived weight caused by differences in audio
frequencies?
Result: The requisite confidence intervals of mean score in terms of weight perception are
indicated below.
⊘ This is a preview!⊘
Do you want full access?
Subscribe today to unlock all pages.

Trusted by 1+ million students worldwide

It is apparent that the confidence interval of the strength perception at different frequencies
(i.e. low, high) tend to overlap with the control group and hence audio frequencies do not
tend to be statistically significant for weight perception at 5% significance level [3, p. 129].
Summary
In accordance with the above analysis, it would be fair to summarise that audio frequency is a
significant parameter impacting the galvanic skin response. However, with regards to
creating positive valence, audio frequency does not seem to be a significant variable at 5%
confidence level. Besides, the audio frequency does not significantly influence the speed,
weight and strength perception of people as concluded from the relevant confidence intervals.
Limitations
The various limitation of the study are highlighted below [3, p. 138]:
The sample size is quite less considering the nature of the study and heterogeneity of
underlying population.
Also, there seems to be a disproportionately high representation of female for the
studies which might adversely impact the reliability of the study.
The underlying sampling technique has not been identified.
Evaluation
The given study despite the shortcomings highlighted above tends to provide useful
information with regards to impact of audio interface of footwear on the user behaviour.
These are various parameters that are significantly impacted by the type of audio interface
which provides grounds for further and more detailed research studies considering more
Paraphrase This Document
Need a fresh take? Get an instant paraphrase of this document with our AI Paraphraser

variables and a greater sample size so as to lead to valid results which can enable
implementation of this in actual footwear.
References
[1] A.D. Lind, G.W. Marchal and A.S. Wathen, Statistical Techniques in Business and
Economics. 15th ed. New York: McGraw-Hill/Irwin, 2012.
[2] P. Eriksson and A. Kovalainen, Quantitative methods in business research. 3rd ed.
London: Sage Publications, 2015, pp. 412-435.
[3] T. Hastie, R. Tibshirani and J. Friedman, The Elements of Statistical Learning. 4th
ed. New York: Springer Publications, 2011, pp. 124-139.
1 out of 11
Related Documents

Your All-in-One AI-Powered Toolkit for Academic Success.
+13062052269
info@desklib.com
Available 24*7 on WhatsApp / Email
Unlock your academic potential
Copyright © 2020–2025 A2Z Services. All Rights Reserved. Developed and managed by ZUCOL.