Quantitative Analysis Assignment: Problem Solving for 7011GBS Students
VerifiedAdded on 2023/01/17
|12
|1176
|100
Homework Assignment
AI Summary
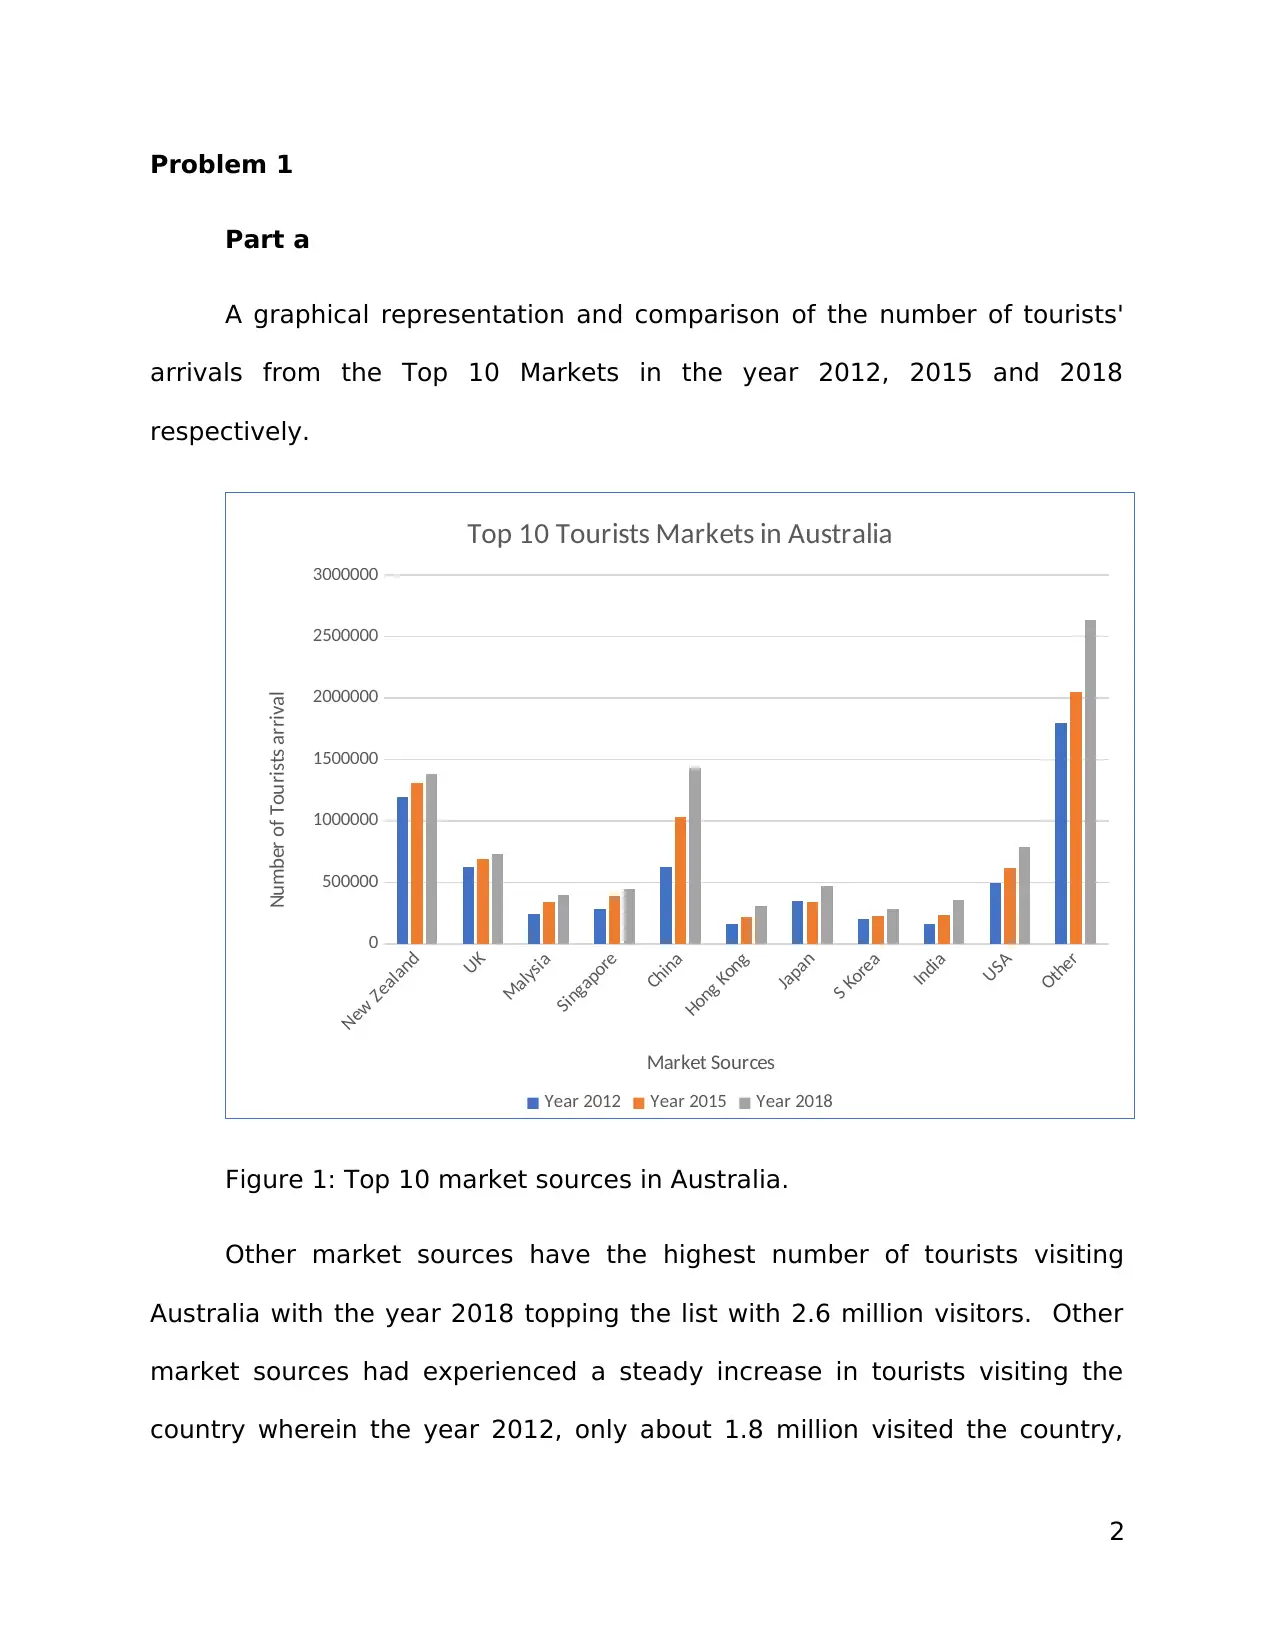
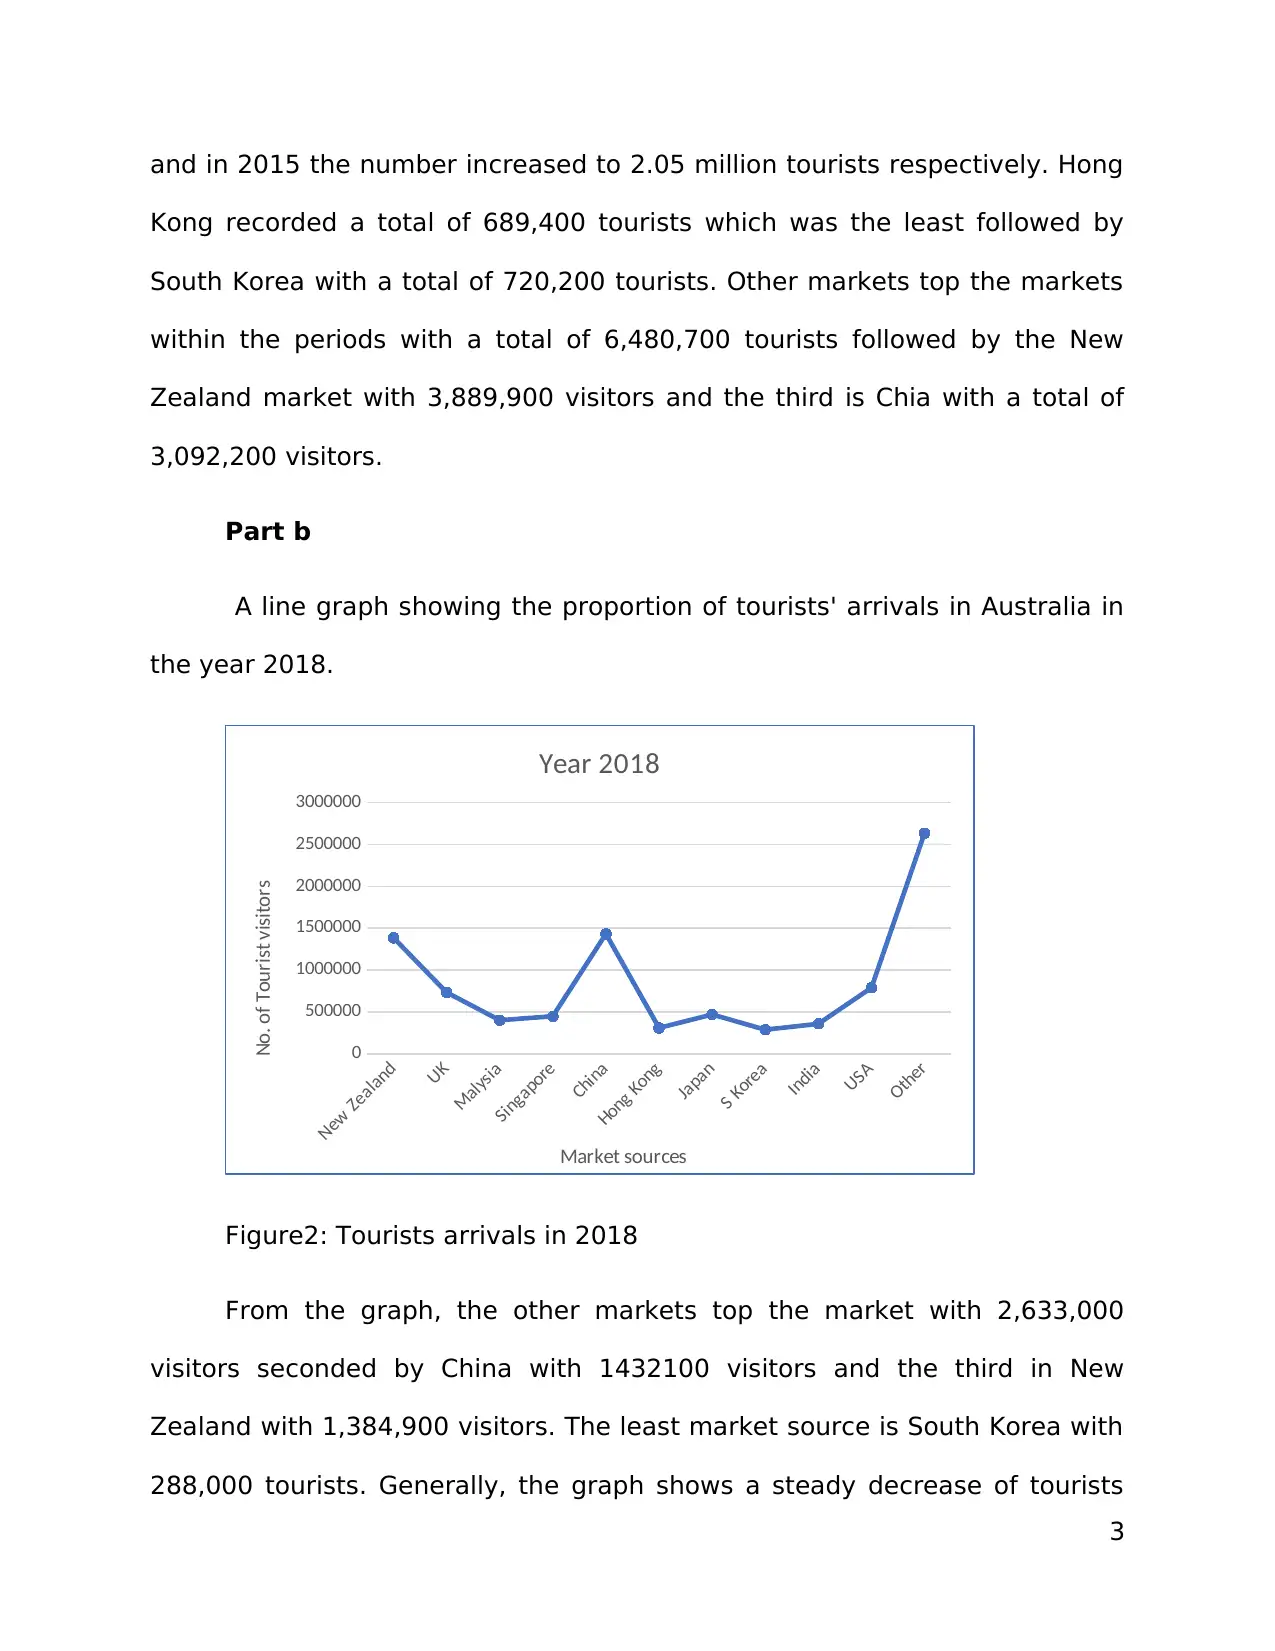
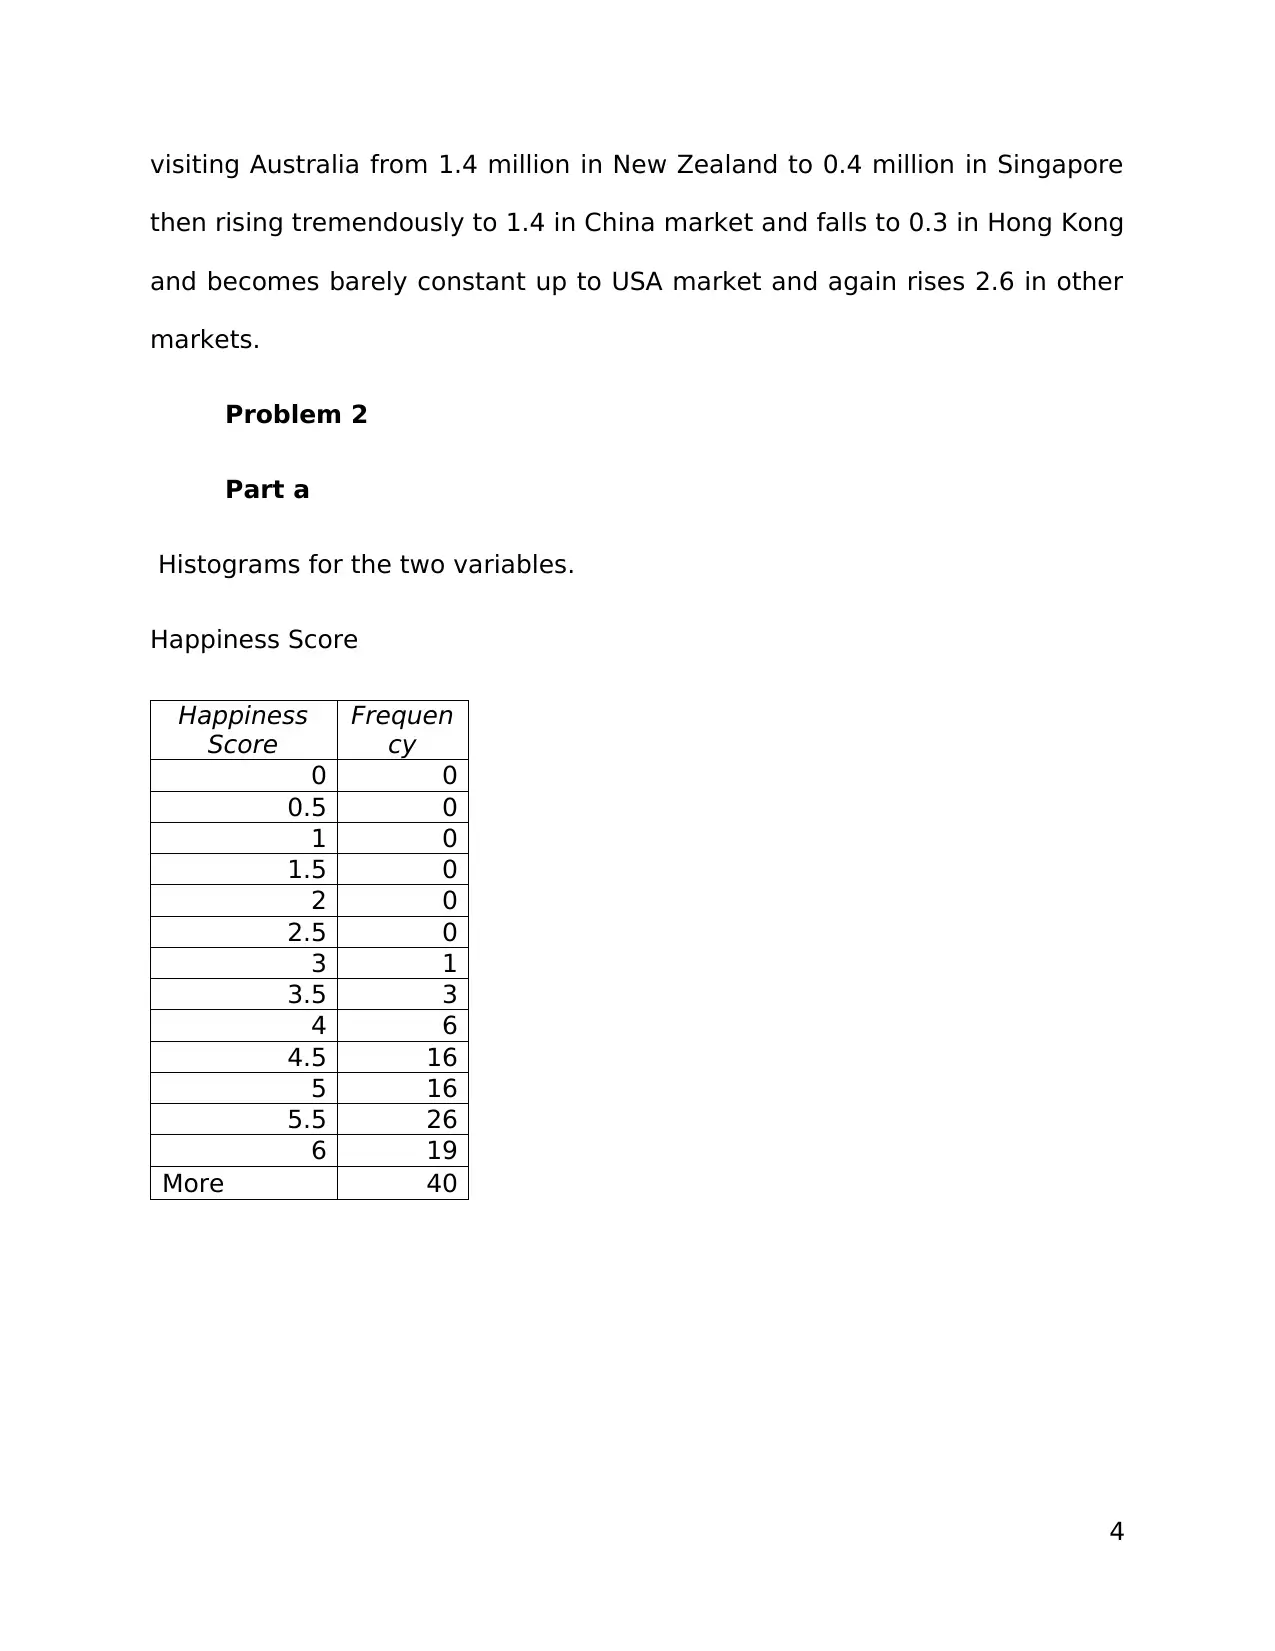
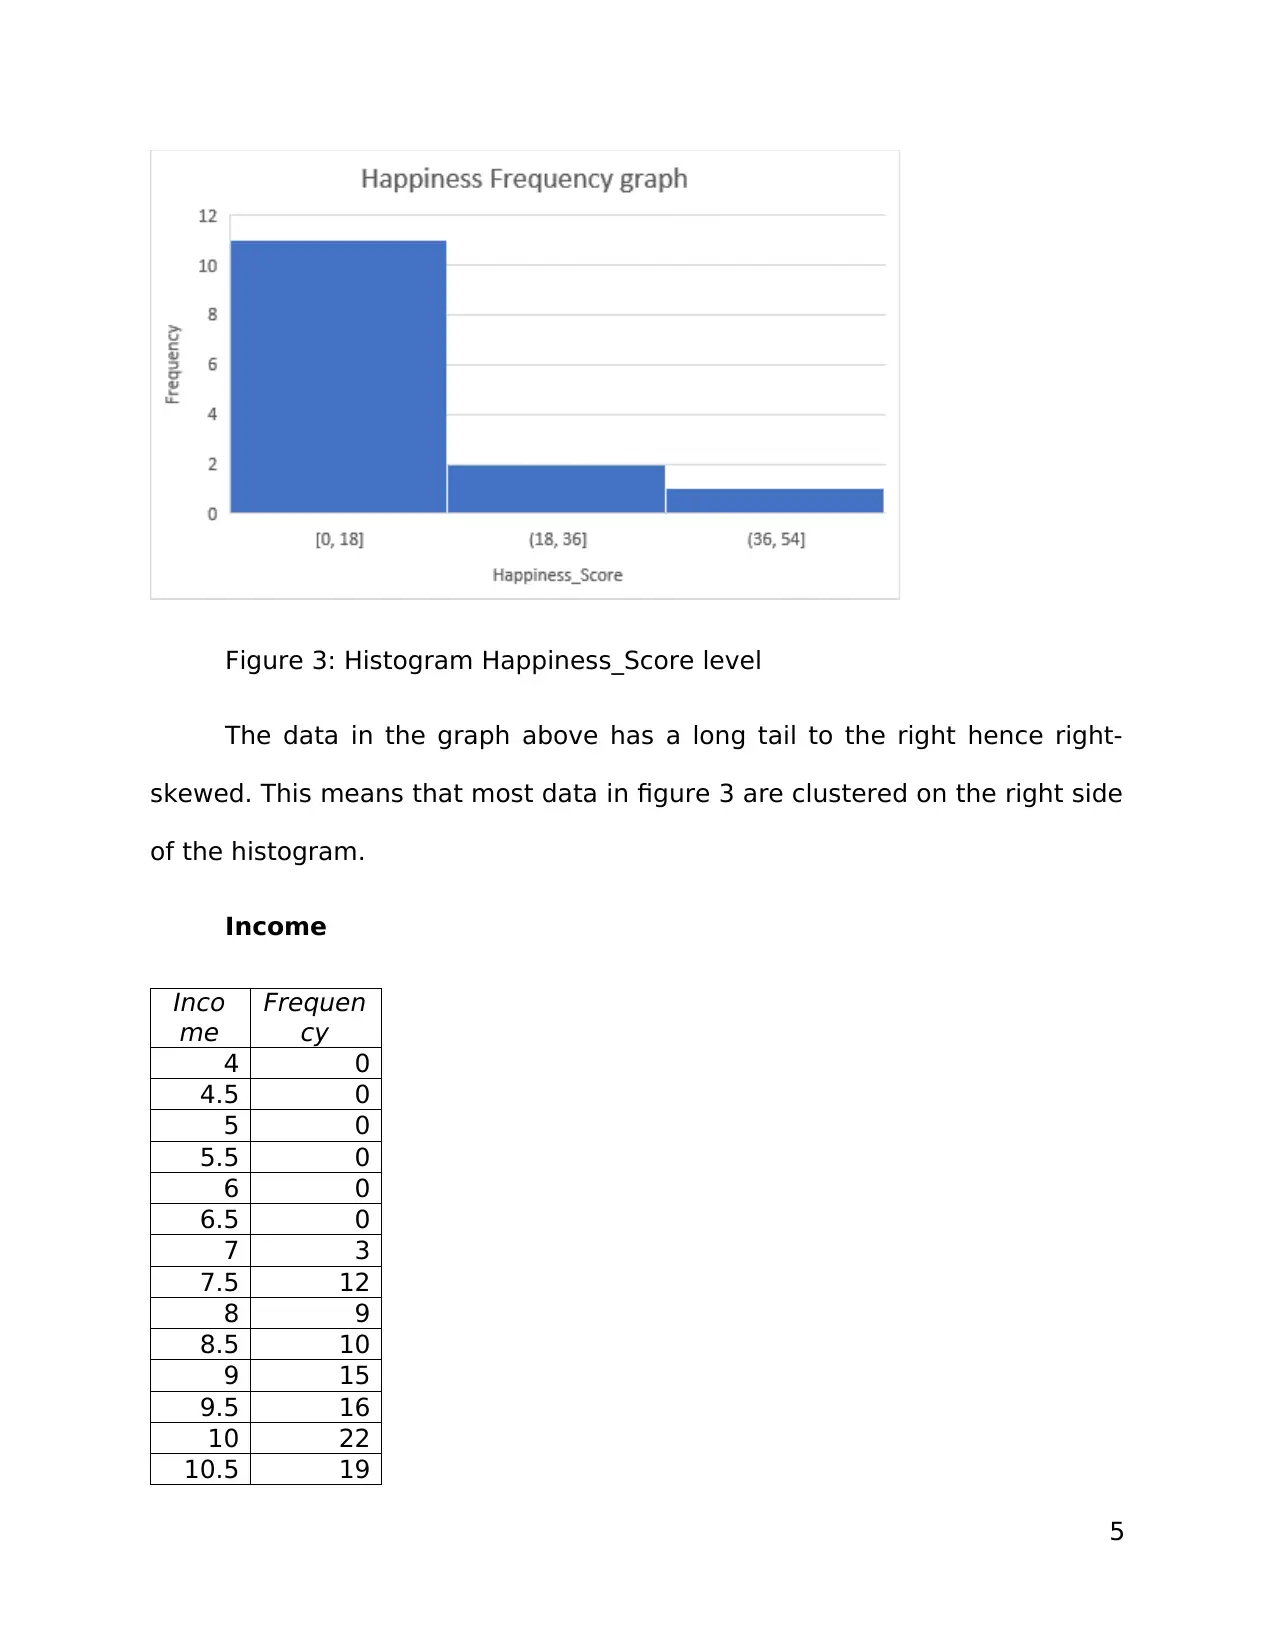
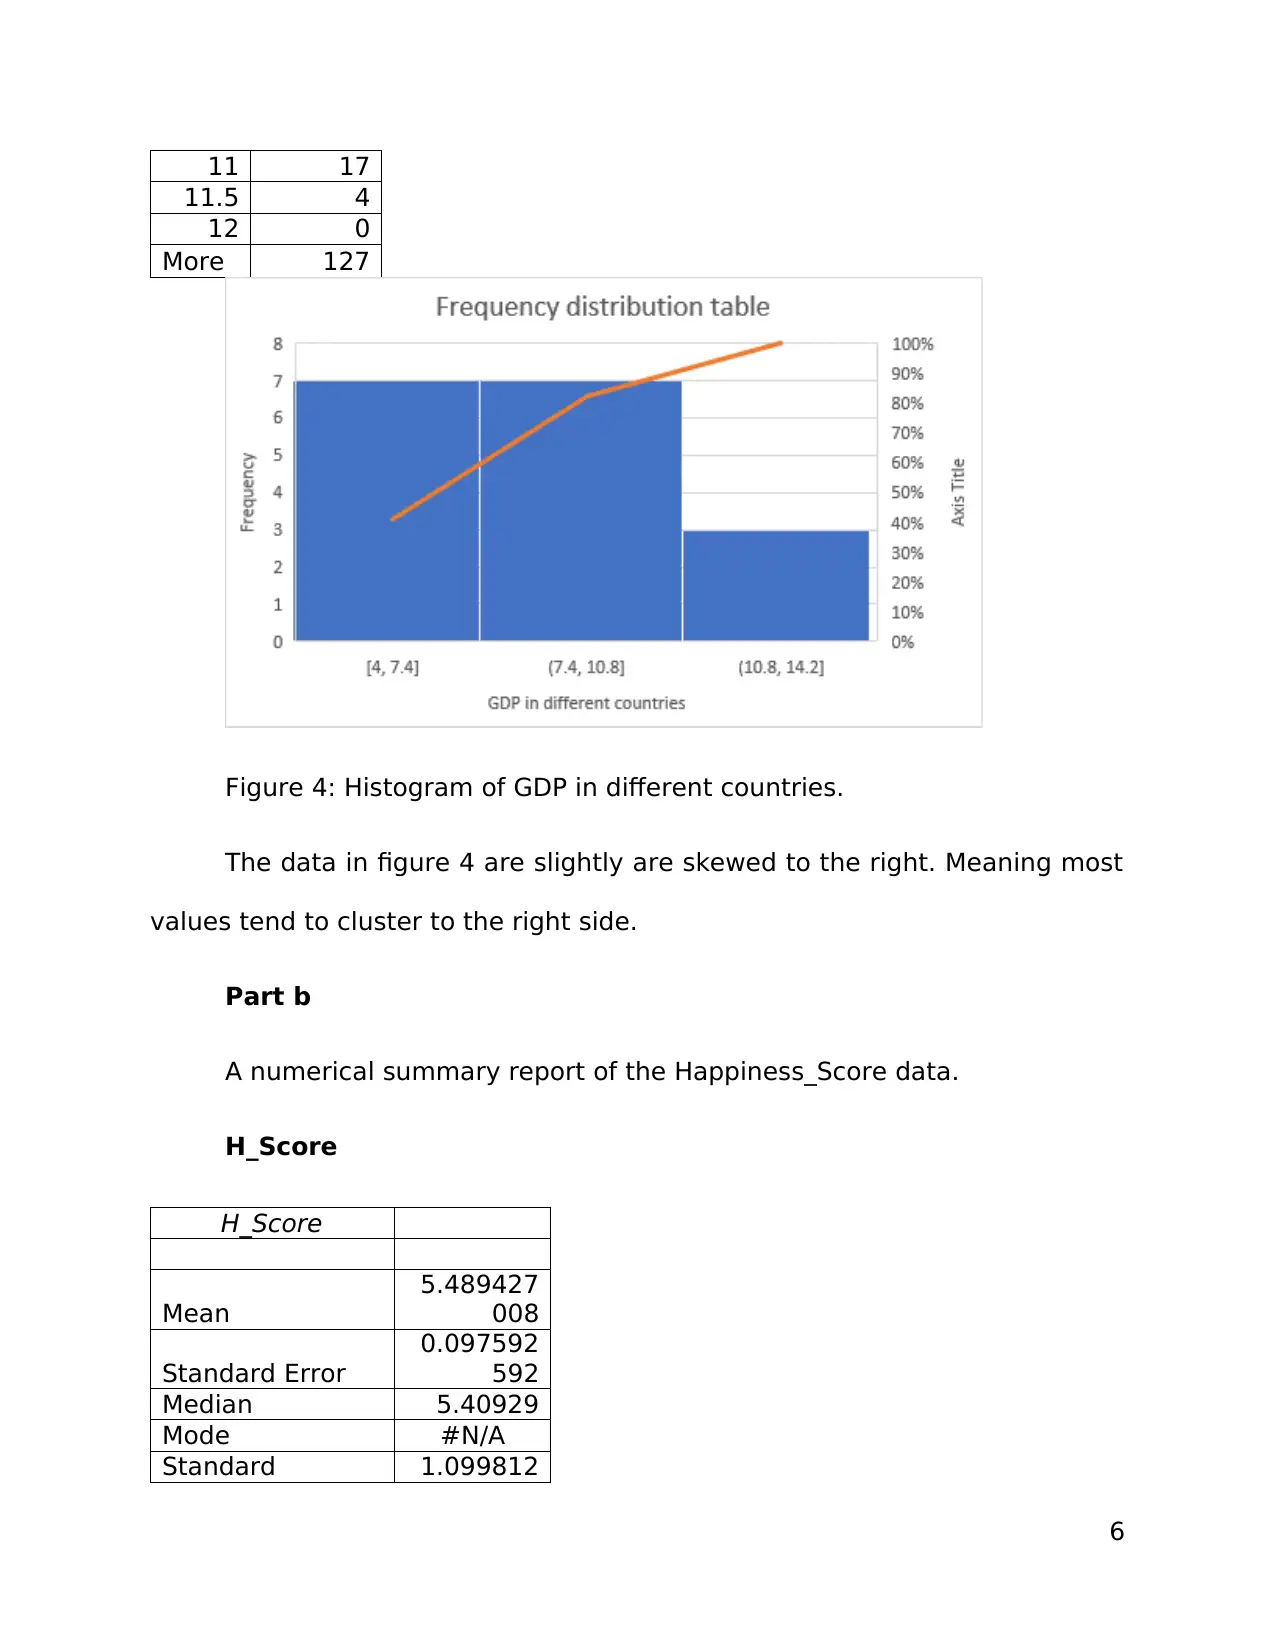
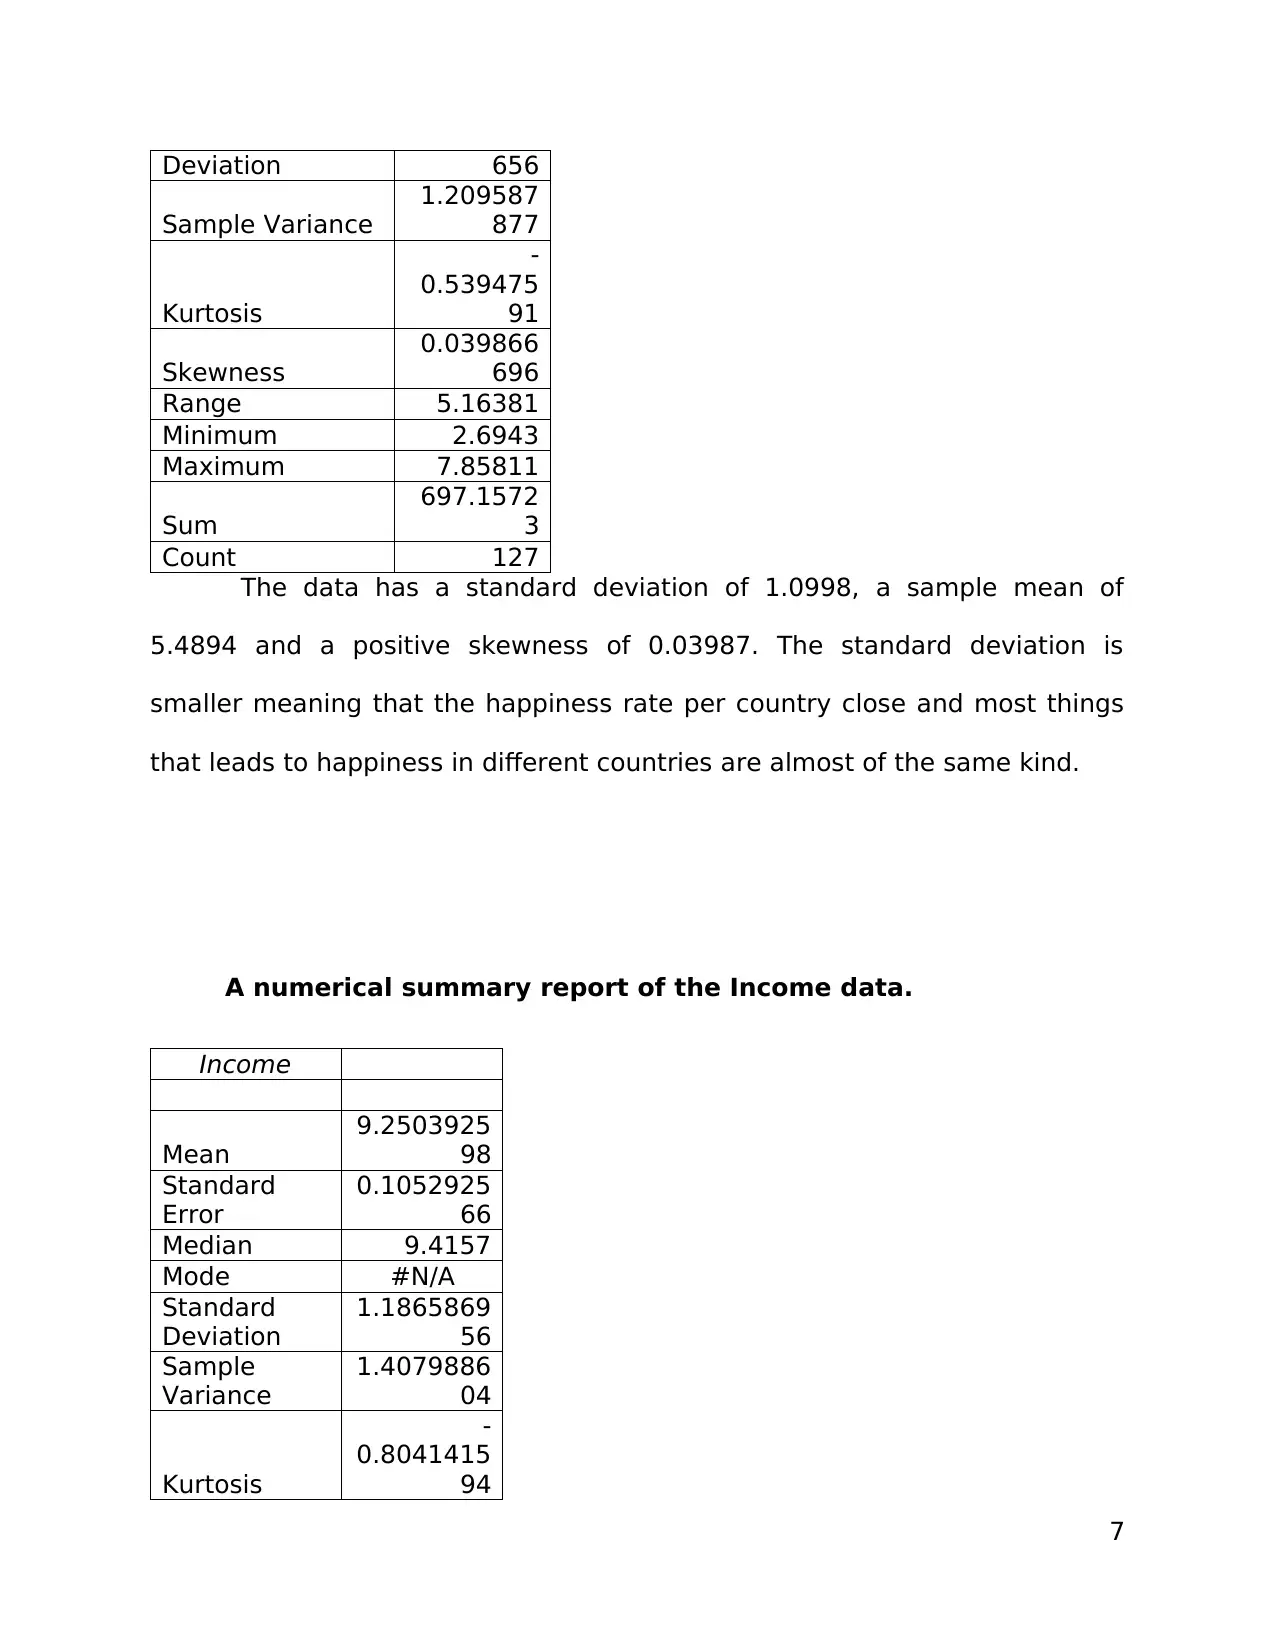
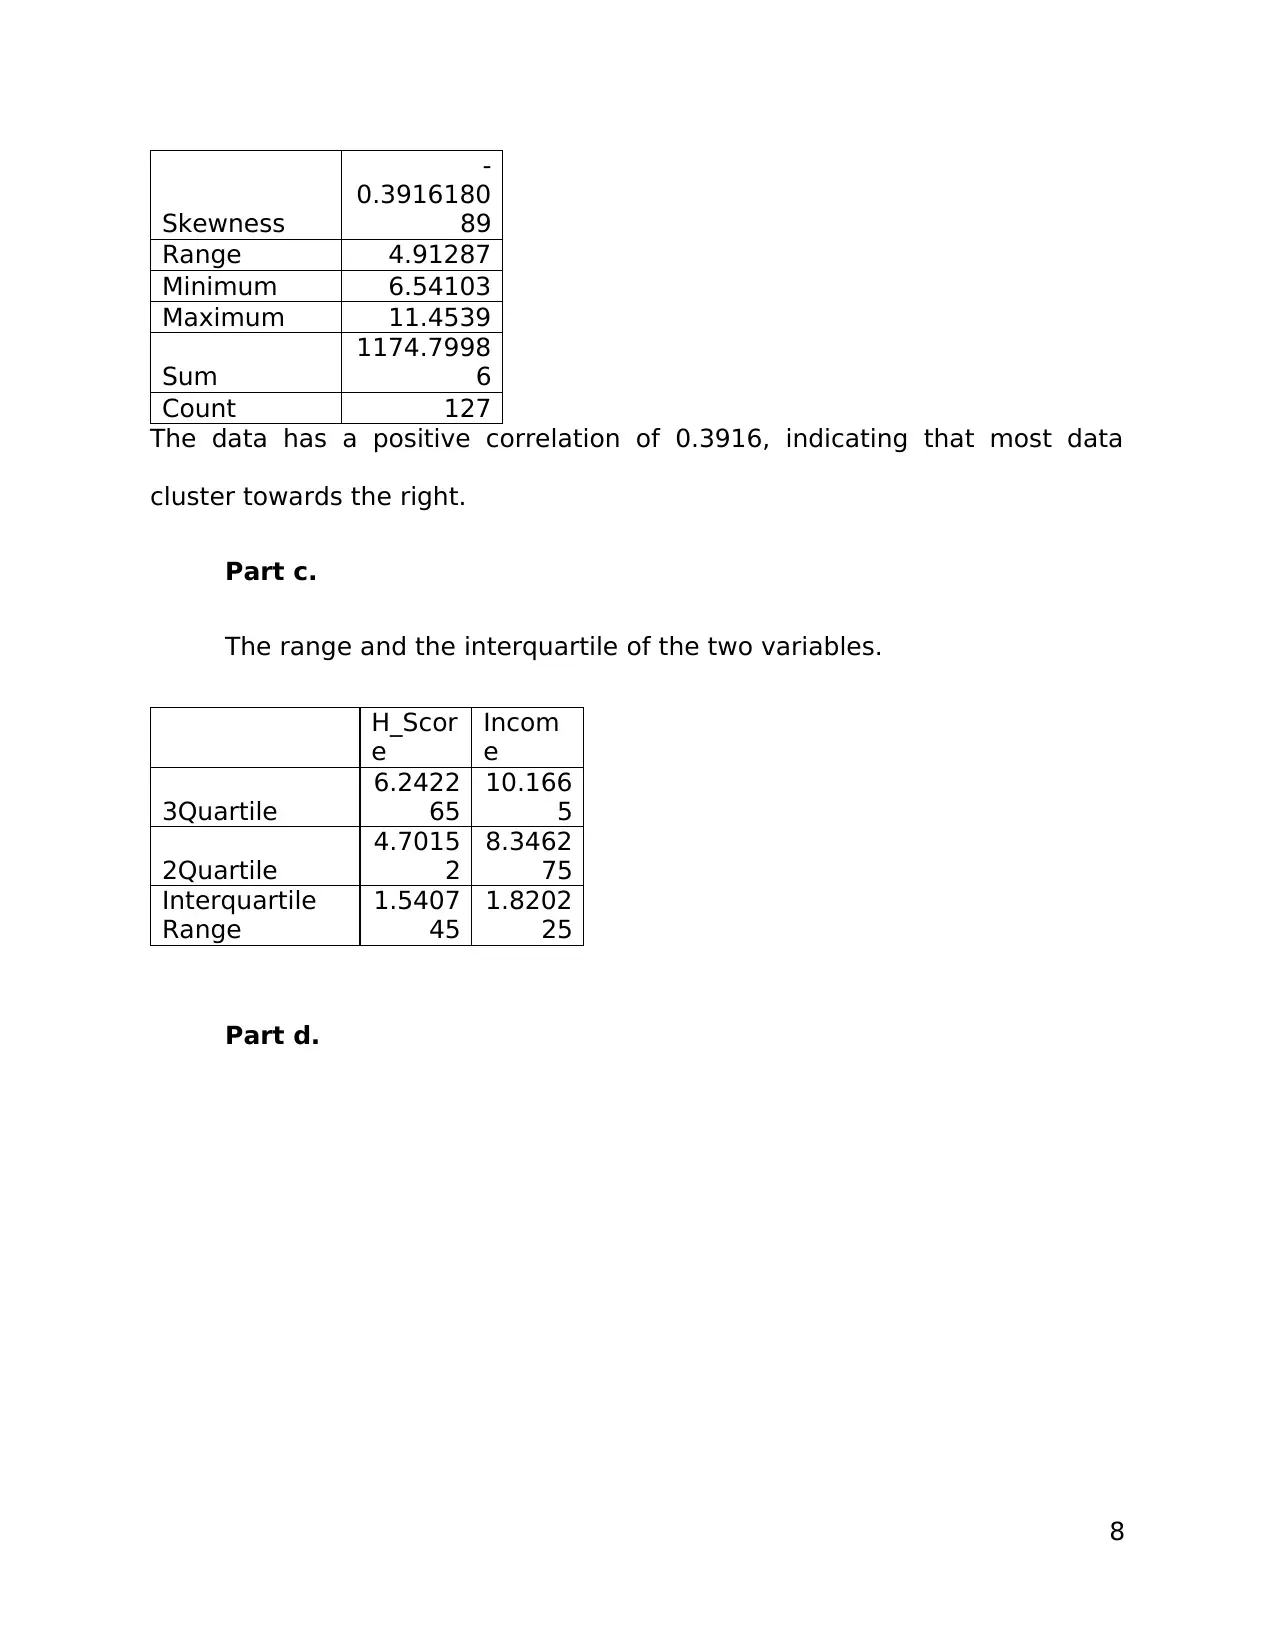
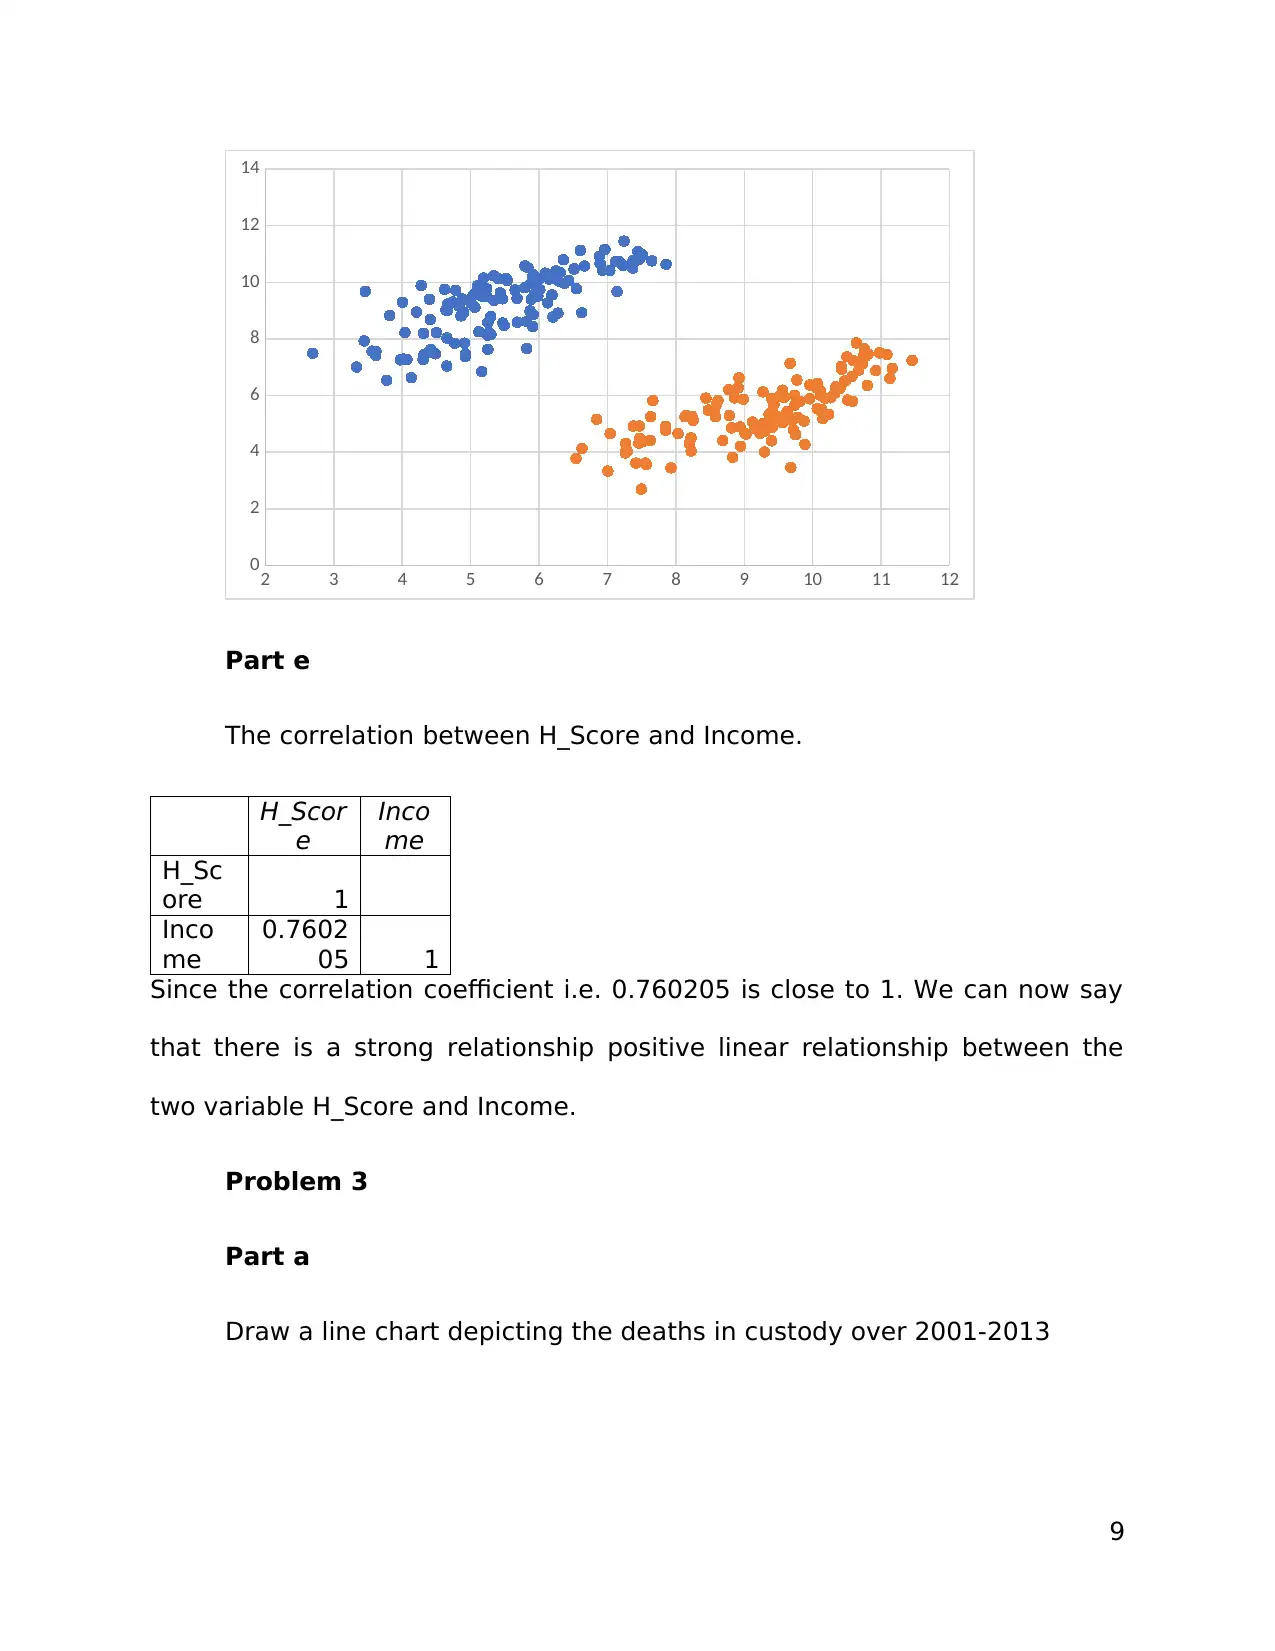
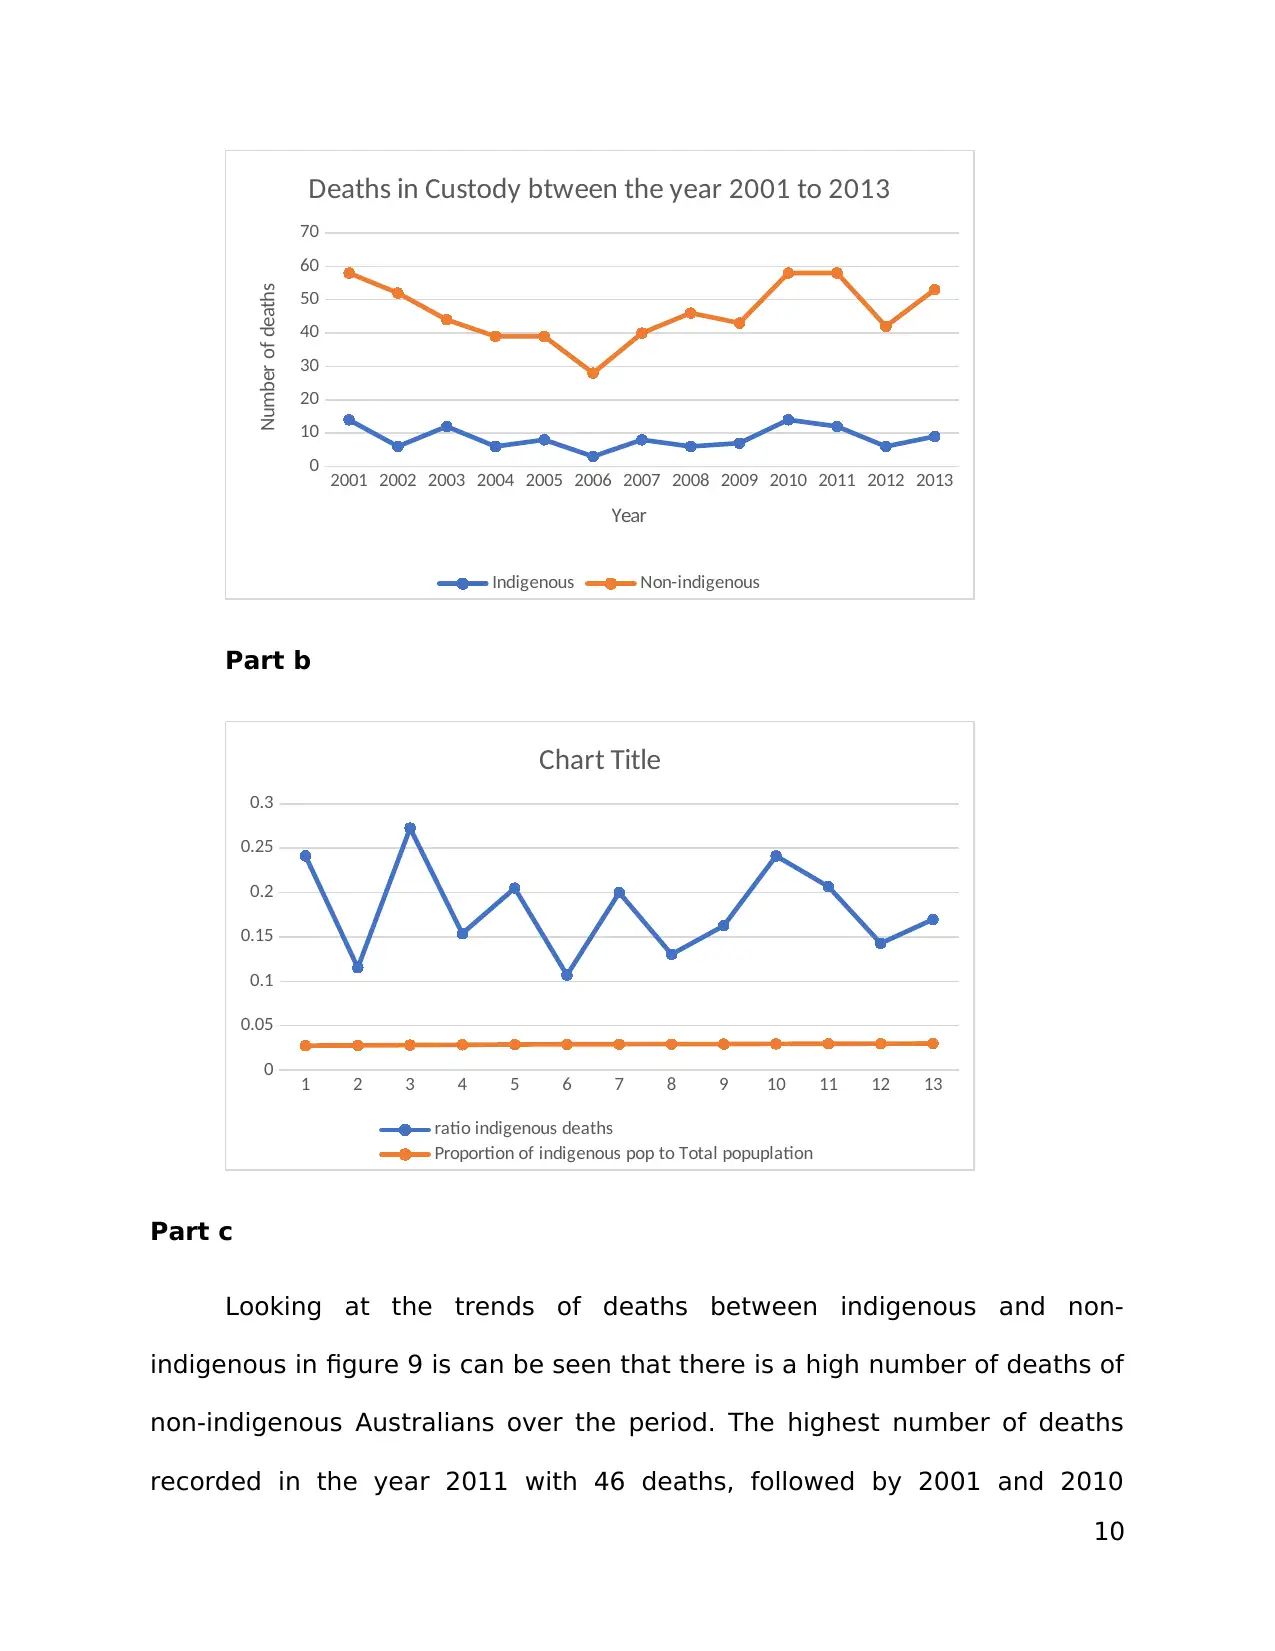
This document presents a comprehensive solution to a quantitative analysis assignment. It includes graphical representations and comparisons of tourist arrivals from various markets over different years, using bar graphs and line charts. The assignment also involves creating and analyzing histograms for happiness score and income data, calculating numerical summaries (mean, standard deviation, skewness, etc.), and determining interquartile ranges. Furthermore, it explores the correlation between happiness score and income. The solution also presents line charts depicting deaths in custody, analyzing trends between indigenous and non-indigenous populations, and calculating probabilities using normal distribution and z-scores. The assignment covers various statistical concepts and data analysis techniques, providing a detailed analysis of the given datasets and answering specific questions related to the data.
1 out of 12
Your All-in-One AI-Powered Toolkit for Academic Success.
+13062052269
info@desklib.com
Available 24*7 on WhatsApp / Email
![[object Object]](/_next/static/media/star-bottom.7253800d.svg)
Copyright © 2020–2026 A2Z Services. All Rights Reserved. Developed and managed by ZUCOL.