Investor Perception of Auditor's Fraud Detection Abilities

Verified

Added on  2023/01/20

|21
|3489
|83
Report
AI Summary
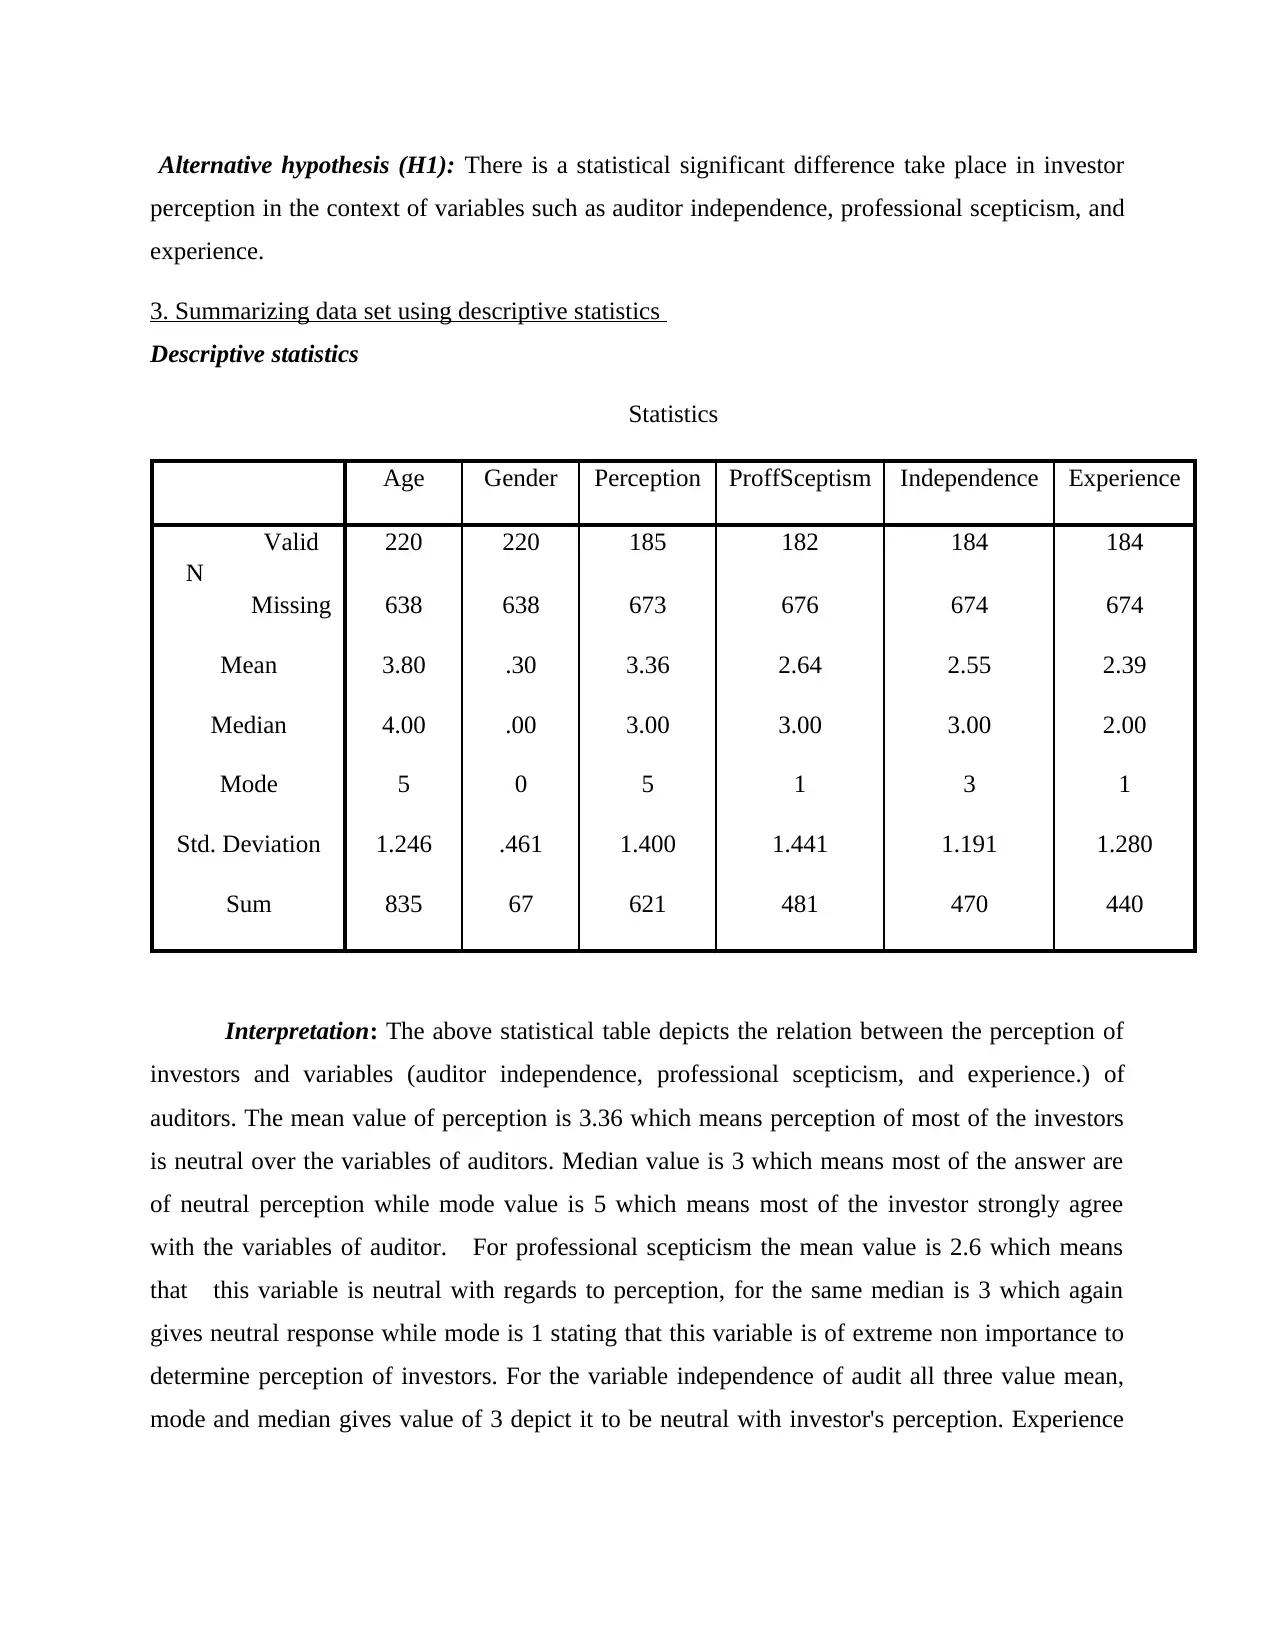
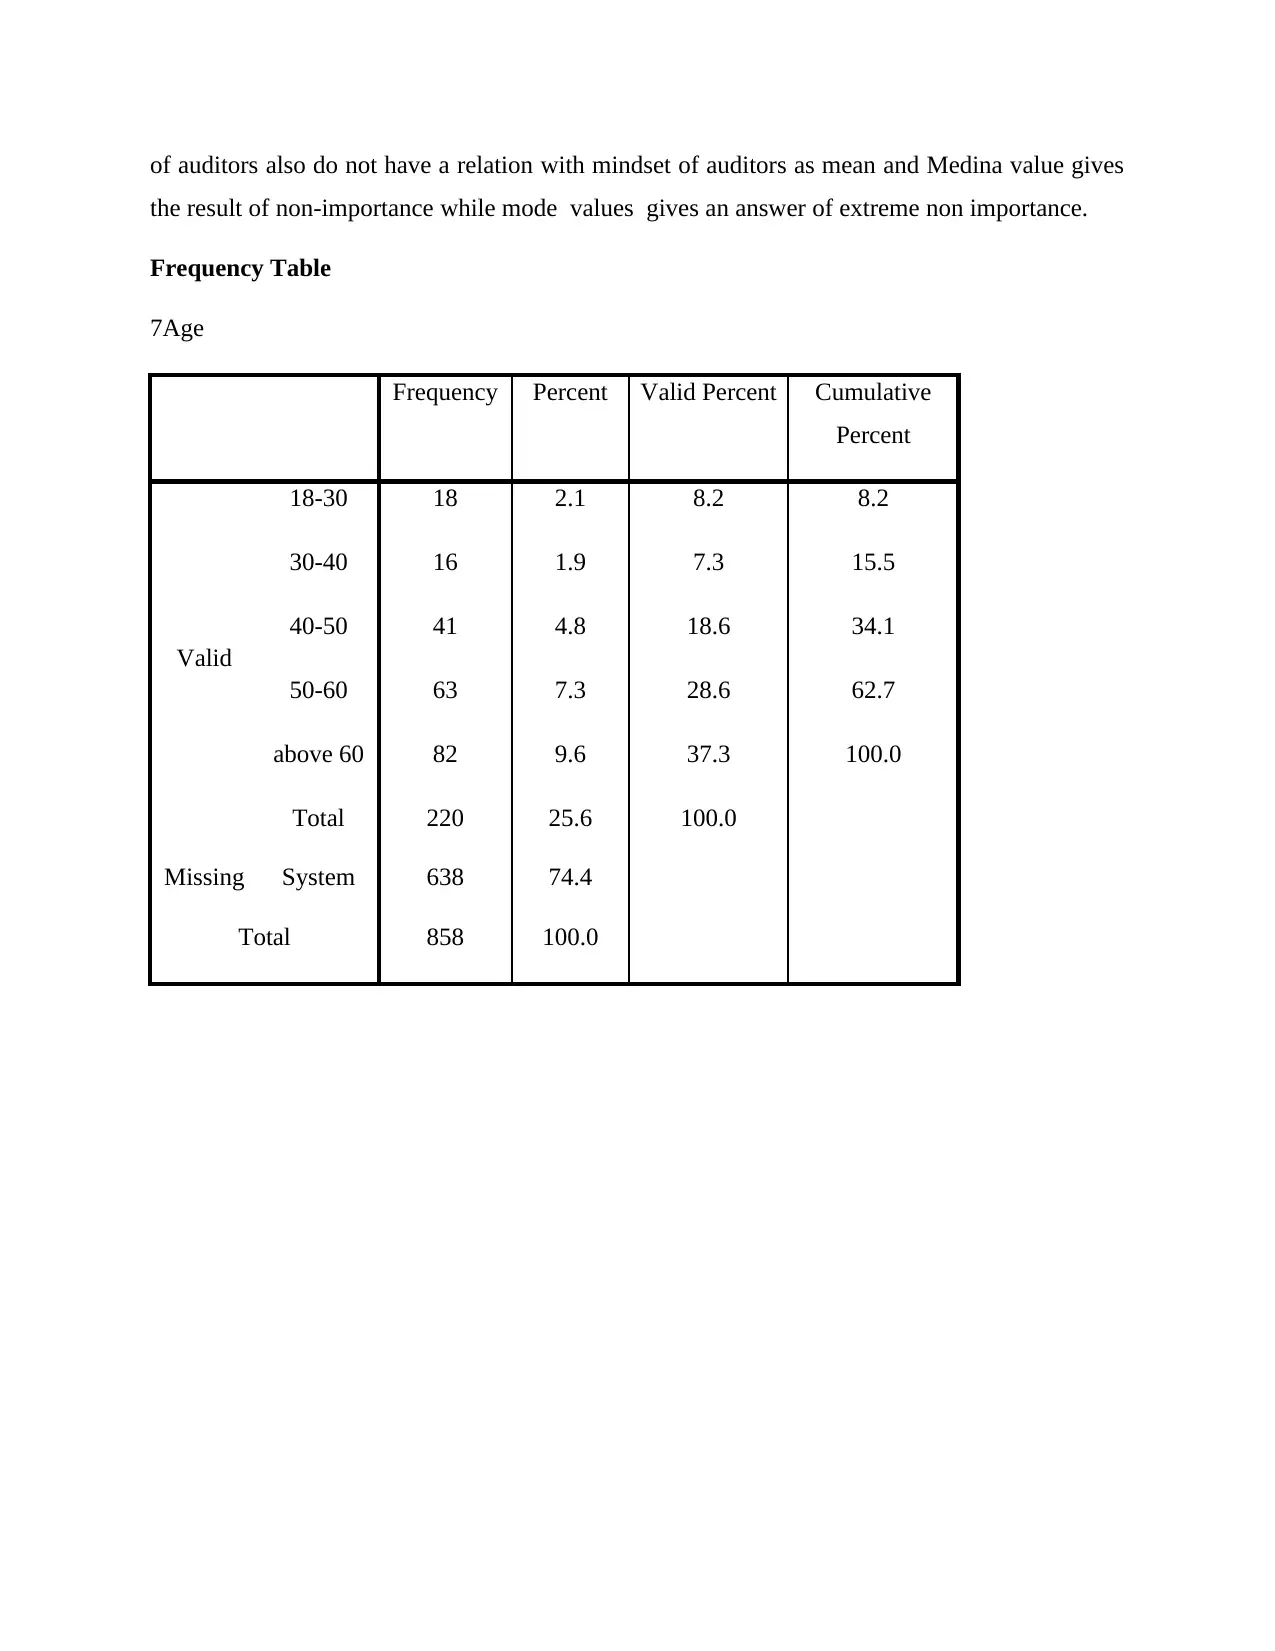
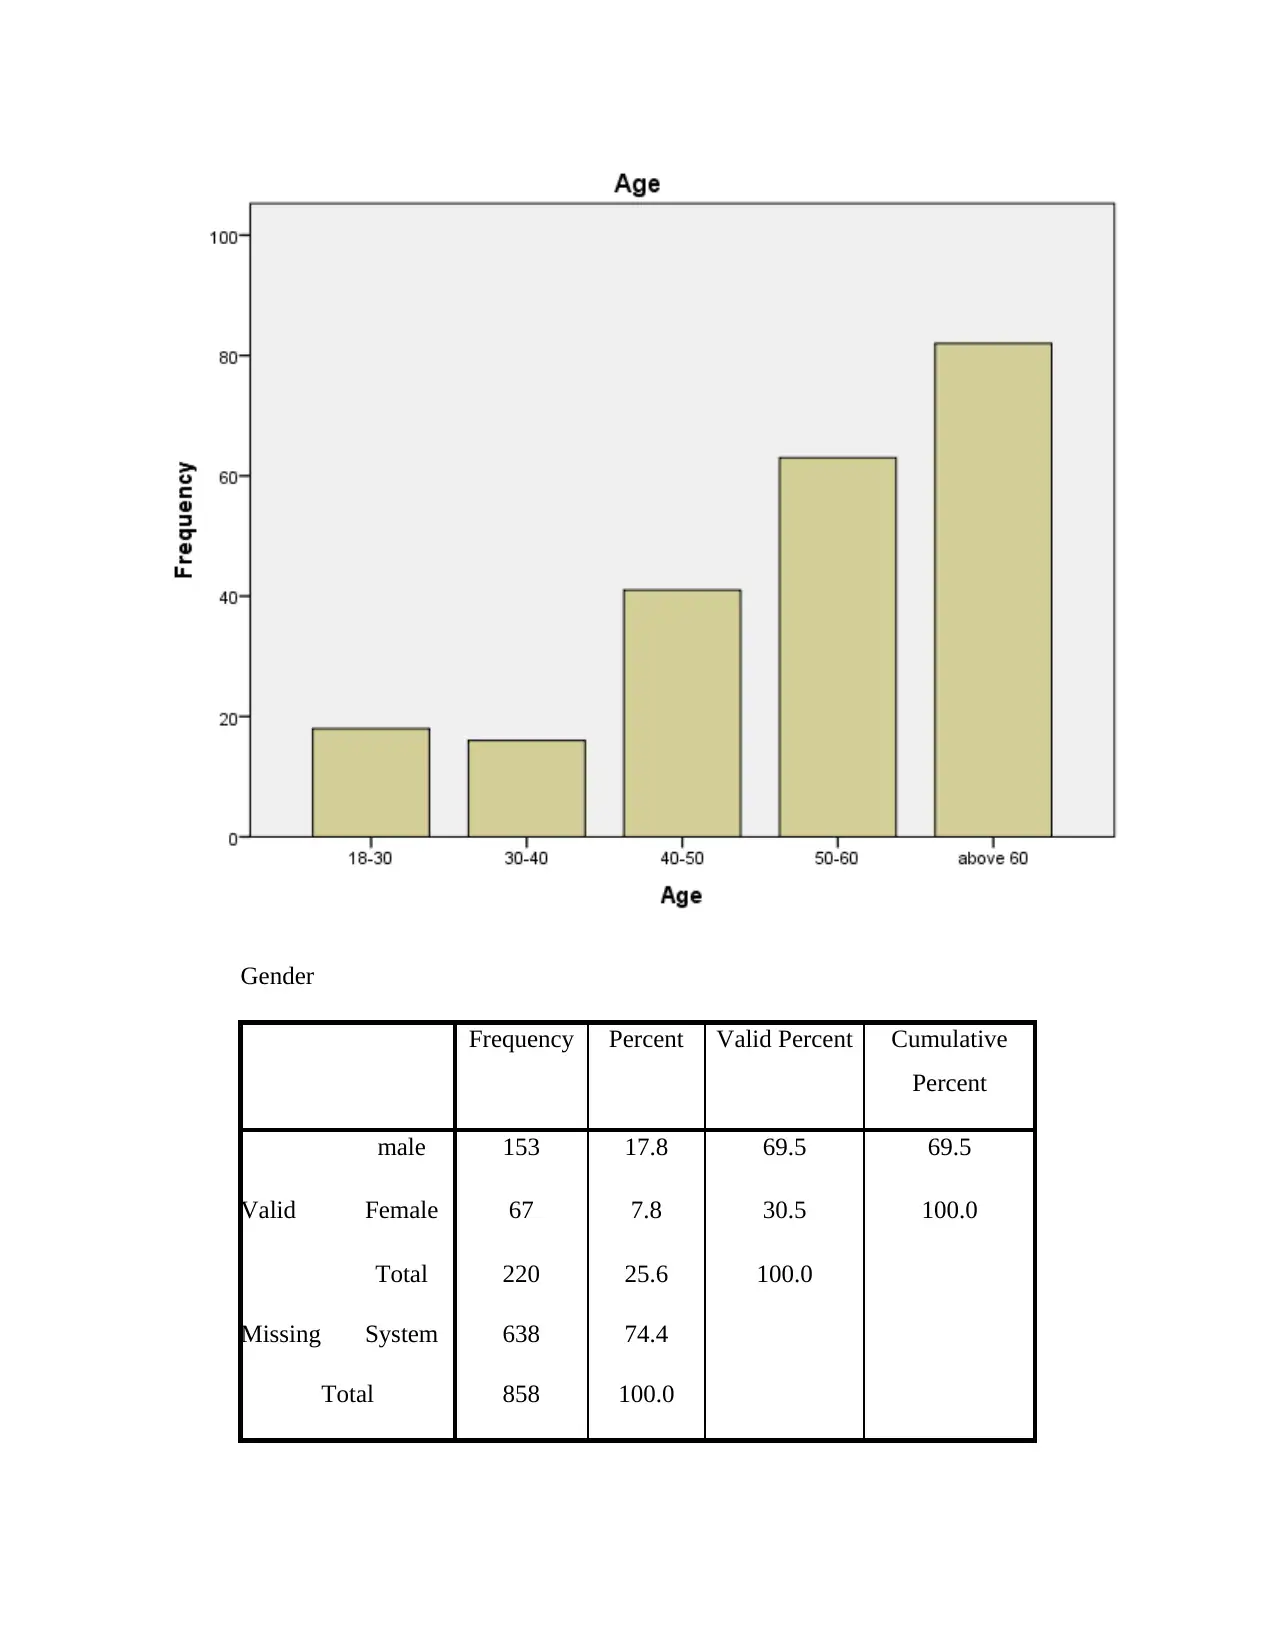
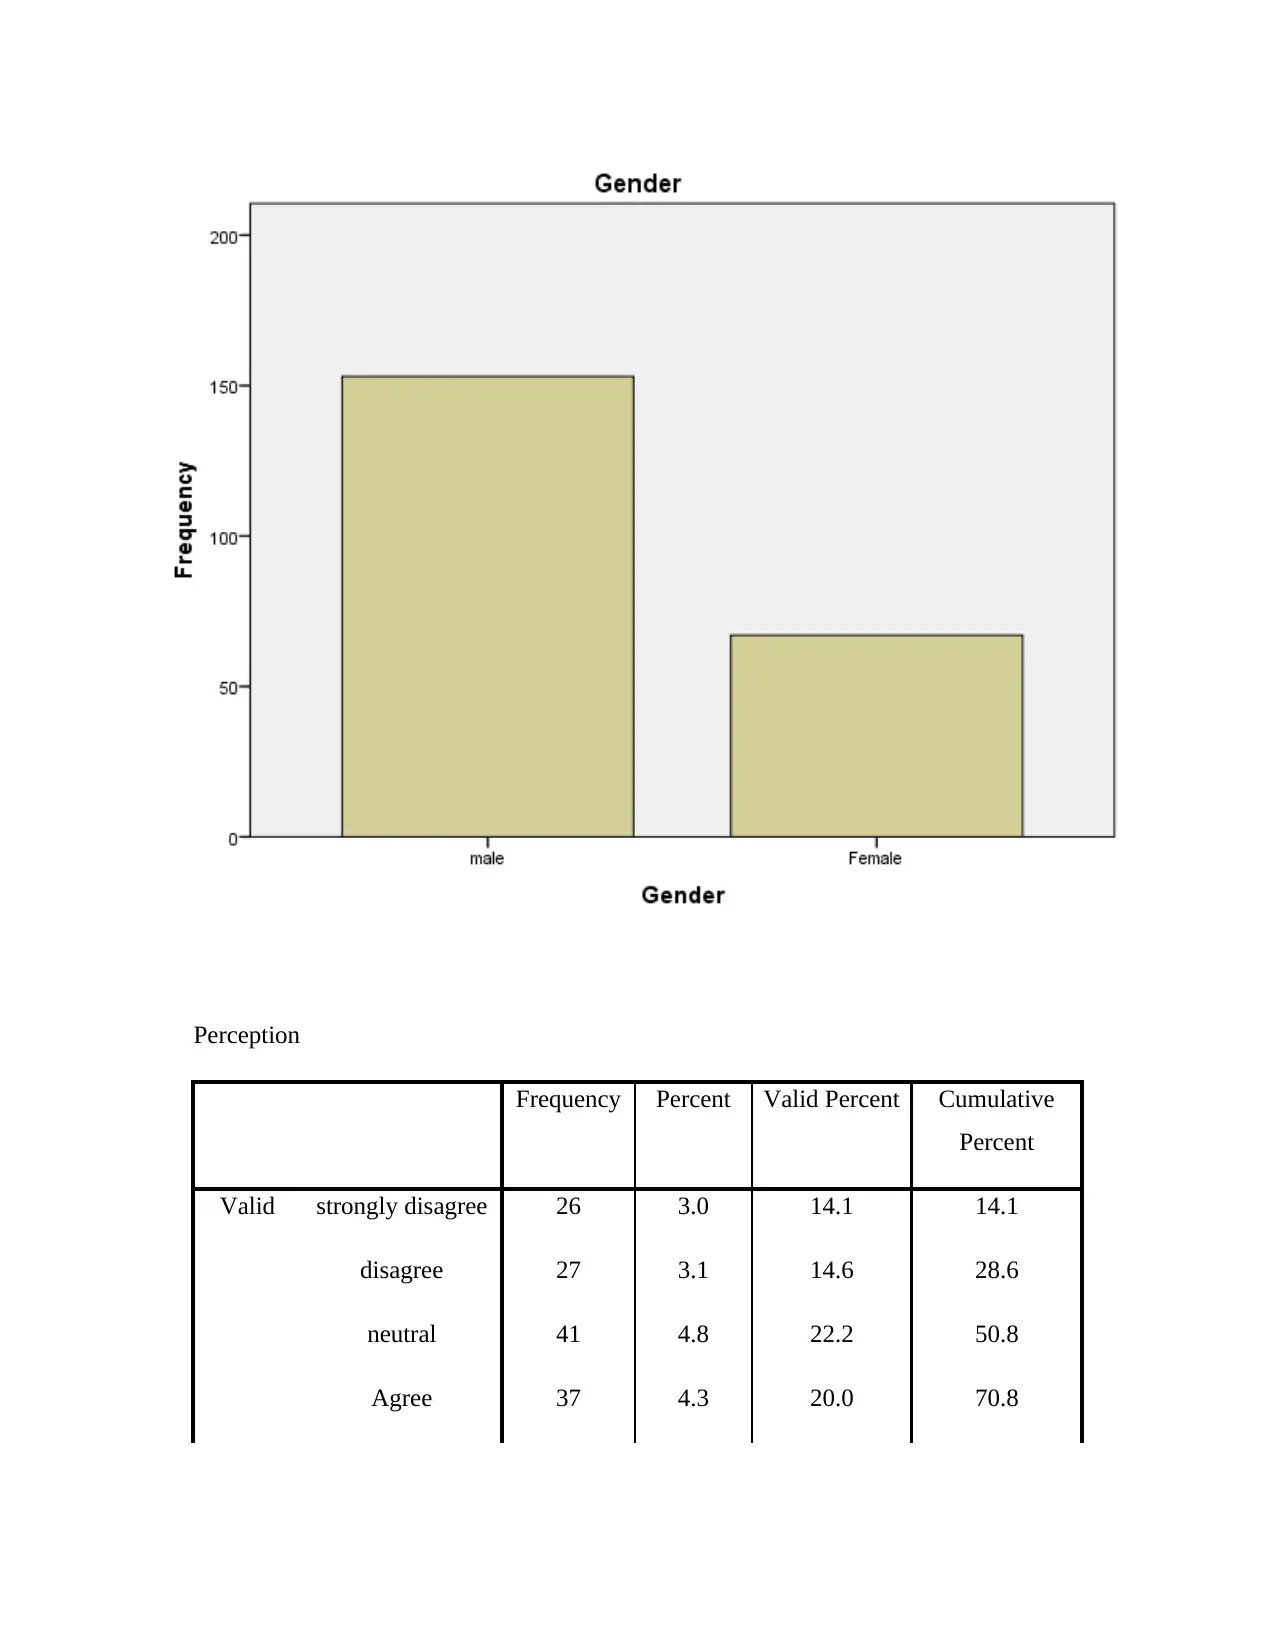
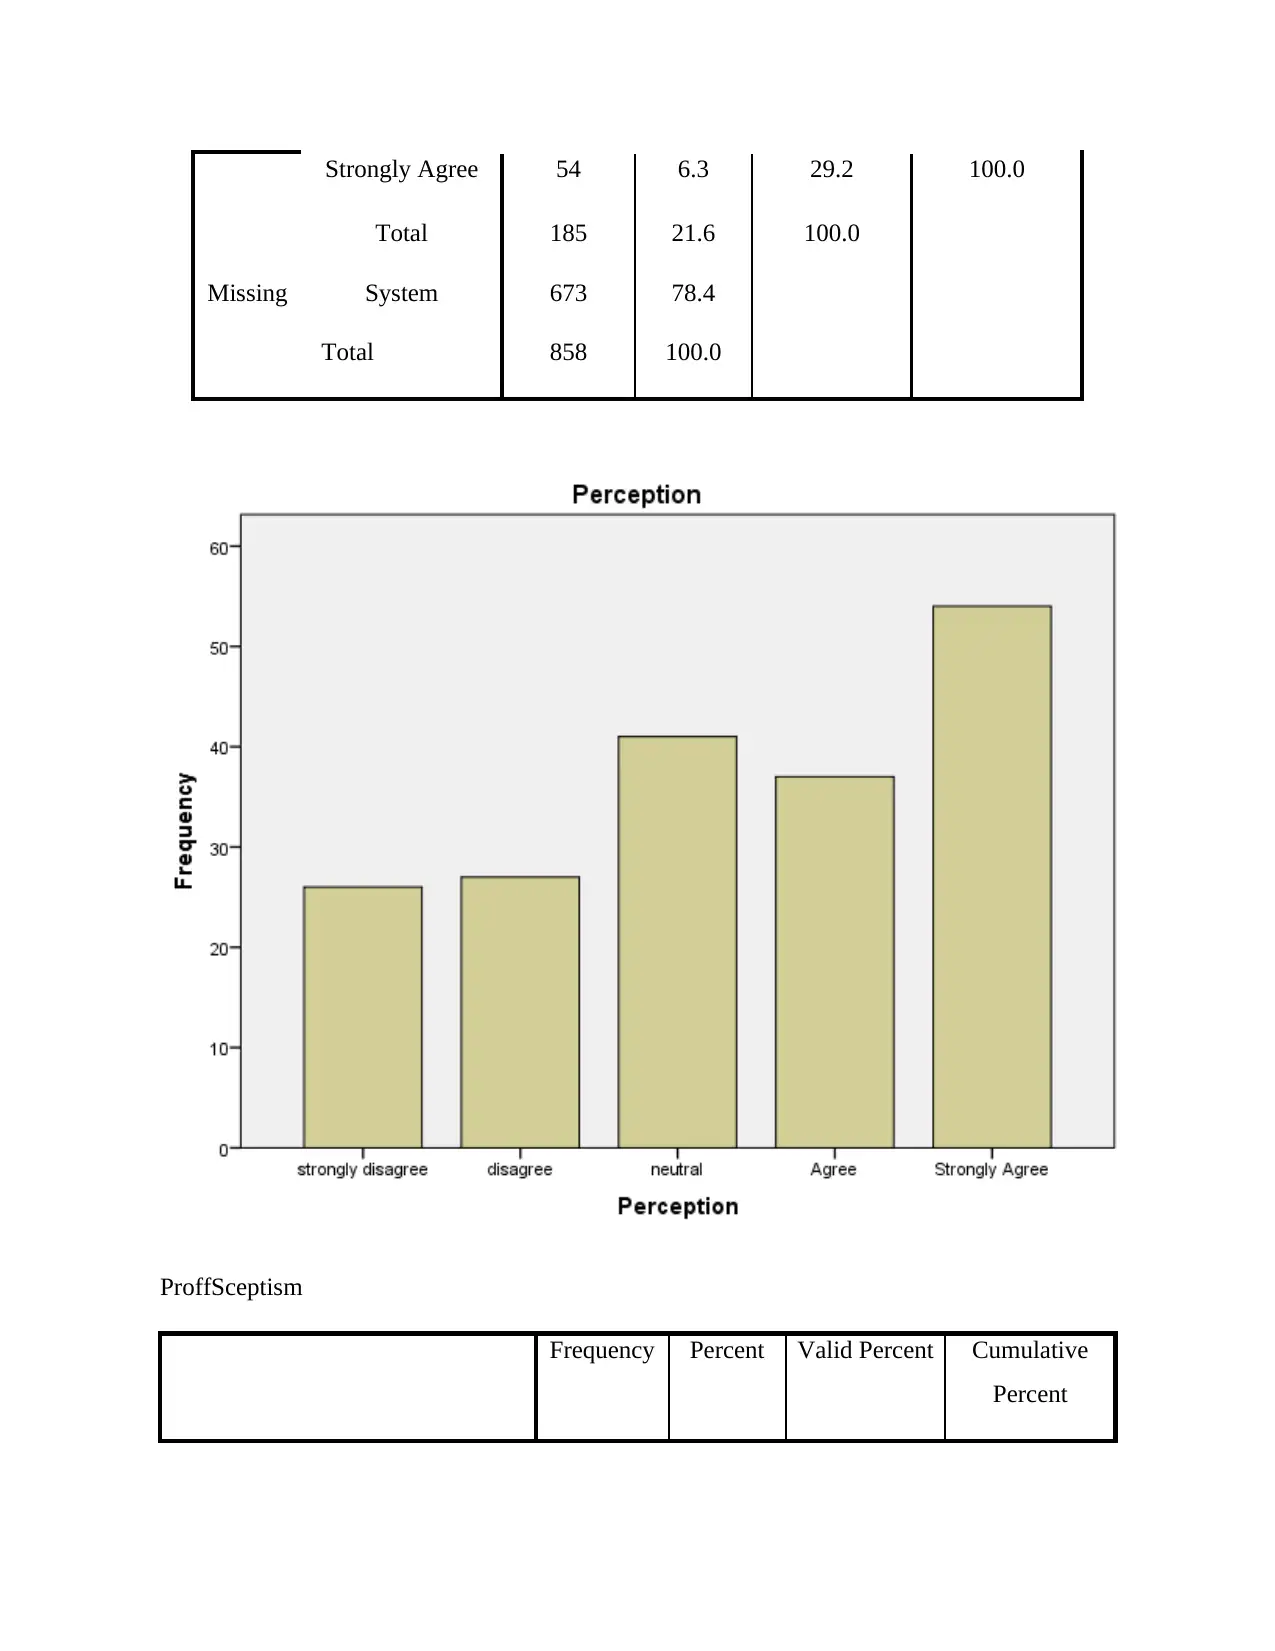
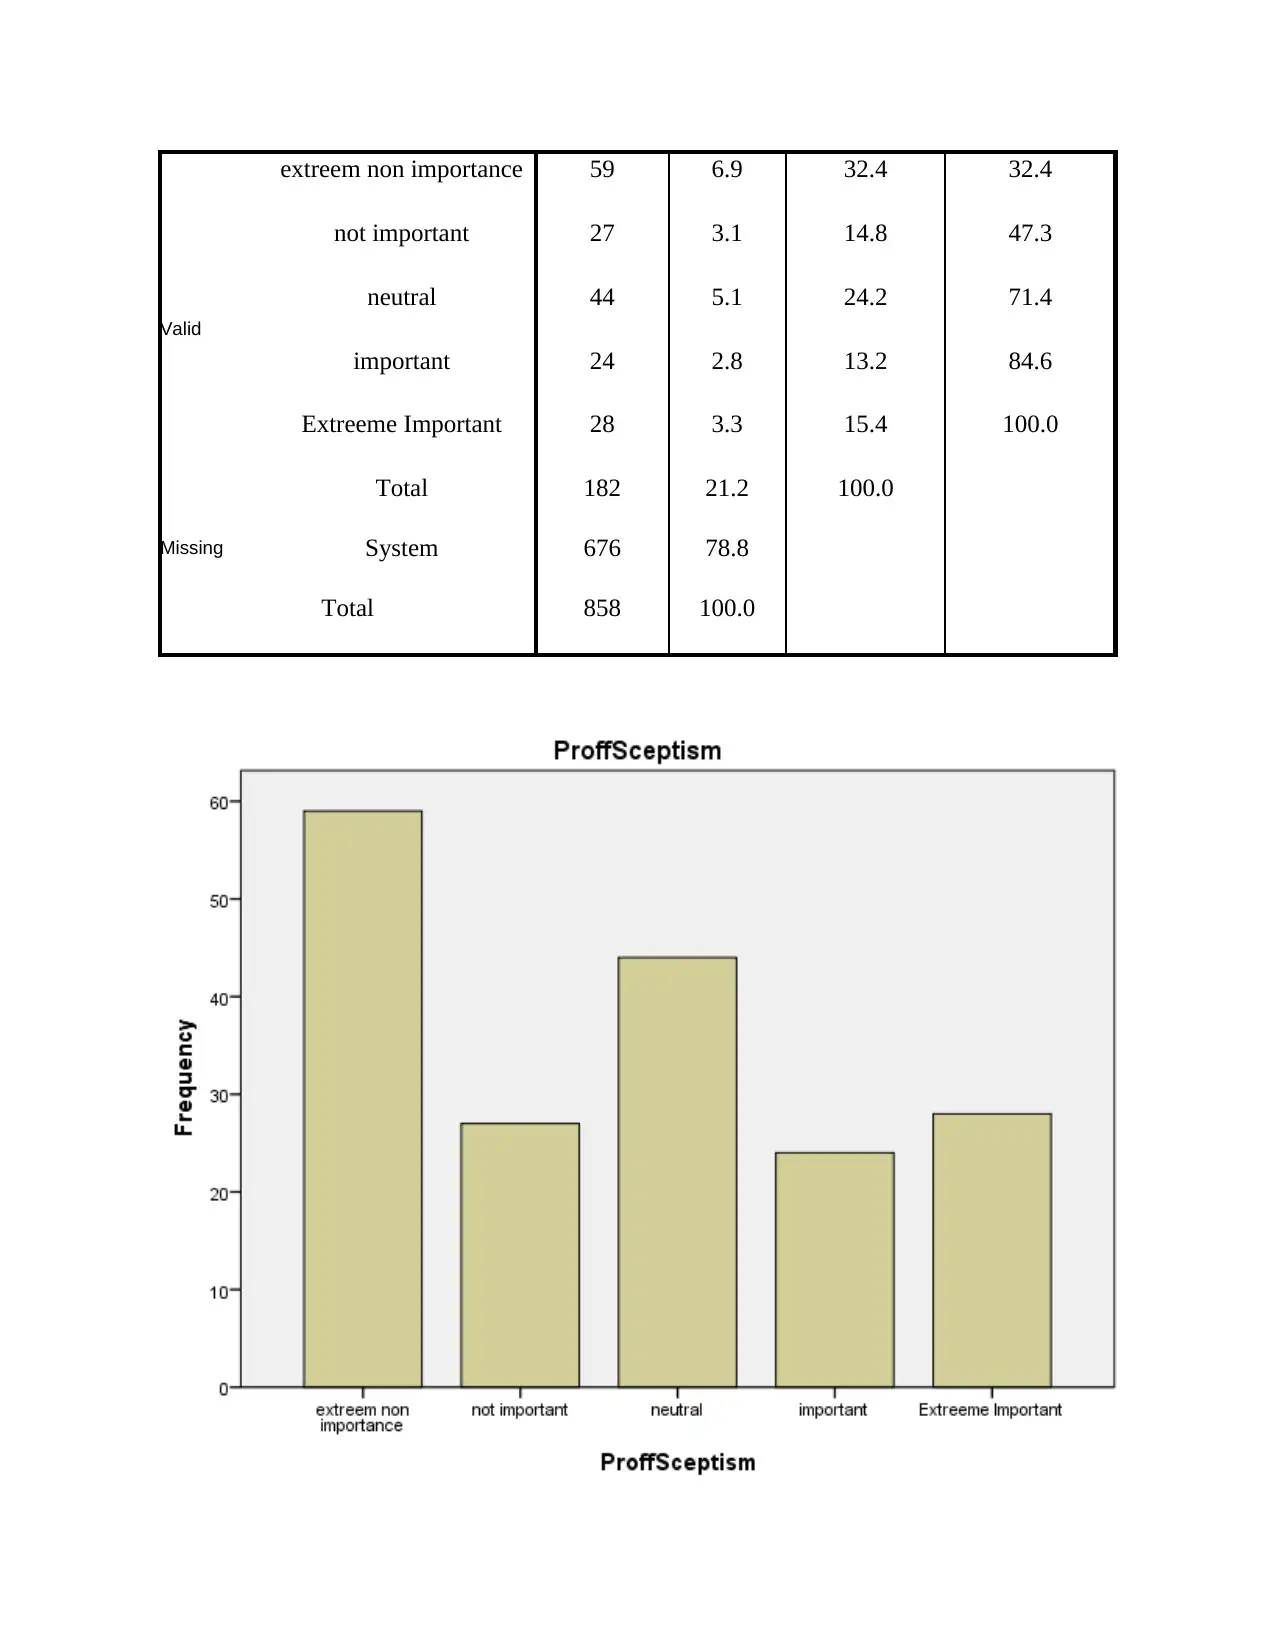
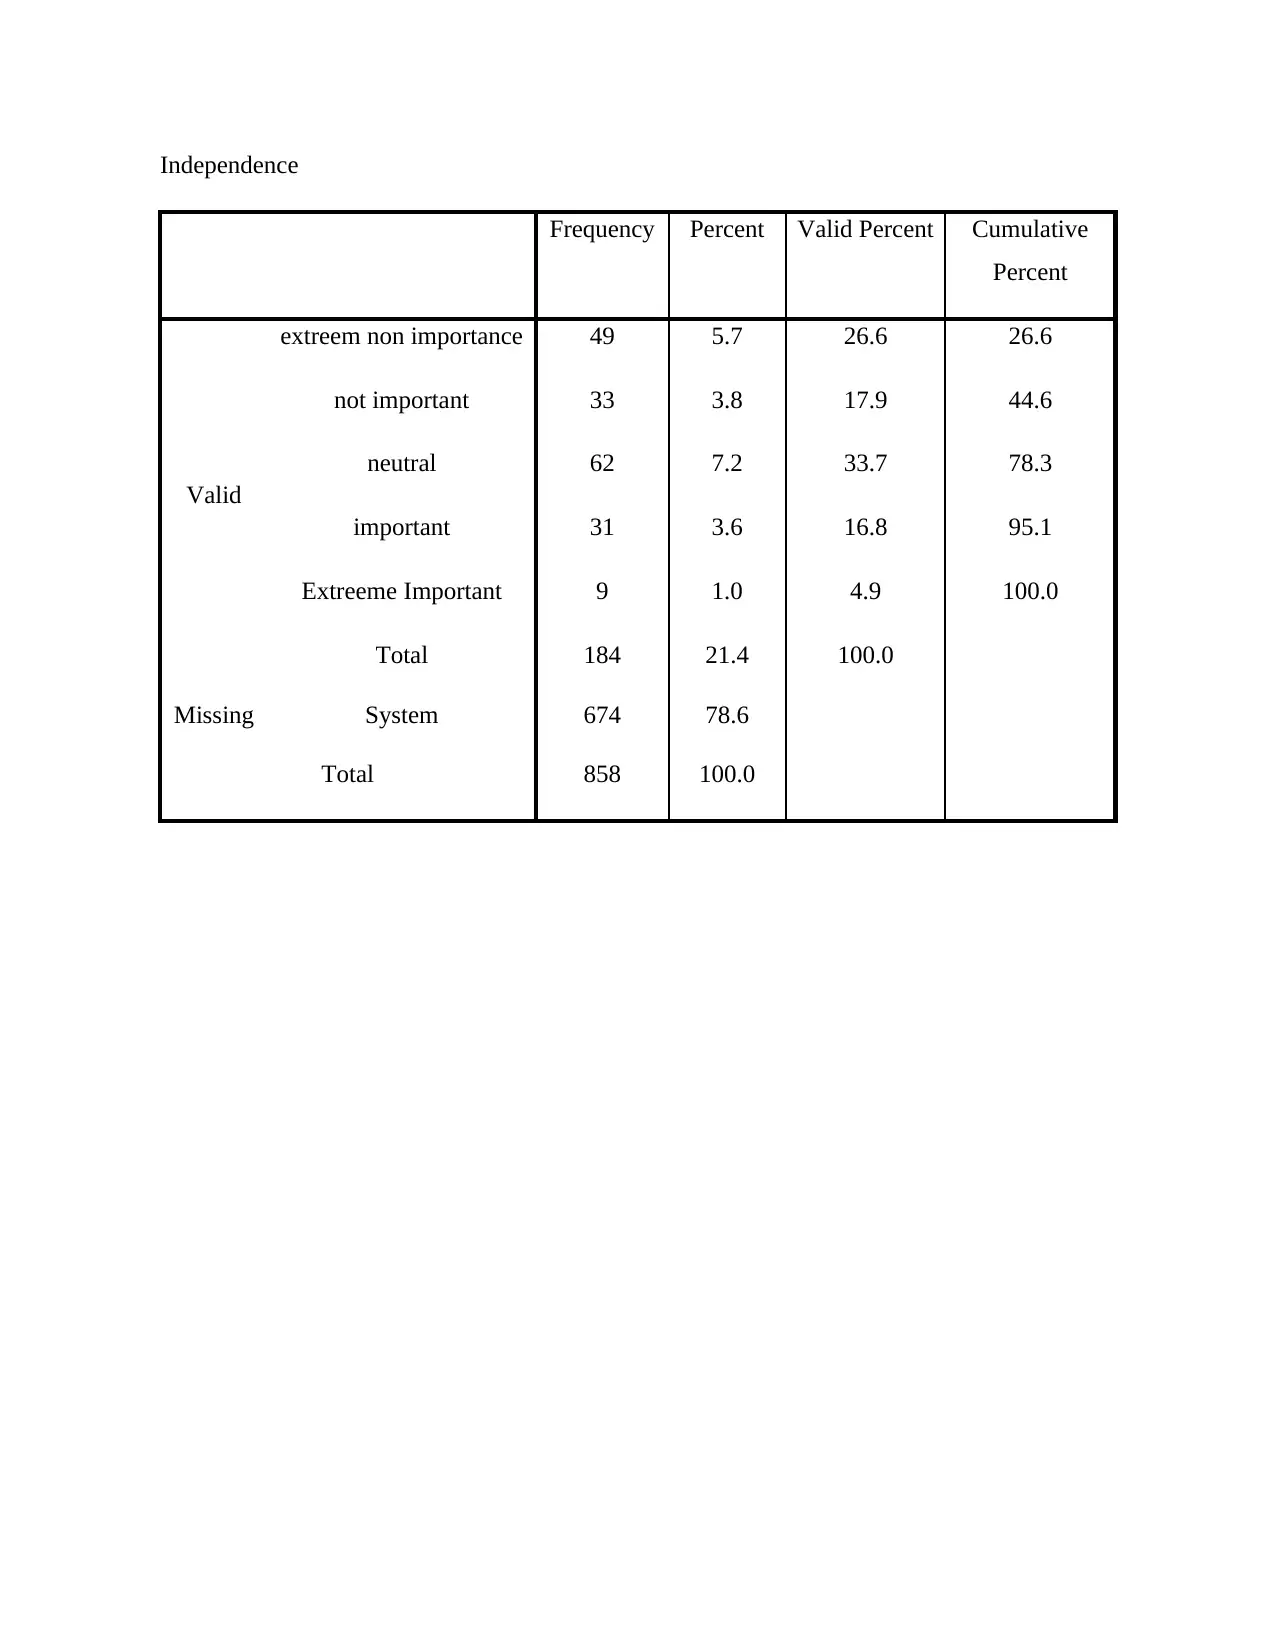
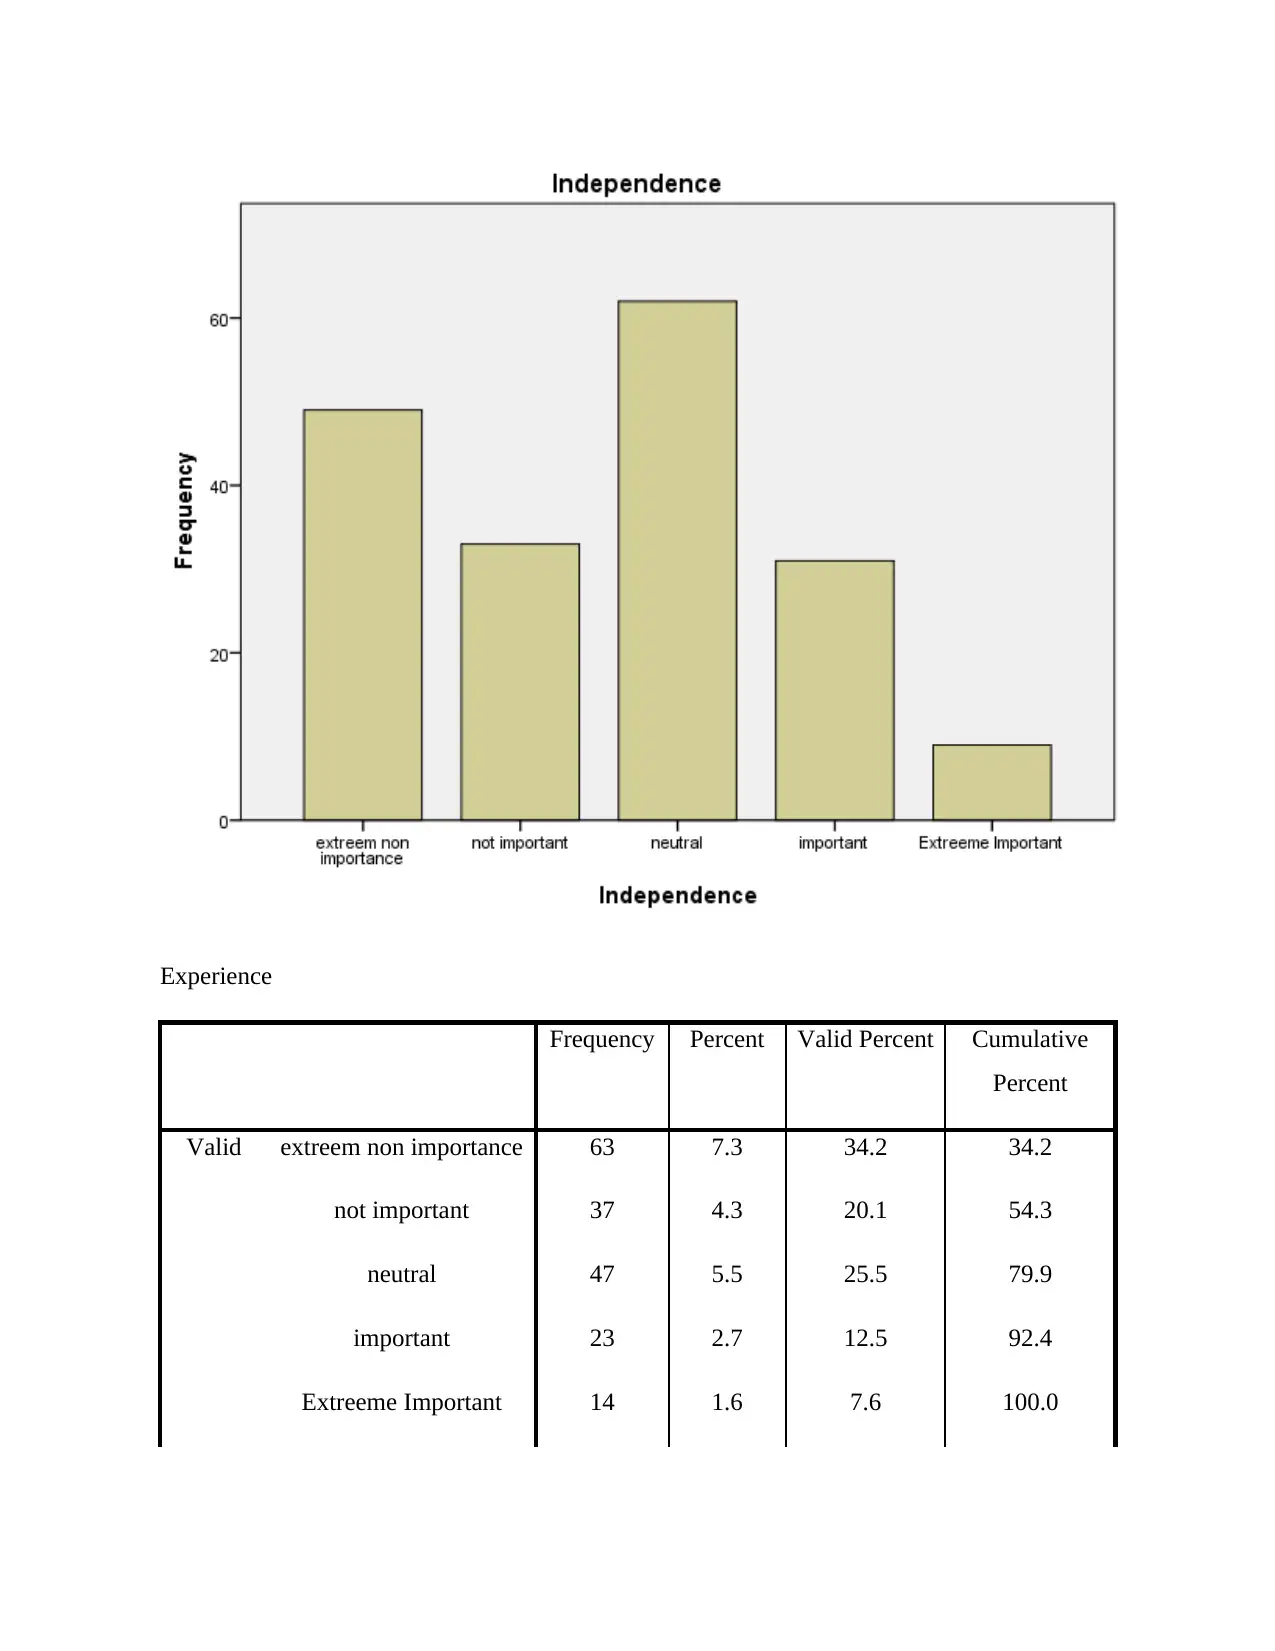
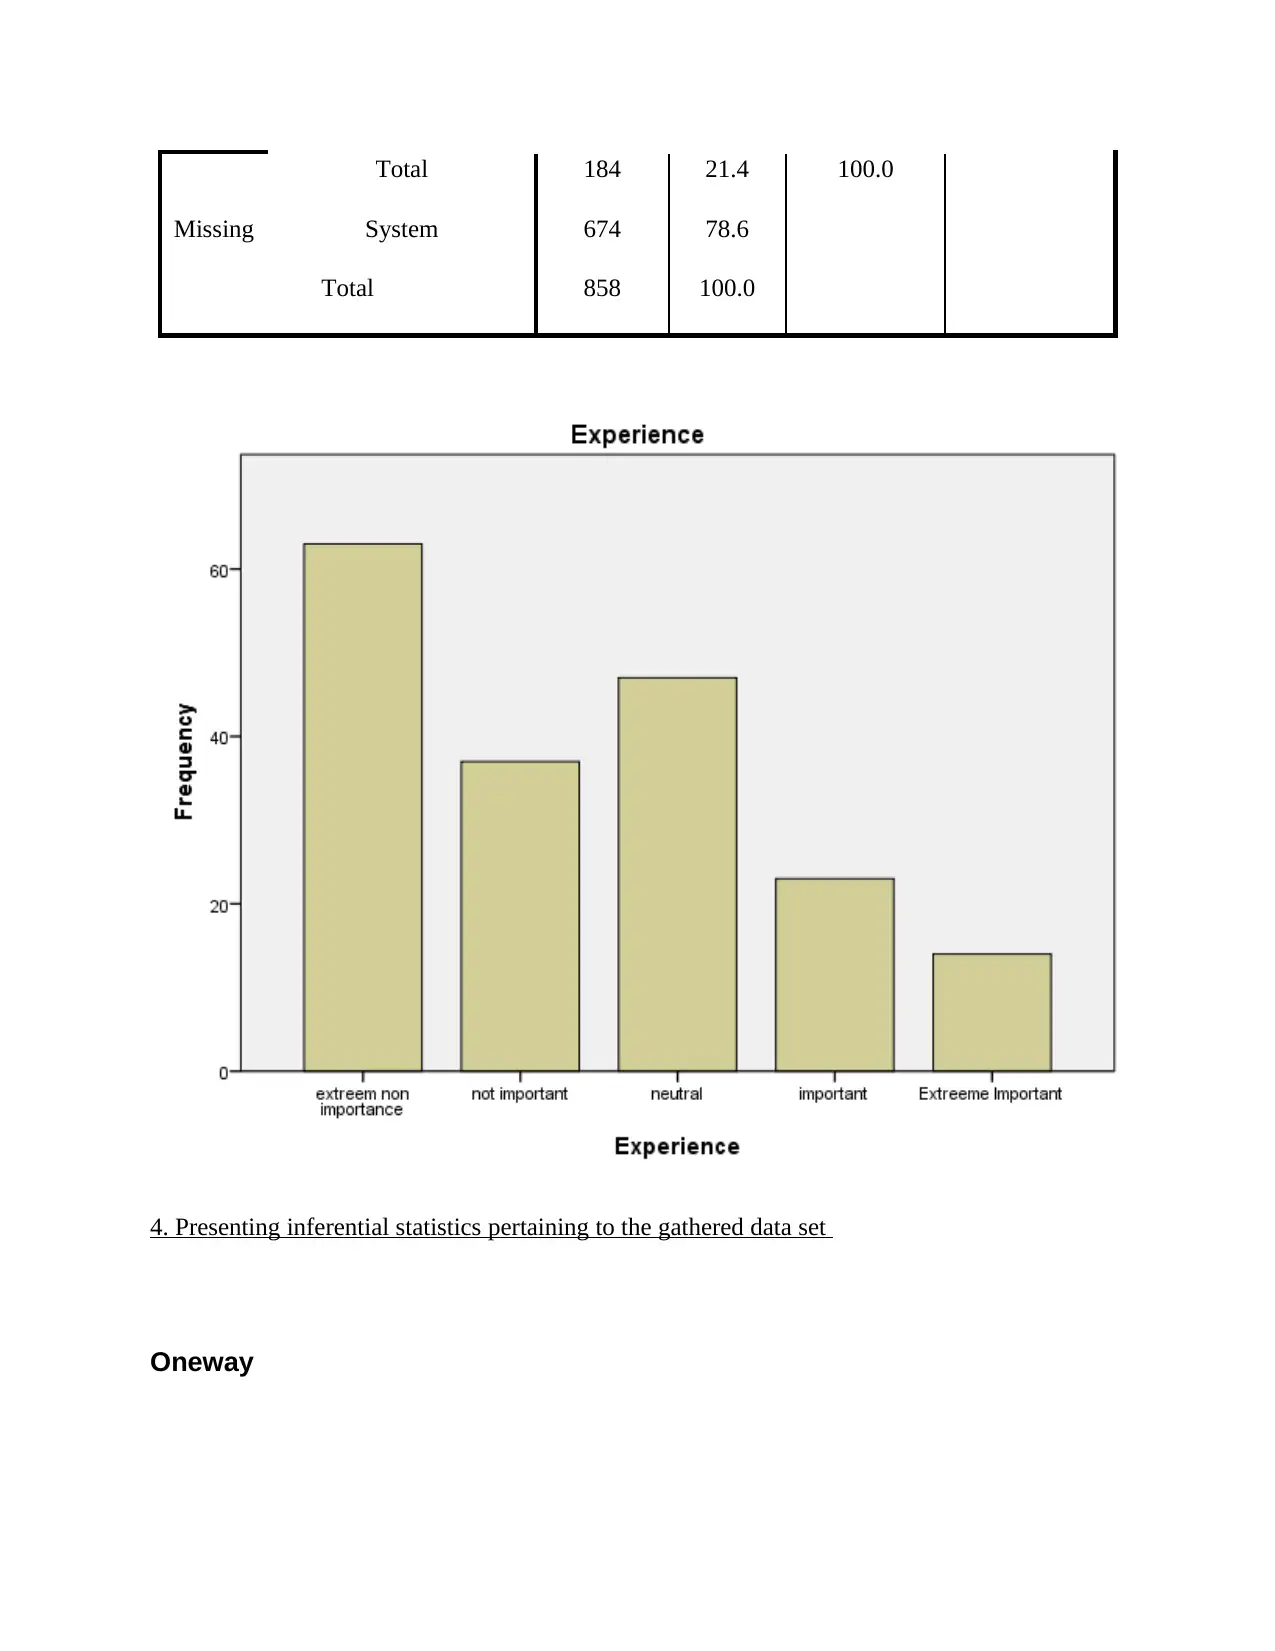
This report presents a quantitative data analysis exploring the relationship between auditor characteristics and investor perception of fraud detection. The study examines the impact of auditor independence, professional skepticism, and experience on investor views. Descriptive statistics summarize the data set, including mean, median, and mode for key variables. Inferential statistics, including ANOVA and post-hoc tests, are used to test the hypotheses. The analysis reveals that investor perception varies significantly with professional skepticism but not with auditor independence or experience. The report also identifies limitations of the data and references literature to support the methodologies used. Overall, the report provides a comprehensive analysis of the factors influencing investor perception of auditor fraud detection capabilities, offering valuable insights into the financial auditing process and its impact on investor confidence.
Document Page
Quantitative Data Analysis
tabler-icon-diamond-filled.svg

Paraphrase This Document

Need a fresh take? Get an instant paraphrase of this document with our AI Paraphraser
Document Page
TABLE OF CONTENTS
INTRODUCTION...........................................................................................................................3
MAIN BODY..................................................................................................................................3
1. Explaining the purpose of data set along with rationale..........................................................3
2. Describing hypothesis..............................................................................................................3
3. Summarizing data set using descriptive statistics....................................................................4
4. Presenting inferential statistics pertaining to the gathered data set.......................................12
5. Identifying limitations of data set gathered for analysis purpose.........................................19
6) Refer to literature sources to justify techniques used............................................................20
CONCLUSION..............................................................................................................................20
REFERENCES..............................................................................................................................21
Document Page
INTRODUCTION
In the recent times, with the motive take optimal decisions business units lay focus on the
adoption of quantitative tools and techniques. Moreover, statistical tools assists in making
evaluation of large data set effectually and thereby provide with competent framework for
decision making. This report is based on the aspects of auditor’s ability in relation to detecting
fraud referring investor’s perception (Nation, Kuntzman and Buxton, 2019). Auditor’s play a
significant role in assessing fraudulent practices contained in financial statements of the firm. In
this regard, there are several variables which in turn directly associated with the aspect of fraud
detection namely auditor independence, professional scepticism, and experience. Hence, report
will shed light on the extent to which investors perception differ in the context aforementioned
variables.
MAIN BODY
1. Explaining the purpose of data set along with rationale
The data set is taken with a purpose of exploring and analysing significance level of
relation or difference in features of an auditor and the perception of the investor over detection of
fraud by auditors. The purpose of selection a specific data set with an important reason of
collection of the data over the perception of investors and comparing it with the characteristic
possessed by auditors in checking their ability of fraud detection while performing their
professional duty (Amrhein, Trafimow and Greenland, 2019). The reason behind selecting this
data is that for determining the ability of the auditors the best way is to identify their professional
trait which they use while performing their work and duty. So with this reason three variable are
selected as independent level of auditor, professional scepticism and their experience.
2. Describing hypothesis
Hypothesis
Null hypothesis (H0): There is no statistical significant difference take place in investor
perception in the context of variables such as auditor independence, professional scepticism, and
experience.
Document Page
Alternative hypothesis (H1): There is a statistical significant difference take place in investor
perception in the context of variables such as auditor independence, professional scepticism, and
experience.
3. Summarizing data set using descriptive statistics
Descriptive statistics
Statistics
Age Gender Perception ProffSceptism Independence Experience
N
Valid 220 220 185 182 184 184
Missing 638 638 673 676 674 674
Mean 3.80 .30 3.36 2.64 2.55 2.39
Median 4.00 .00 3.00 3.00 3.00 2.00
Mode 5 0 5 1 3 1
Std. Deviation 1.246 .461 1.400 1.441 1.191 1.280
Sum 835 67 621 481 470 440
Interpretation: The above statistical table depicts the relation between the perception of
investors and variables (auditor independence, professional scepticism, and experience.) of
auditors. The mean value of perception is 3.36 which means perception of most of the investors
is neutral over the variables of auditors. Median value is 3 which means most of the answer are
of neutral perception while mode value is 5 which means most of the investor strongly agree
with the variables of auditor. For professional scepticism the mean value is 2.6 which means
that this variable is neutral with regards to perception, for the same median is 3 which again
gives neutral response while mode is 1 stating that this variable is of extreme non importance to
determine perception of investors. For the variable independence of audit all three value mean,
mode and median gives value of 3 depict it to be neutral with investor's perception. Experience
tabler-icon-diamond-filled.svg

Paraphrase This Document

Need a fresh take? Get an instant paraphrase of this document with our AI Paraphraser
Document Page
of auditors also do not have a relation with mindset of auditors as mean and Medina value gives
the result of non-importance while mode values gives an answer of extreme non importance.
Frequency Table
7Age
Frequency Percent Valid Percent Cumulative
Percent
Valid
18-30 18 2.1 8.2 8.2
30-40 16 1.9 7.3 15.5
40-50 41 4.8 18.6 34.1
50-60 63 7.3 28.6 62.7
above 60 82 9.6 37.3 100.0
Total 220 25.6 100.0
Missing System 638 74.4
Total 858 100.0
Document Page
Gender
Frequency Percent Valid Percent Cumulative
Percent
Valid
male 153 17.8 69.5 69.5
Female 67 7.8 30.5 100.0
Total 220 25.6 100.0
Missing System 638 74.4
Total 858 100.0
Document Page
Perception
Frequency Percent Valid Percent Cumulative
Percent
Valid strongly disagree 26 3.0 14.1 14.1
disagree 27 3.1 14.6 28.6
neutral 41 4.8 22.2 50.8
Agree 37 4.3 20.0 70.8
tabler-icon-diamond-filled.svg

Paraphrase This Document

Need a fresh take? Get an instant paraphrase of this document with our AI Paraphraser
Document Page
Strongly Agree 54 6.3 29.2 100.0
Total 185 21.6 100.0
Missing System 673 78.4
Total 858 100.0
ProffSceptism
Frequency Percent Valid Percent Cumulative
Percent
Document Page
Valid
extreem non importance 59 6.9 32.4 32.4
not important 27 3.1 14.8 47.3
neutral 44 5.1 24.2 71.4
important 24 2.8 13.2 84.6
Extreeme Important 28 3.3 15.4 100.0
Total 182 21.2 100.0
Missing System 676 78.8
Total 858 100.0
Document Page
Independence
Frequency Percent Valid Percent Cumulative
Percent
Valid
extreem non importance 49 5.7 26.6 26.6
not important 33 3.8 17.9 44.6
neutral 62 7.2 33.7 78.3
important 31 3.6 16.8 95.1
Extreeme Important 9 1.0 4.9 100.0
Total 184 21.4 100.0
Missing System 674 78.6
Total 858 100.0
tabler-icon-diamond-filled.svg

Paraphrase This Document

Need a fresh take? Get an instant paraphrase of this document with our AI Paraphraser
Document Page
Experience
Frequency Percent Valid Percent Cumulative
Percent
Valid extreem non importance 63 7.3 34.2 34.2
not important 37 4.3 20.1 54.3
neutral 47 5.5 25.5 79.9
important 23 2.7 12.5 92.4
Extreeme Important 14 1.6 7.6 100.0
Document Page
Total 184 21.4 100.0
Missing System 674 78.6
Total 858 100.0
4. Presenting inferential statistics pertaining to the gathered data set
Oneway
chevron_up_icon
1 out of 21
circle_padding
hide_on_mobile
zoom_out_icon
[object Object]