Quantitative Research: Bike Parking Usage at Copenhagen University

Verified

Added on  2020/01/21

|12
|2042
|60
Report
AI Summary
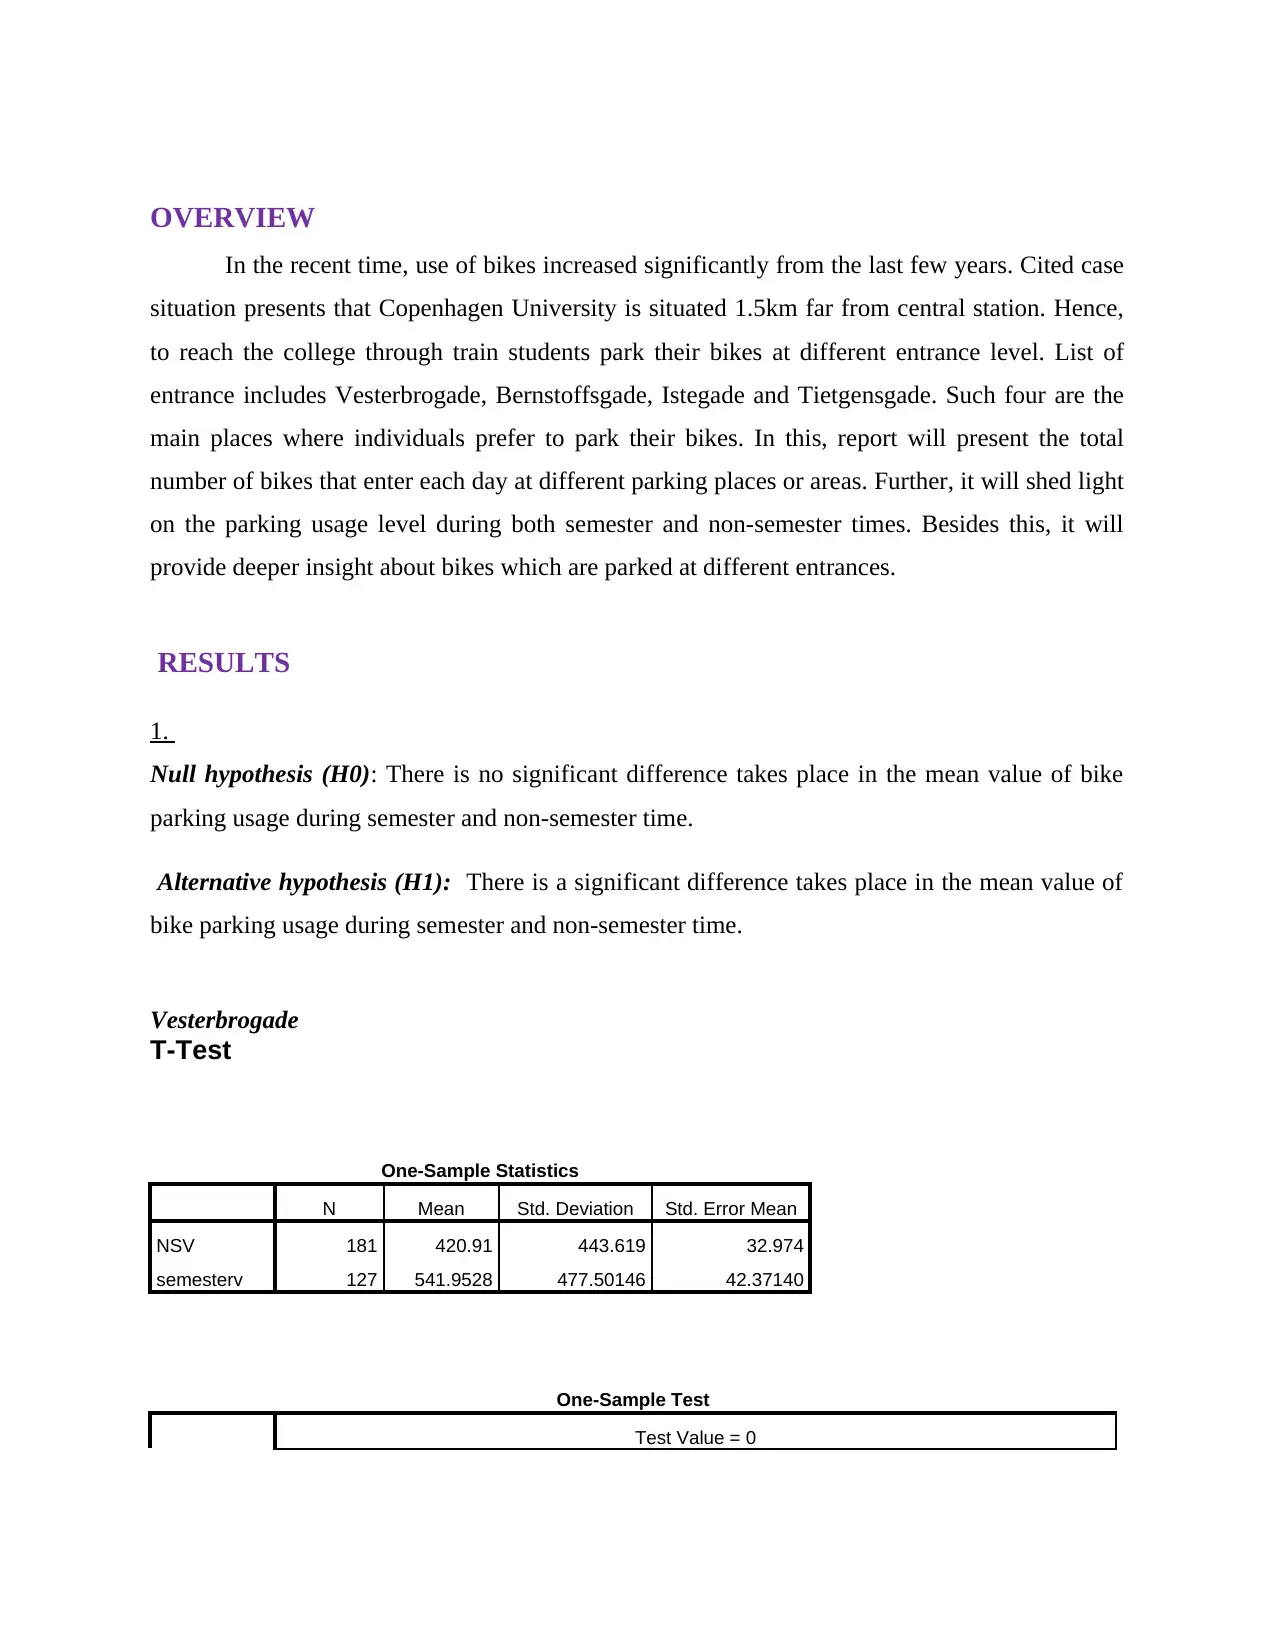
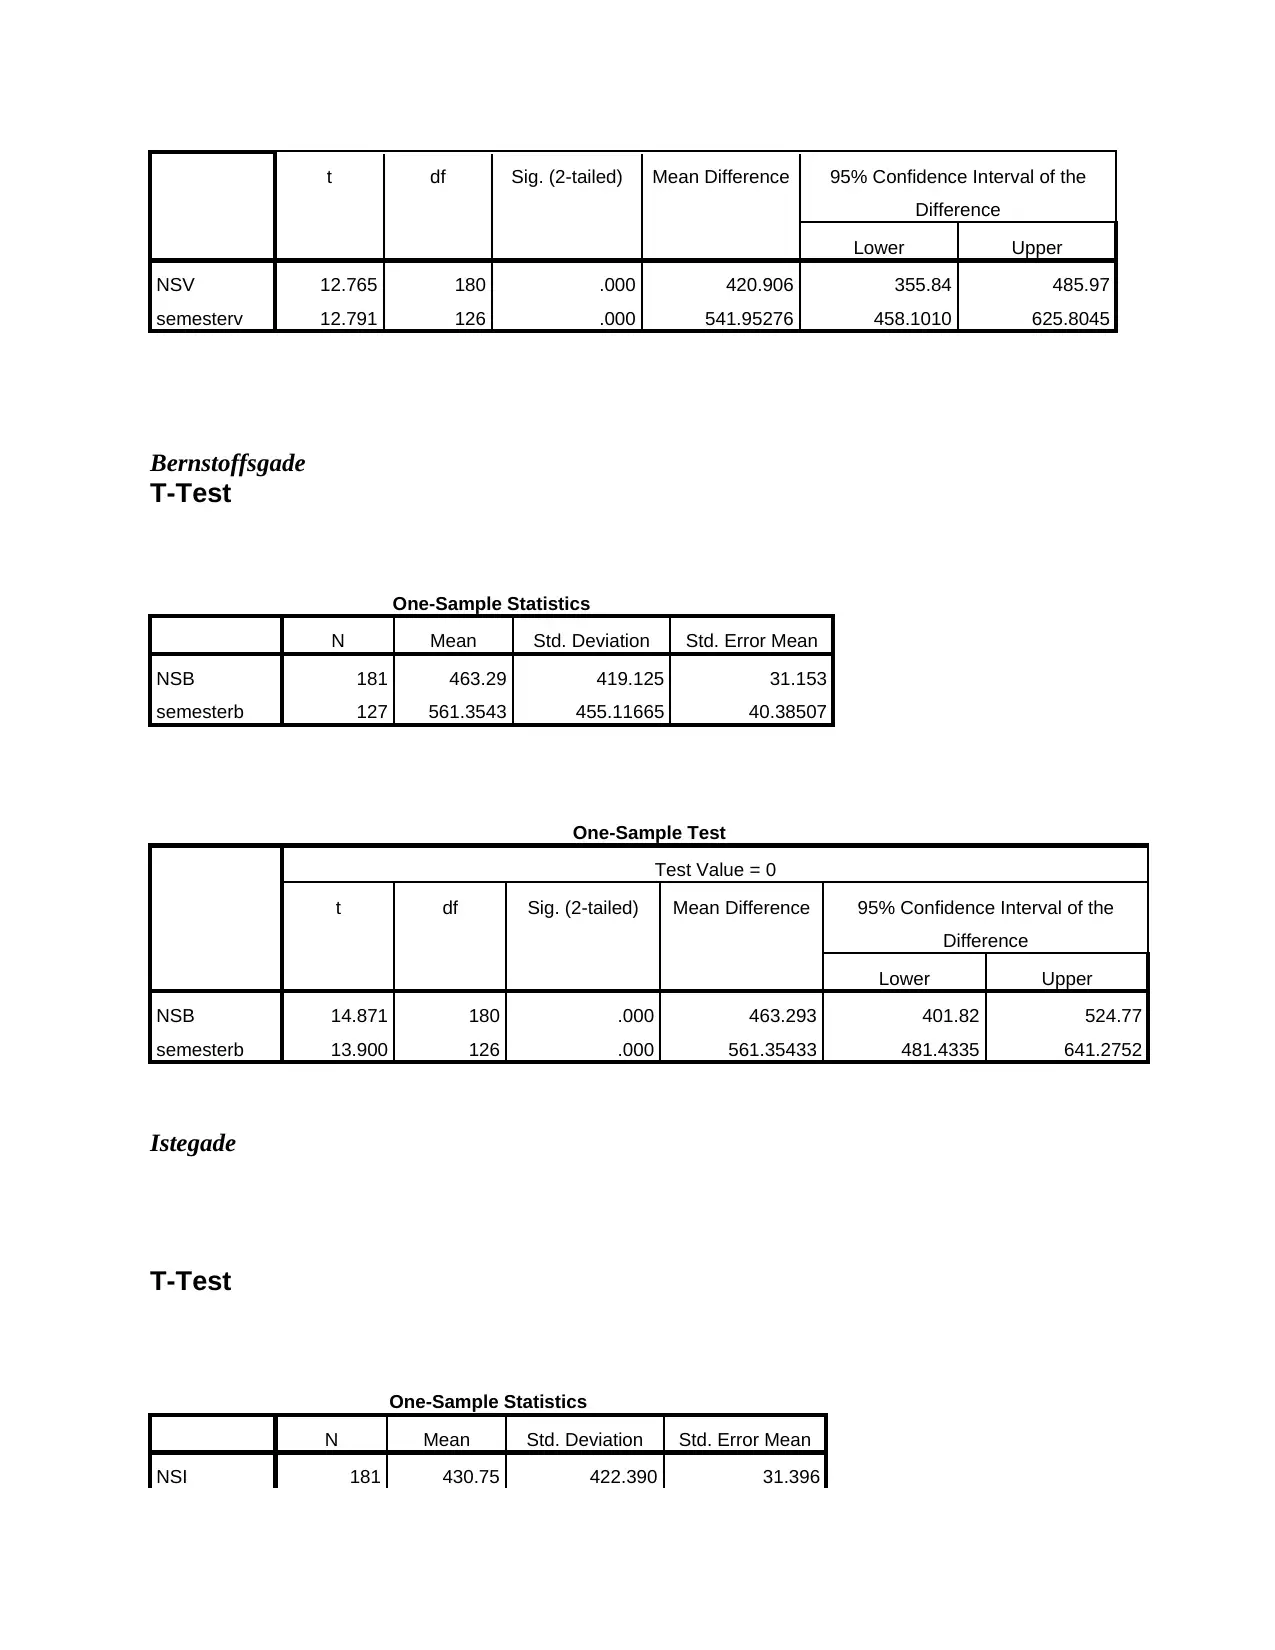
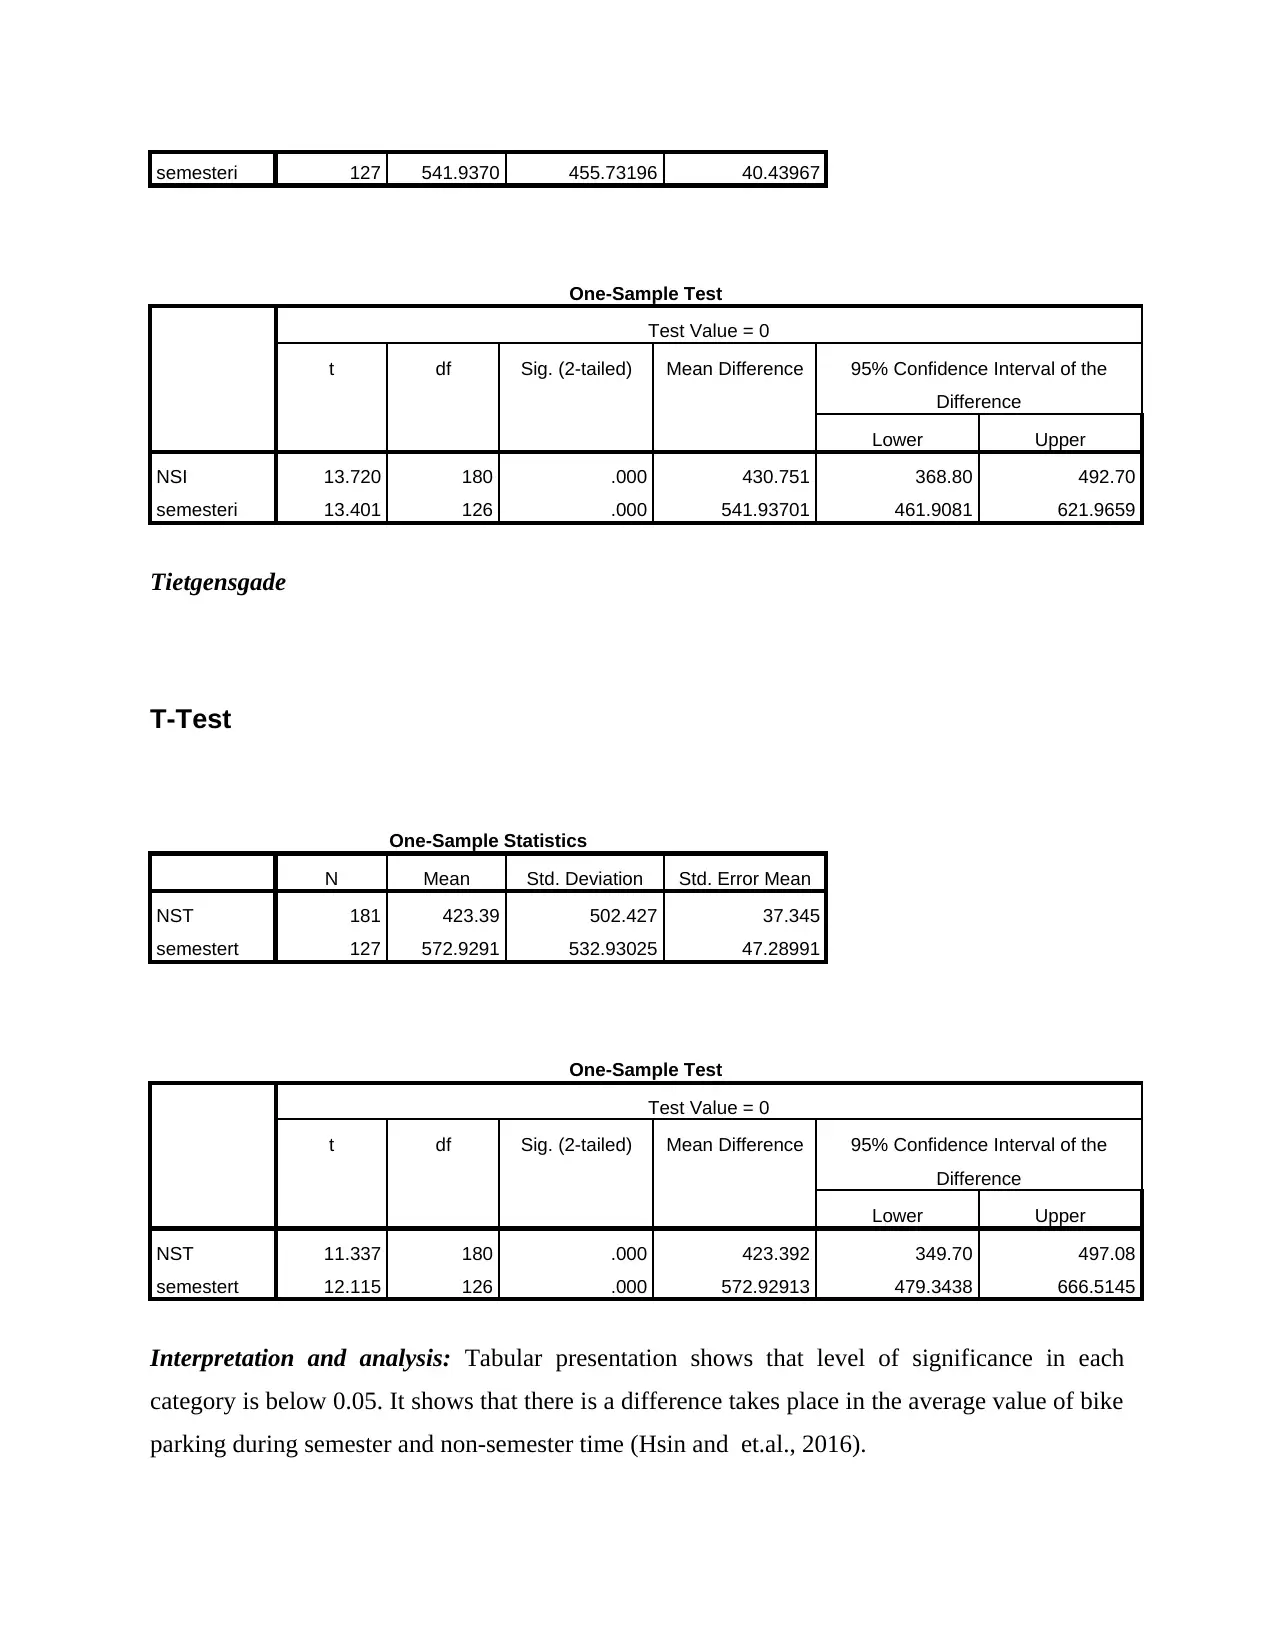
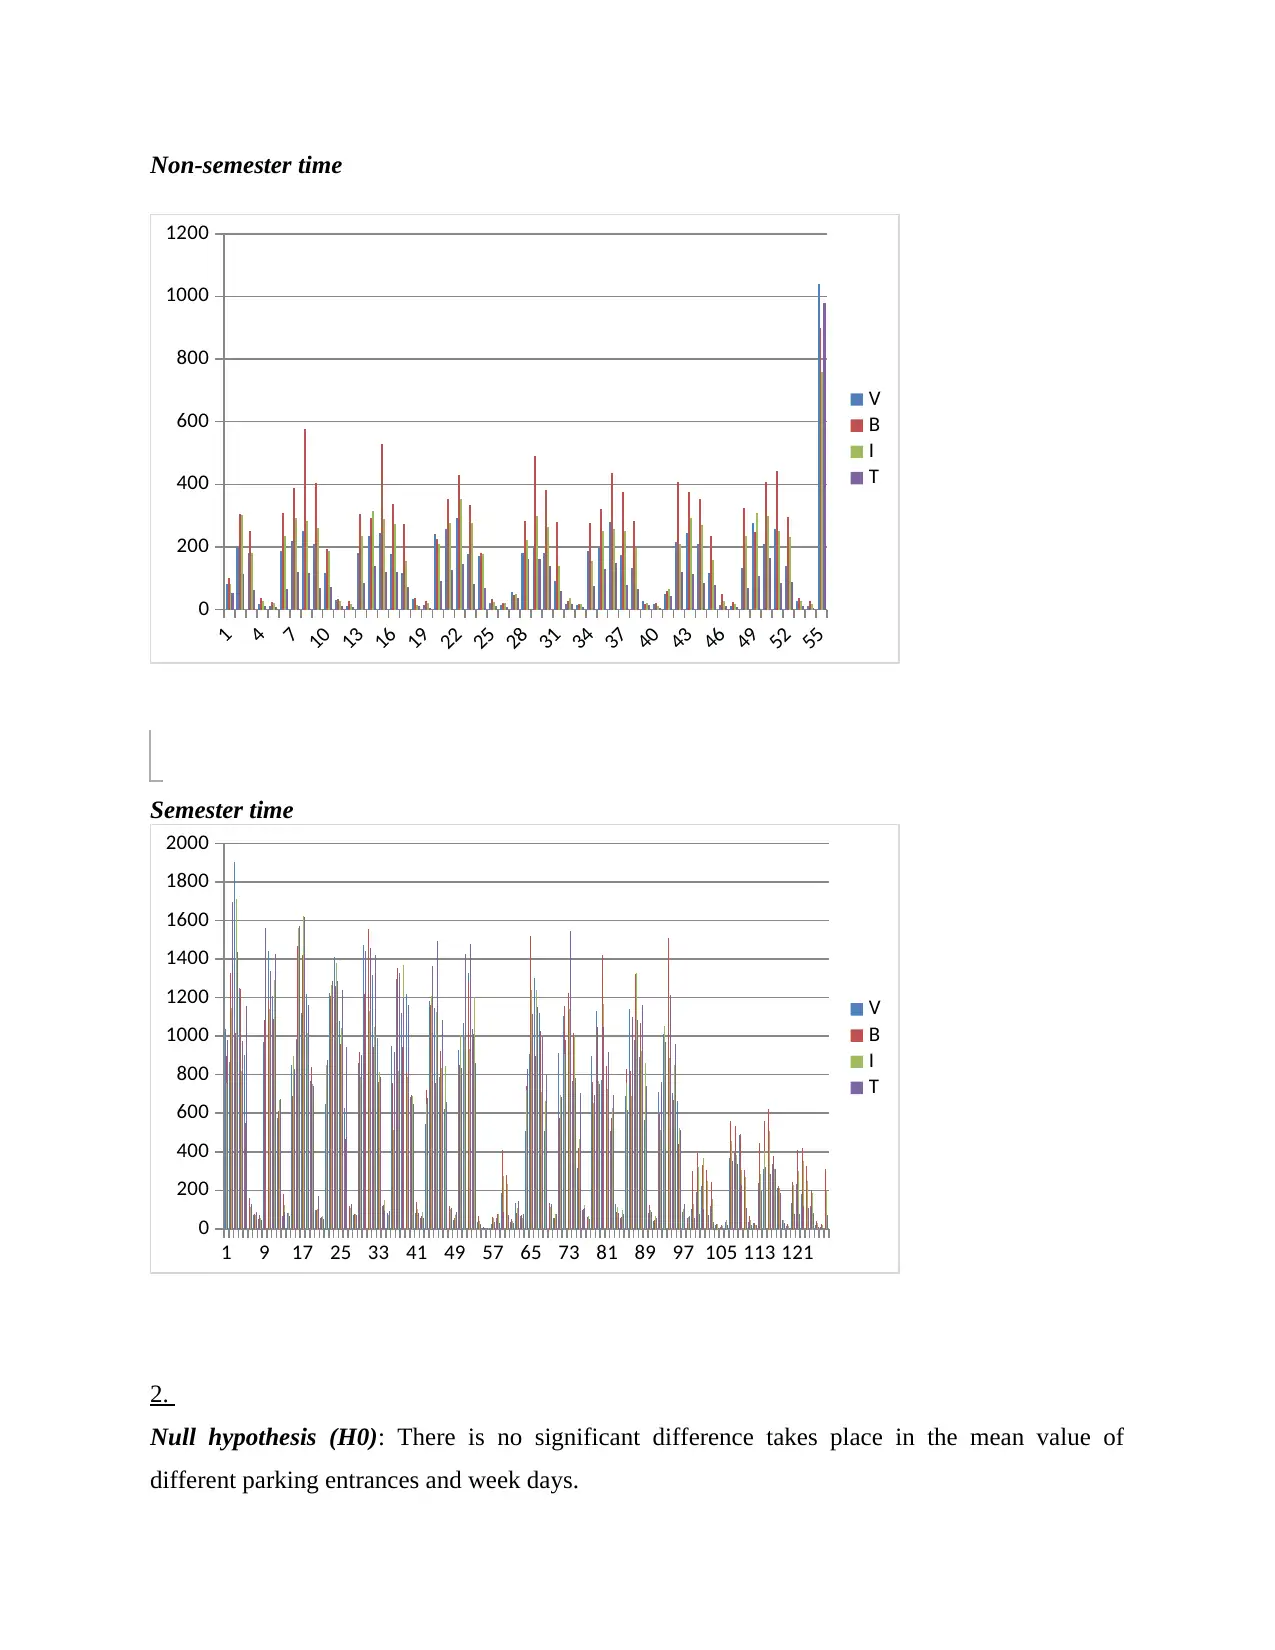
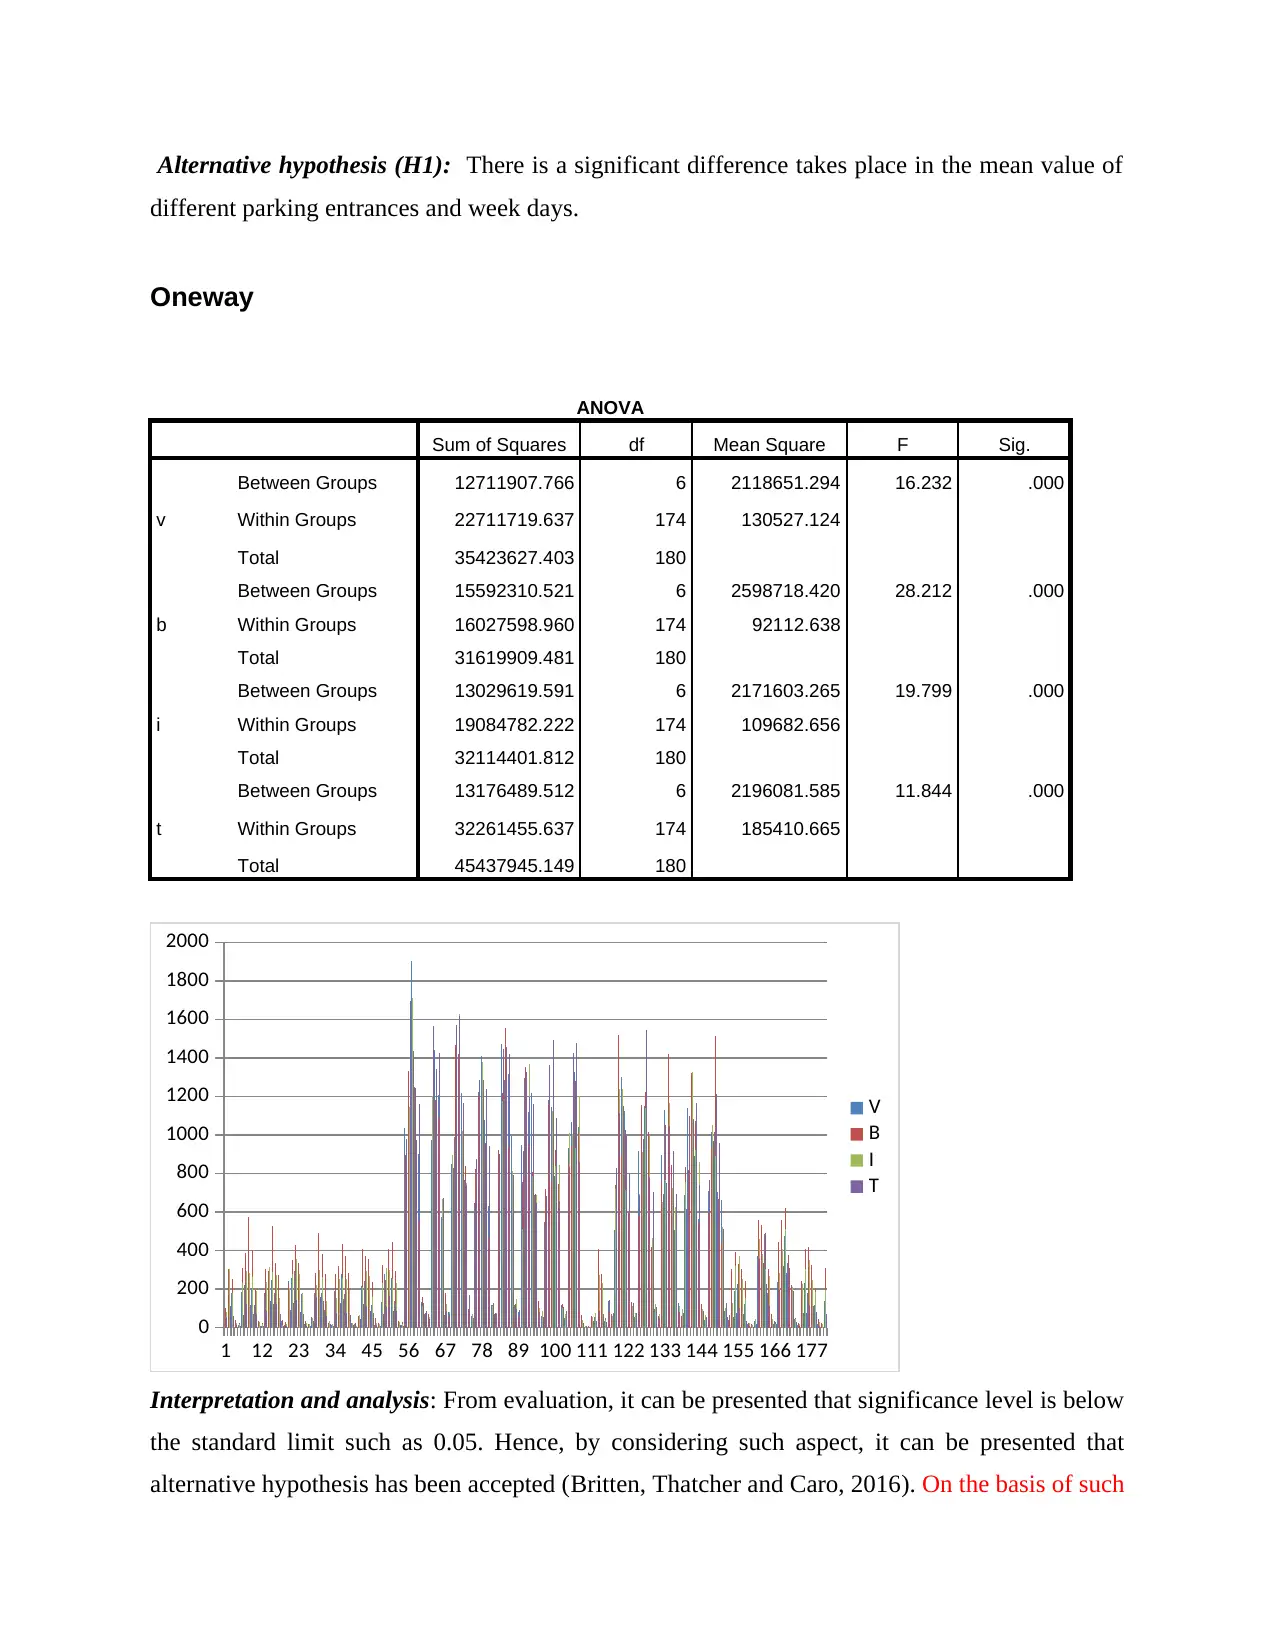
This report presents a quantitative analysis of bike parking usage at the University of Copenhagen, Denmark. The study investigates bike parking patterns in relation to semester and non-semester times across different entrances, including Vesterbrogade, Bernstoffsgade, Istegade, and Tietgensgade. The analysis utilizes T-tests and ANOVA to determine significant differences in parking usage. The results indicate a significant difference in bike parking usage between semester and non-semester periods, with higher usage during semesters. The report concludes that ANOVA provides a more reliable solution than T-tests for this type of analysis, highlighting the influence of factors like proximity to railway stations, shopping malls, and other amenities on parking preferences. The analysis also reveals that Bernstorffsgade is the most preferred parking entrance, offering convenience for students. The study also includes statistical data and interpretations, emphasizing the impact of various factors on parking behavior.
Document Page
Quantitative Research Exercise
tabler-icon-diamond-filled.svg

Paraphrase This Document

Need a fresh take? Get an instant paraphrase of this document with our AI Paraphraser
Document Page
Abstract
`Quantitative analysis lays emphasis on deriving suitable solution of issue by applying
the statistical tools and technique. In this, study is based on the University of Copenhagen city of
Denmark. It can be summarized from the report that bike parking usage in relation to different
cities is highly dependent on semester and non-semester time. Besides this, output of ANOVA
table also shows that null hypothesis is rejected. It can be revealed from the report analysts
should lay emphasis on using ANOVA which offers suitable and reliable solution over others.
Document Page
Table of Contents
OVERVIEW....................................................................................................................................3
RESULTS........................................................................................................................................3
1...................................................................................................................................................3
2...................................................................................................................................................3
DISCUSSIONS................................................................................................................................5
REFERENCES................................................................................................................................6
Document Page
OVERVIEW
In the recent time, use of bikes increased significantly from the last few years. Cited case
situation presents that Copenhagen University is situated 1.5km far from central station. Hence,
to reach the college through train students park their bikes at different entrance level. List of
entrance includes Vesterbrogade, Bernstoffsgade, Istegade and Tietgensgade. Such four are the
main places where individuals prefer to park their bikes. In this, report will present the total
number of bikes that enter each day at different parking places or areas. Further, it will shed light
on the parking usage level during both semester and non-semester times. Besides this, it will
provide deeper insight about bikes which are parked at different entrances.
RESULTS
1.
Null hypothesis (H0): There is no significant difference takes place in the mean value of bike
parking usage during semester and non-semester time.
Alternative hypothesis (H1): There is a significant difference takes place in the mean value of
bike parking usage during semester and non-semester time.
Vesterbrogade
T-Test
One-Sample Statistics
N Mean Std. Deviation Std. Error Mean
NSV 181 420.91 443.619 32.974
semesterv 127 541.9528 477.50146 42.37140
One-Sample Test
Test Value = 0
tabler-icon-diamond-filled.svg

Paraphrase This Document

Need a fresh take? Get an instant paraphrase of this document with our AI Paraphraser
Document Page
t df Sig. (2-tailed) Mean Difference 95% Confidence Interval of the
Difference
Lower Upper
NSV 12.765 180 .000 420.906 355.84 485.97
semesterv 12.791 126 .000 541.95276 458.1010 625.8045
Bernstoffsgade
T-Test
One-Sample Statistics
N Mean Std. Deviation Std. Error Mean
NSB 181 463.29 419.125 31.153
semesterb 127 561.3543 455.11665 40.38507
One-Sample Test
Test Value = 0
t df Sig. (2-tailed) Mean Difference 95% Confidence Interval of the
Difference
Lower Upper
NSB 14.871 180 .000 463.293 401.82 524.77
semesterb 13.900 126 .000 561.35433 481.4335 641.2752
Istegade
T-Test
One-Sample Statistics
N Mean Std. Deviation Std. Error Mean
NSI 181 430.75 422.390 31.396
Document Page
semesteri 127 541.9370 455.73196 40.43967
One-Sample Test
Test Value = 0
t df Sig. (2-tailed) Mean Difference 95% Confidence Interval of the
Difference
Lower Upper
NSI 13.720 180 .000 430.751 368.80 492.70
semesteri 13.401 126 .000 541.93701 461.9081 621.9659
Tietgensgade
T-Test
One-Sample Statistics
N Mean Std. Deviation Std. Error Mean
NST 181 423.39 502.427 37.345
semestert 127 572.9291 532.93025 47.28991
One-Sample Test
Test Value = 0
t df Sig. (2-tailed) Mean Difference 95% Confidence Interval of the
Difference
Lower Upper
NST 11.337 180 .000 423.392 349.70 497.08
semestert 12.115 126 .000 572.92913 479.3438 666.5145
Interpretation and analysis: Tabular presentation shows that level of significance in each
category is below 0.05. It shows that there is a difference takes place in the average value of bike
parking during semester and non-semester time (Hsin and et.al., 2016).
Document Page
Non-semester time
1
4
7
10
13
16
19
22
25
28
31
34
37
40
43
46
49
52
55
0
200
400
600
800
1000
1200
V
B
I
T
Semester time
1 9 17 25 33 41 49 57 65 73 81 89 97 105 113 121
0
200
400
600
800
1000
1200
1400
1600
1800
2000
V
B
I
T
2.
Null hypothesis (H0): There is no significant difference takes place in the mean value of
different parking entrances and week days.
tabler-icon-diamond-filled.svg

Paraphrase This Document

Need a fresh take? Get an instant paraphrase of this document with our AI Paraphraser
Document Page
Alternative hypothesis (H1): There is a significant difference takes place in the mean value of
different parking entrances and week days.
Oneway
ANOVA
Sum of Squares df Mean Square F Sig.
v
Between Groups 12711907.766 6 2118651.294 16.232 .000
Within Groups 22711719.637 174 130527.124
Total 35423627.403 180
b
Between Groups 15592310.521 6 2598718.420 28.212 .000
Within Groups 16027598.960 174 92112.638
Total 31619909.481 180
i
Between Groups 13029619.591 6 2171603.265 19.799 .000
Within Groups 19084782.222 174 109682.656
Total 32114401.812 180
t
Between Groups 13176489.512 6 2196081.585 11.844 .000
Within Groups 32261455.637 174 185410.665
Total 45437945.149 180
1 12 23 34 45 56 67 78 89 100 111 122 133 144 155 166 177
0
200
400
600
800
1000
1200
1400
1600
1800
2000
V
B
I
T
Interpretation and analysis: From evaluation, it can be presented that significance level is below
the standard limit such as 0.05. Hence, by considering such aspect, it can be presented that
alternative hypothesis has been accepted (Britten, Thatcher and Caro, 2016). On the basis of such
Document Page
aspect it can be stated that there is a significant differences take place in the average value of
varied parking entrances (Mas, Amenós and Lois, 2016). It clearly shows that according to day’s
usage of parking entrances are highly influences.
DISCUSSIONS
It has been evaluated that bike parking usage increases to the significant level during
semester time. Moreover, at the time of semester students go to their knowledge more frequently
as compared to other times (Farmer, 2017). By considering such aspect it can be said that car
parking usage is high during semester time rather than non-semester (Alfatihi, Chihab and Alj,
2013). From assessment, it has been found that Bernstorffsgade, street located next to the
central station, is place where large number of vehicles is parked by the students. The rationale
behind this, such parking entrance offers high level of convenience to the students (Ji and et.al.,
2014). Hence, it is one of the main reasons due to which students prefer to park bike at
Bernstorffsgade. By parking the car at such place students can catch train and reach at their
destination with the less time period (Guetterman & et.al., 2017). Hence, convenience is one of
the major factors that have significant impact on customer traffic at varied parking entrances.
Further, it has been assessed that parking usage level of students also influences
according to the days significantly. Moreover, parking usage is highly based on days when
students come to college (Aitken & et.al., 2017). From secondary data assessment, it has been
found that during weekends usually students do not prefer to go college. Besides this, there are
several bars, pubs, porn shops and restaurants are situated near to Istedgade in Copenhagen.
Now, going to pubs, restaurants etc. become the part of life style (Cramer and et.al., 2016).
Hence, mean value of Istedgade is 430.75 respectively which show that most of the students lay
emphasison parking their bikes at Istedgade. Along with this, Vesterbrogade is the main street
which is highly known for shopping (Cleophas and Zwinderman, 2016). Hence, by making
overall evaluation it has been assessed that choice in relation to parking entrance is highly
influences from several factors such as near to railway station, availability of shopping malls,
restaurants, pubs etc (Mahmud and et.al., 2013).
However, findings clearly presents that highly preferred parking entrance is
Bernstorffsgade. By parking the bikes at entrance place students can reach at their college within
Document Page
fewer time frames (Cowie & et.al., 2017). Results of T-test also shows that due to above
discussed factors mean value of different parking entrances differ to a great extent. From
assessment, it has been identified ANOVA is better than T Test. The rationale behind this, T test
offers solution in a limited form (Cleophas and Zwinderman, 2016). On the other side, ANOVA
helps in identifying the impact of independent variables on dependent in a significant way.
CONCLUSION
From the above report it have been concluded that students park their bike during
semester time more frequently over others. It can be seen in the report that alternative hypothesis
has been accepted because the value of analysis is lower than 0.05. Besides this, it can be
inferred that ANOVA tool is highly effectual in comparison to T-test.
tabler-icon-diamond-filled.svg

Paraphrase This Document

Need a fresh take? Get an instant paraphrase of this document with our AI Paraphraser
Document Page
REFERENCES
Books and Journals
Aitken, J. F. & et.al., (2017). Quantitative data describing the impact of the flavonol rutin on in-
vivo blood-glucose and fluid-intake profiles, and survival of human-amylin transgenic
mice. Data in Brief. 10. 298-303.
Alfatihi, S., Chihab, S. and Alj, Y.S., 2013, January. Intelligent parking system for car parking
guidance and damage notification. In Intelligent Systems Modelling & Simulation (ISMS),
2013 4th International Conference on (pp. 24-29). IEEE.
Britten, K. H., Thatcher, T. D. and Caro, T., 2016. Zebras and Biting Flies: Quantitative Analysis
of Reflected Light from Zebra Coats in Their Natural Habitat. PloS one. 11(5). e0154504.
Cleophas, T. J. and Zwinderman, A. H., 2016. Paired Continuous Data (Paired T-Test, Wilcoxon
Signed Rank Test, 10 Patients). In SPSS for Starters and 2nd Levelers (pp. 7-10). Springer
International Publishing.
Cleophas, T. J. and Zwinderman, A. H., 2016. Unpaired Continuous Data (Unpaired T-Test,
Mann-Whitney, 20 Patients). In SPSS for Starters and 2nd Levelers (pp. 17-21). Springer
International Publishing.al Science and Humanity. 6(10). 799.
Cowie, L. G., & et.al., (2017). Structure of the ocean–continent transition, location of the
continent–ocean boundary and magmatic type of the northern Angolan margin from
integrated quantitative analysis of deep seismic reflection and gravity anomaly
data. Geological Society, London, Special Publications. 438(1). 159-176.
Cramer, A. O. and et.al., 2016. Hidden multiplicity in exploratory multiway ANOVA:
Prevalence and remedies. Psychonomic bulletin & review. 23(2). 640-647.
Farmer, L. S. (2017). Quantitative Data Analysis for Quality Control in Strategic Management.
In Encyclopedia of Strategic Leadership and Management (pp. 1461-1470). IGI Global.
Document Page
Guetterman, T. C. & et.al., (2017). The measurement of several concepts used in social sciences
generates an ordinal variable, which is characterized by rawness of the output values and
presents some much debated problems in data analysis. In fact, the need for effective analysis
is easily satisfied with parametric models that deal with quantitative variables. However, the
peculiarities of the ordinal scales, and the crude values produced... Quality &
Quantity. 51(1). 435-458.
Hsin, A. and et.al., 2016. Quantitative Analysis of Bacterial Removal from Root Canal Systems
Using Different Concentrations of Sodium Hypochlorite. Journal of Endodontics. 42(3). e30.
Islam, F., Adil, M., & Alvi, S. A. (2017). PLC Based Automatic Intelligent Car Parking
System. International Journal of Computer Theory and Engineering. 9(1). 53.
Ji, Z. and et.al., 2014. A cloud-based car parking middleware for IoT-based smart cities: Design
and implementation. Sensors. 14(12). pp.22372-22393.
Mahmud, S. A. & et.al., 2013. A survey of intelligent car parking system. Journal of applied
research and technology. 11(5). pp.714-726.
Mas, A., Amenós, M. and Lois, L. M., 2016. Quantitative Analysis of Subcellular Distribution of
the SUMO Conjugation System by Confocal Microscopy Imaging. Plant Proteostasis:
Methods and Protocols. 135-150.
chevron_up_icon
1 out of 12
circle_padding
hide_on_mobile
zoom_out_icon
[object Object]