Quantitative Techniques in Business: Analysis Report

Verified

Added on  2020/12/29

|10
|1433
|196
Report
AI Summary
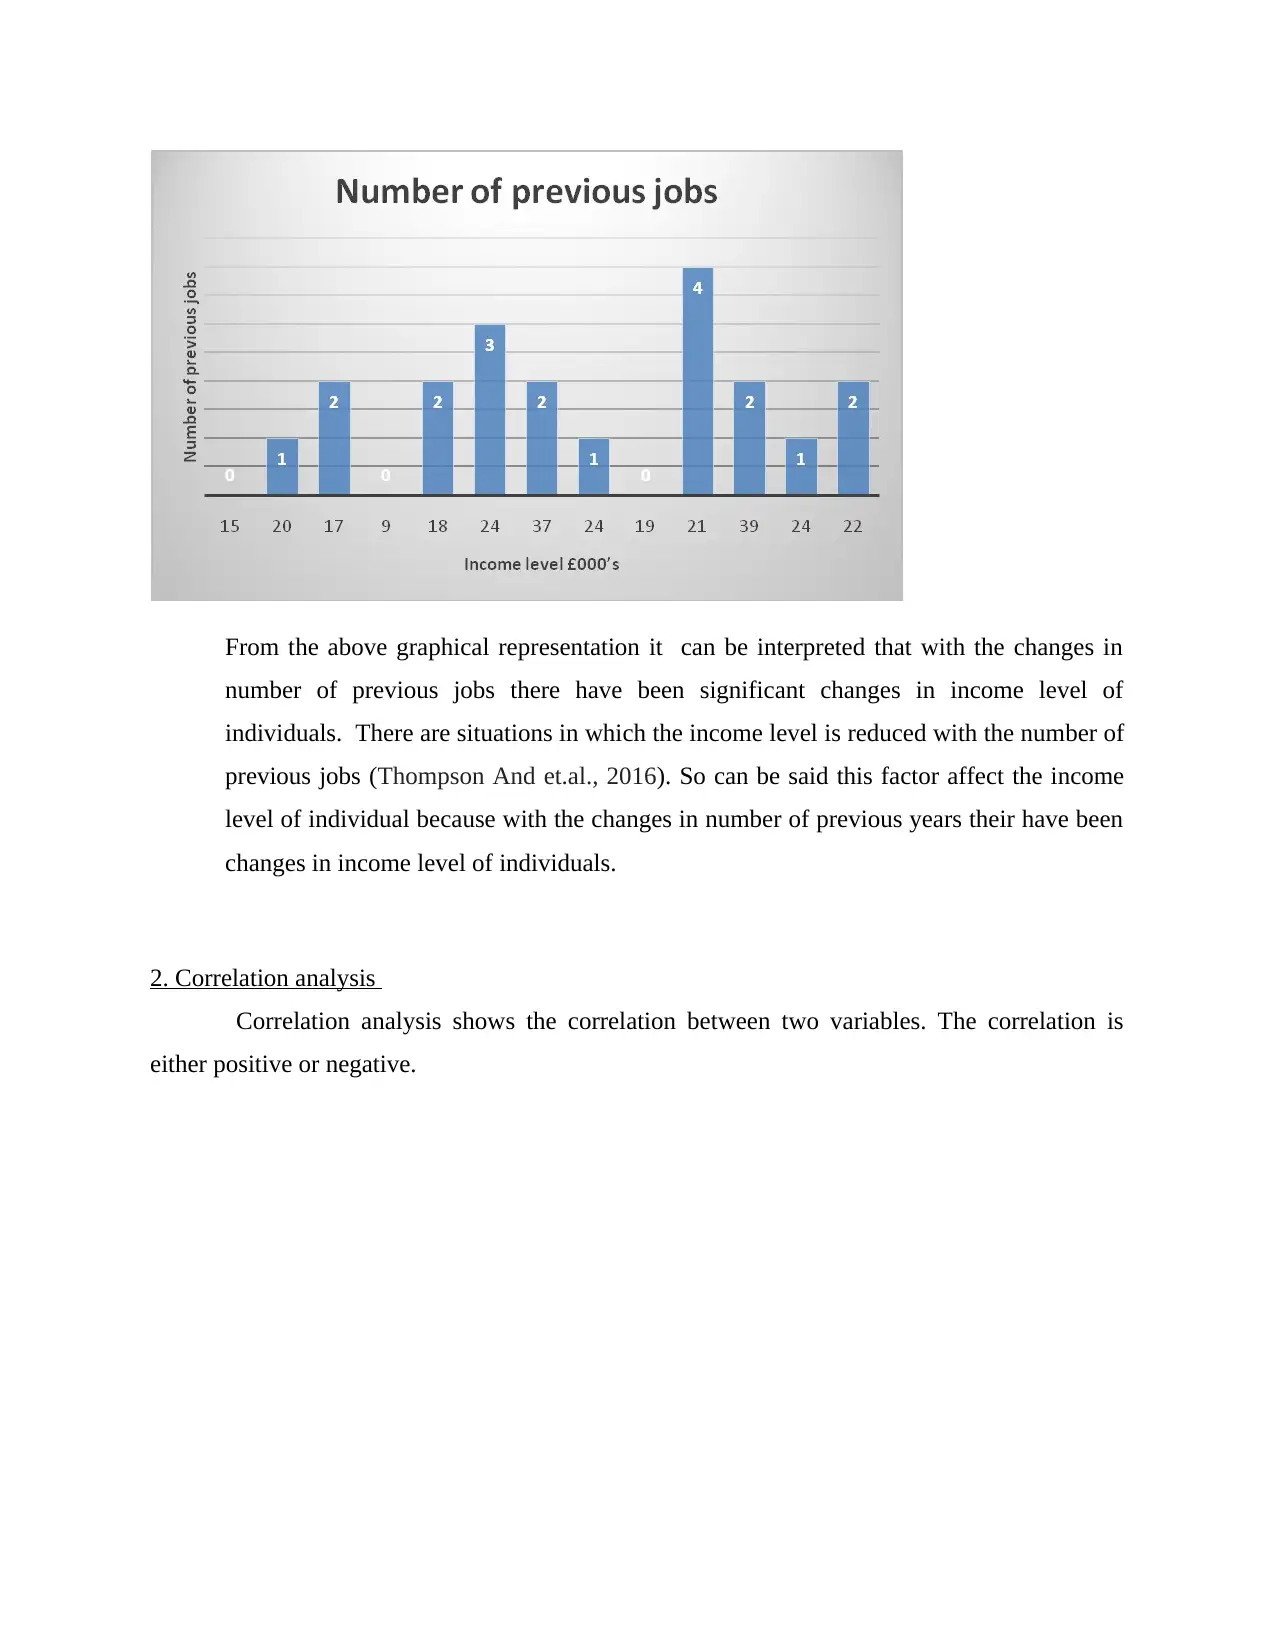
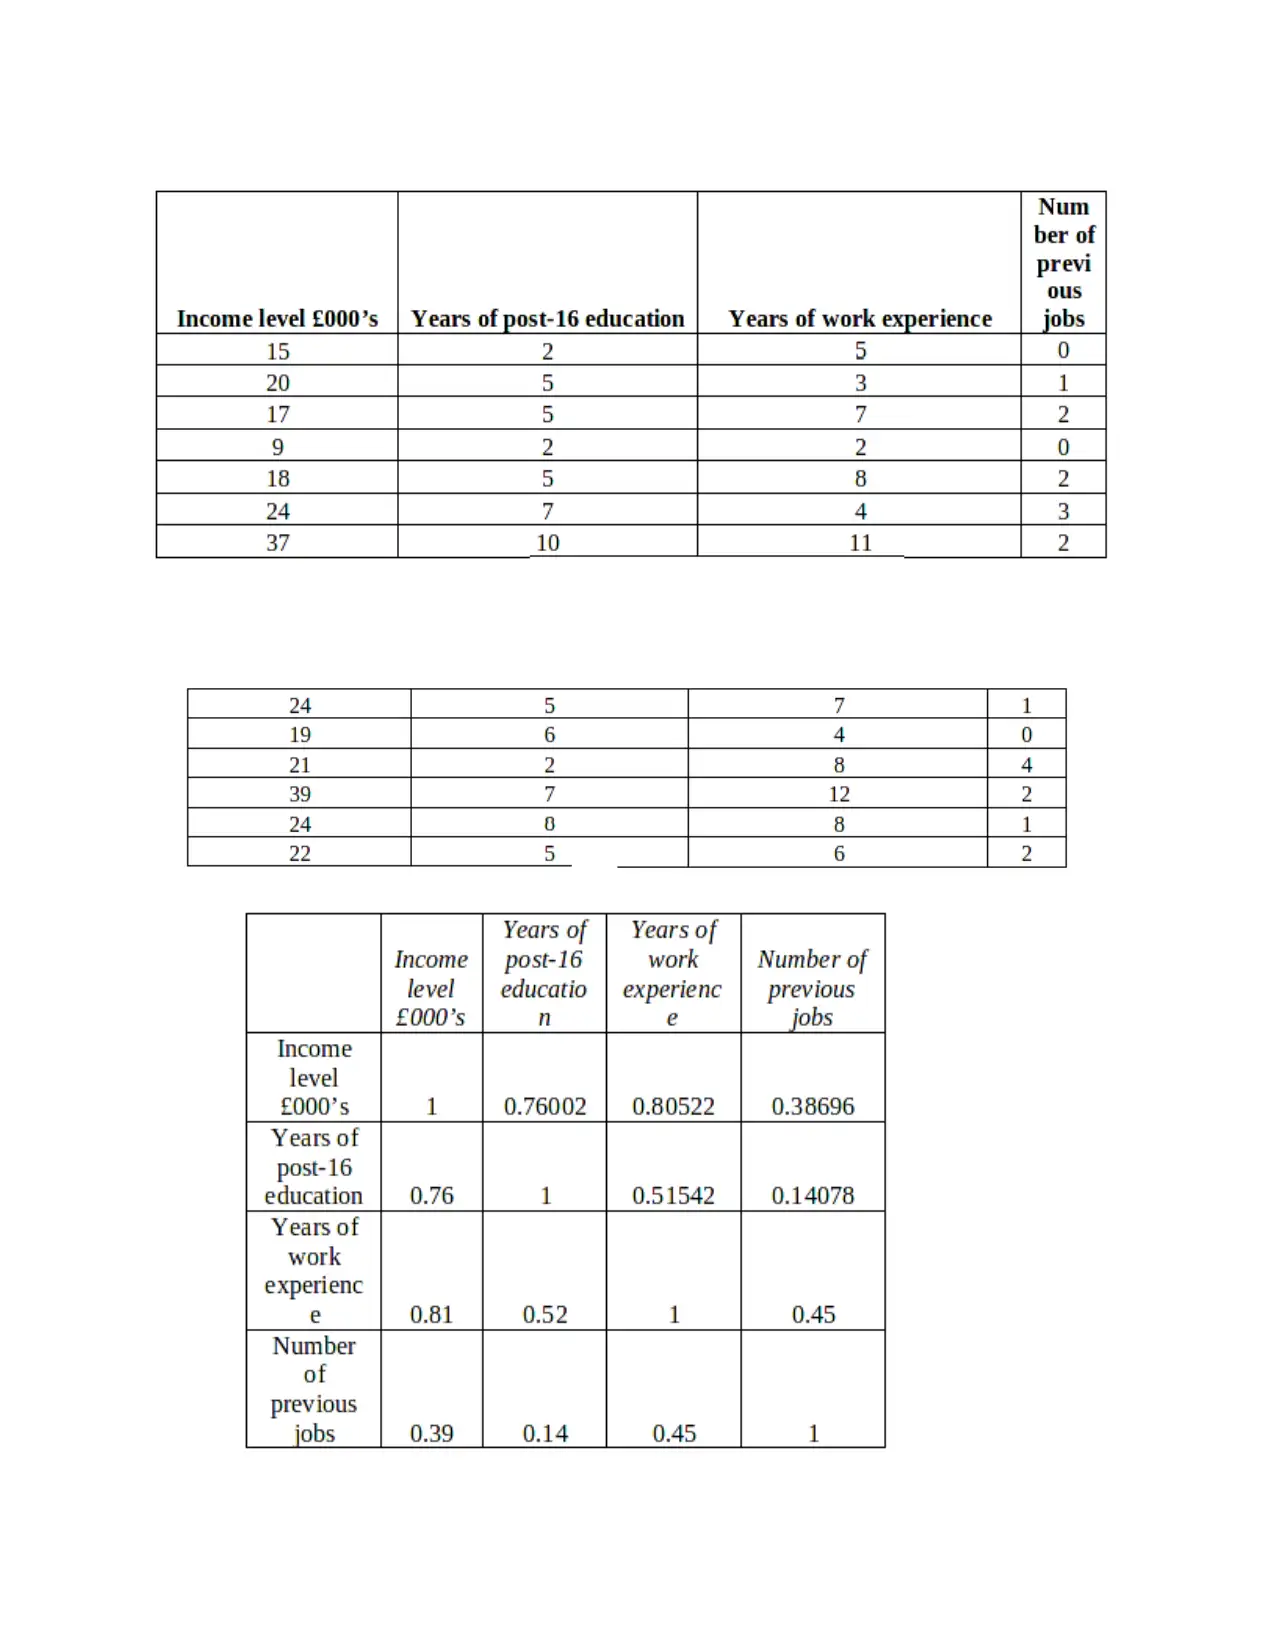
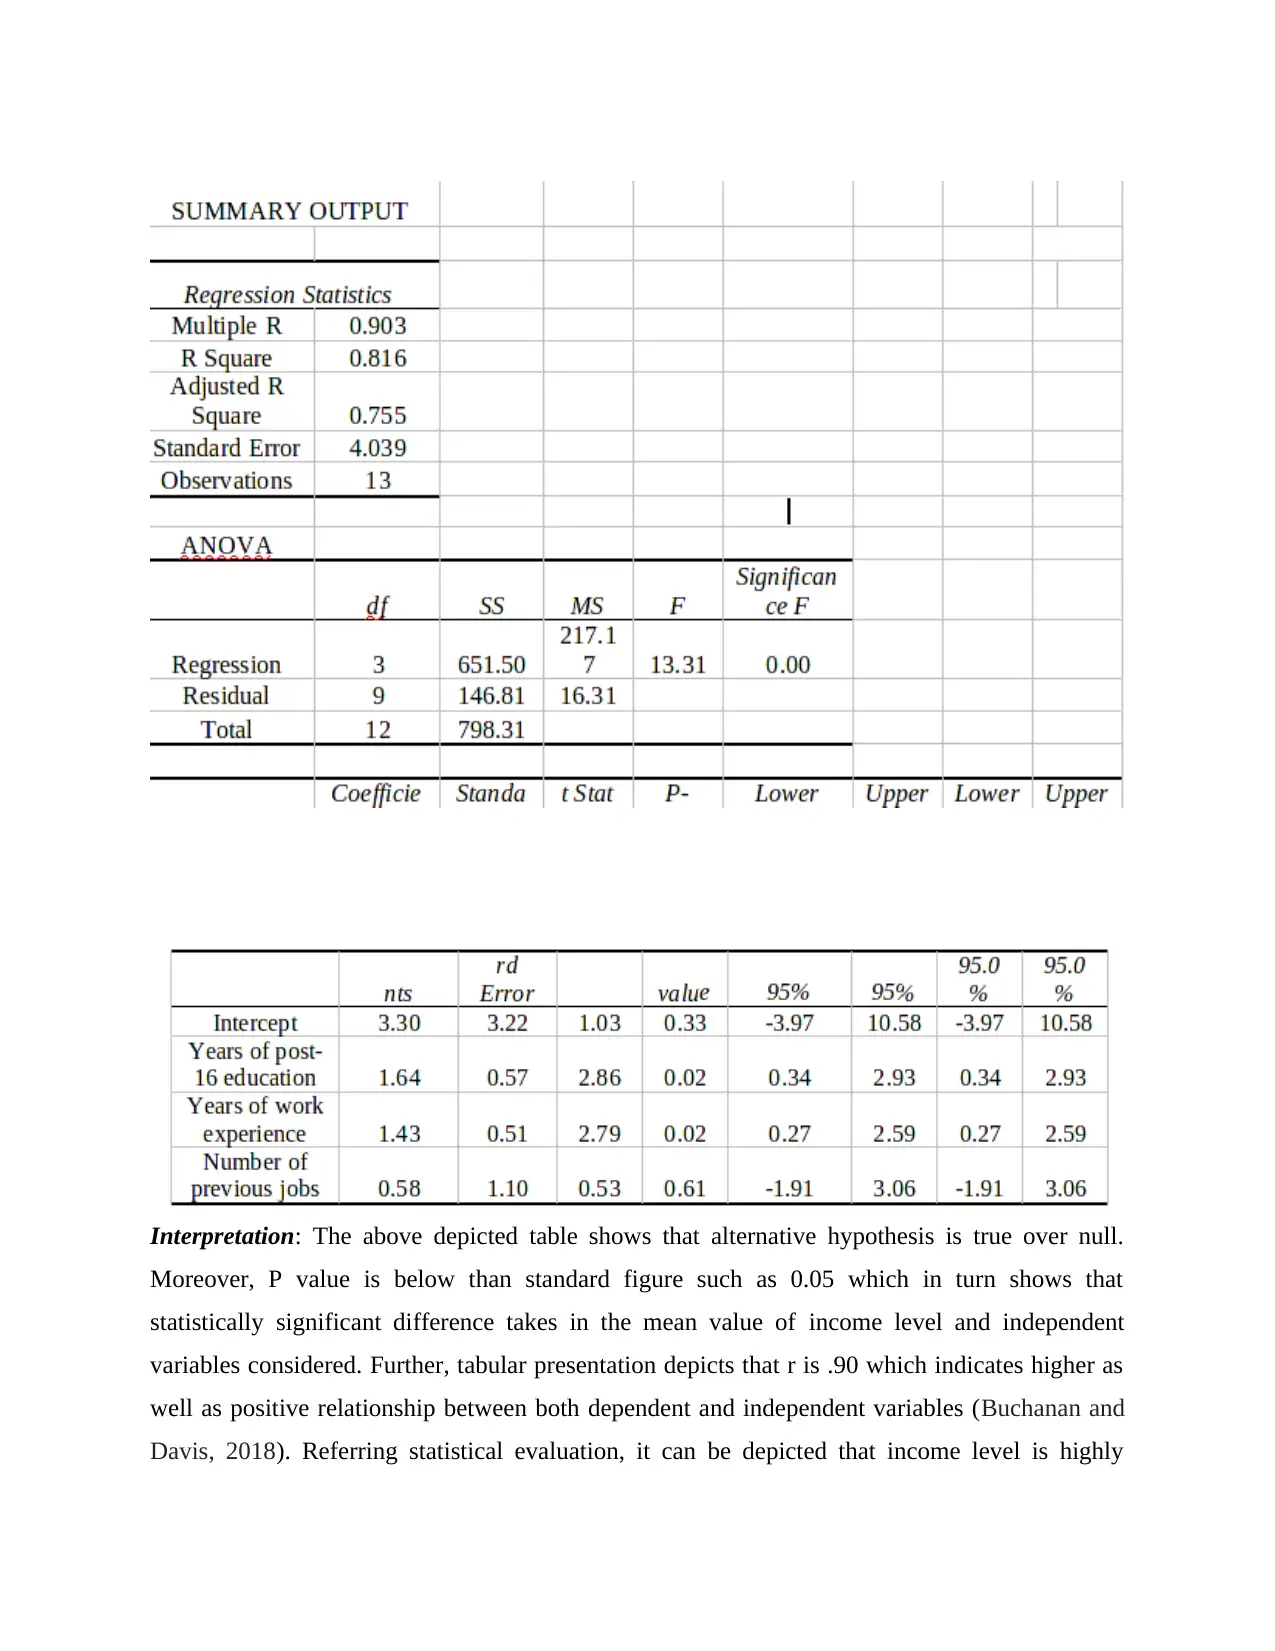
This report delves into the application of quantitative techniques in business, focusing on how these tools aid in strategic decision-making. The analysis centers on a case study examining the factors influencing income levels, utilizing graphical presentations to illustrate relationships between variables such as education, work experience, and income. The report explores correlation analysis to determine the strength of relationships between these variables, revealing significant connections between income and factors like post-16 education and work experience. Furthermore, regression analysis is employed to assess the impact of independent variables on income, with the findings indicating a strong positive relationship between income and the selected factors. The report concludes with recommendations for businesses to leverage these insights for effective income modeling and decision-making, emphasizing the importance of understanding the influence of various factors on income levels. The study highlights the value of quantitative techniques in providing a clear view of business issues and formulating appropriate strategic frameworks, offering a valuable resource for students seeking to understand the application of statistical tools in business contexts.
Document Page
QUANTITATIVE
TECHNIQUES IN BUSINESS
tabler-icon-diamond-filled.svg

Secure Best Marks with AI Grader

Need help grading? Try our AI Grader for instant feedback on your assignments.
Document Page
Table of Contents
INTRODUCTION...........................................................................................................................3
1. Graphical presentation of different variables..........................................................................3
2. Correlation analysis.................................................................................................................5
3. Regression analysis..................................................................................................................7
CONCLUSION AND RECOMMENDATION..............................................................................8
REFERENCES..............................................................................................................................10
Document Page
INTRODUCTION
At present most of the organisation lays of emphasis on using quantitative tools and
techniques for resolving issues. Moreover, quantitative tools present clear view of business issue
or problem and thereby helps in formulating appropriate strategic framework. The present report
is based on the case situation which in turn provides deeper insight about the extent to which
income level is influenced from several other factors. Further, it will also develop understanding
about statistical tools such as correlation, regression etc and presents how they aid in decision
making. In this assignment , it will provide understanding about relationship between the two
variables . This study will support in understanding about the quantitative techniques which are
used in business. Moreover, it will include discussion on the strength of relationship between
ratios. This present study will assist in better understanding of the quantitative techniques. With
the help of these techniques businesses are able to identify the correlation between two variables
to determine the outcome for decision making. The main reason for this assignment is to provide
better understanding to the business about the quantitative techniques so that they are able to use
this techniques inn the proper way to derive effective results for decision making.
1. Graphical presentation of different variables
(i) Income level and Years of post-16 education
Document Page
From abode graph its is interpreted about relation between income level and the years of
Post 16 education. It means income level are affected by the year of post 16 education. It shows
at the income level of 15 the year of post 16 is 2. but with the enhancement in the year of post 16
education there is been increase in income level (Dijkman, Adan and Peters, 2018). Which
shows that with the increase in post there is significant increase in income level. It means there is
positive relationship between the two variables because with the increase in one variable their is
significant increase in other variables also. Income of the individual is affected by the year of
post 16 education.
(ii) Years of work experience and income level
It shows the interrelationship between work experience and income level to
identify the importance of work experience for an individual to have change in the
income level (Quinlan And et.al., 2019). It can be interpreted from the above graphical
representation that there have been changes in the level of income with the changes in
years of experience. From the above calculation it is identified that with the increase in
years of experiences there have been increase in income level of the individual.
iii) Number of previous jobs and income level
tabler-icon-diamond-filled.svg

Secure Best Marks with AI Grader

Need help grading? Try our AI Grader for instant feedback on your assignments.
Document Page
From the above graphical representation it can be interpreted that with the changes in
number of previous jobs there have been significant changes in income level of
individuals. There are situations in which the income level is reduced with the number of
previous jobs (Thompson And et.al., 2016). So can be said this factor affect the income
level of individual because with the changes in number of previous years their have been
changes in income level of individuals.
2. Correlation analysis
Correlation analysis shows the correlation between two variables. The correlation is
either positive or negative.
Document Page
Document Page
From above ratios , it can be interpreted about the correlation of two
determinants. It shows that the relationship between the income level and years of pots 16
education is 0.76002 that shows that this factors is that much related to income level.
Moreover, income level is highly related with the years of work experience because its
shows that the highest relationship with the income level than that of other factors (Evert
and et.al., 2016). Moreover, it shows that relationship between years of post 16
education with that of different other factors such as years of work experience, income
level, number of previous jobs etc. The highest relation shown above provided
understanding about the years of post 16 education with that of income level is highly
related. Moreover, another relation shown above is between years of experience with its
relations with other factor such as income, year of post 16 education, years of
experience, number of previous jobs which shows that this factor is in high related with
income level (Kolluri, Panik and Singamsetti, 2016). Moreover , this analysis has shown
the correlation between different factors.
3. Regression analysis
Regression analysis is a method that allows to examine the relationship between two
variables. This analysis assists in identifying the influence of one or more independent
variables on dependent variables (Paczkowski, 2018). It assists in identifying the
difference between the two variables on the hypothesis testing.
Null hypothesis (H0): There is no significant difference in the mean value of income level and
years of post-16 education, experience, Number of previous jobs (Mejri, Ayachi-
Ghannouchi and Martinho, 2018).
Alternative hypothesis (H1): There is a significant difference in the mean value of income level
and years of post-16 education, experience, Number of previous jobs.
tabler-icon-diamond-filled.svg

Paraphrase This Document

Need a fresh take? Get an instant paraphrase of this document with our AI Paraphraser
Document Page
Interpretation: The above depicted table shows that alternative hypothesis is true over null.
Moreover, P value is below than standard figure such as 0.05 which in turn shows that
statistically significant difference takes in the mean value of income level and independent
variables considered. Further, tabular presentation depicts that r is .90 which indicates higher as
well as positive relationship between both dependent and independent variables (Buchanan and
Davis, 2018). Referring statistical evaluation, it can be depicted that income level is highly
Document Page
influenced from the main two independent variables namely year of post 16 education and
number of previous jobs.
Regression analysis is significant to use because it assist in identifying the significance level
which shows is shown through use of p – value. If the p – value is lower than the 0.05 than it is
not statistically significant. Moreover, it is a good fit has it shows multiple R as 0.903 (Hailey
and Ryan, 2015). The regression analysis assist in identifying the difference between the two
variables .
CONCLUSION AND RECOMMENDATION
From the above study it can be concluded about quantitative techniques used in business
for making various decision. It has shown that with the changes in various factors there is
significant change in the income level of individuals. Moreover, this study has provided
understanding about correlation urinalysis which is used to determine the relationship between
two variables. Moreover, this assignment has shown understanding about correlation analysis
which has shown the relation between two or more variable. From the above analysis it is
identified that the earnings of the people is highly affetced by the factors such as years of post16
education, years of experience, number of previous jobs etc. By using the analysis it has been
identified that the income level should be maintained as per the different factors. Moreover, there
is close relation between this factors because with the changes in one or other factor s their are
significant changes in the income level of individual.
It is recommended to the company to use these factors for identifying the influence of
various factors on the income level. The income level is highly influenced by two factors which
are years of post 16 education and years of experience so in order to reduce the influence of this
factors the company should reduce the correlation between this factors. Also, it is required that
the company is required to focus on this factors to reduce the influence of this factor on the
income of the individual. The company is required to use this analysis for the income model to
identify the influence of the various factors on the income level of individual/
Document Page
REFERENCES
Books and journals
chevron_up_icon
1 out of 10
circle_padding
hide_on_mobile
zoom_out_icon
[object Object]