Quantitative Analysis of Computer Usage in UOW Library
VerifiedAdded on 2020/10/23
|12
|2591
|323
Report
AI Summary
This research report presents a quantitative analysis of computer usage on the ground floor of the UOW library. The study aims to assess the implications of computer usage, identify peak usage times, and determine if the existing 80 computers are sufficient. Data was collected through 20 observations at different times, and a one-sample t-test was conducted using R software to analyze the data. The null hypothesis stated that the mean difference in computer usage is 80, while the alternative hypothesis suggested the mean is less than 80. The findings, based on the t-test and boxplot visualizations, indicated that computer usage was significantly lower than 80, leading to the acceptance of the null hypothesis. The report concludes that the existing number of computers is sufficient for current demand and provides insights into optimizing resource allocation and improving user experience within the library.
RESEARCH METHODOLOGY
Paraphrase This Document
Need a fresh take? Get an instant paraphrase of this document with our AI Paraphraser
TABLE OF CONTENTS
RESEARCH PROPOSAL ..............................................................................................................1
Background.................................................................................................................................1
Research aim and objectives ......................................................................................................1
Research questions .....................................................................................................................2
Research problem .......................................................................................................................2
Significance of problem..............................................................................................................2
Expected outcome.......................................................................................................................3
Statistical Analysis......................................................................................................................3
Methodology and procedure for the study .................................................................................3
QUANTITATIVE ANALYSIS ......................................................................................................4
Data collection ...........................................................................................................................4
Statistical hypothesis ..................................................................................................................5
Carrying out T test with the application of R software...............................................................5
Research findings and conclusion ..............................................................................................8
REFERENCES................................................................................................................................9
RESEARCH PROPOSAL
Background
In the today's scenario, each and everything is managed and controlled through
computers. Generally, organization and businesses uses computer for purpose of business and
market planning. Computers helps in tracking customer data for managing its goods and
services. It is helpful for government offices, marketing, home, business, banking, hospitals,
business, education field and students. They are used for converting raw facts and data in form of
meaningful information with its knowledge. Computers have altered method of work from any
profession. It is natural about function of computer in context of education is very important in
this generation. The appropriate consideration of computer technology is present in each sphere
of life.
This technology has given huge impact on education sector. They are making things
easier and interesting as compared to before. In the similar aspect, direct owing to memory
capacities of computers along with big chunk of data which is stored. It helps in enabling quick
processing of data with fewer chances of mistakes in process. The networks computers directly
aids for quick communication with providing web access. The documents could be stored in
computer in soft copy format rather than hard copy as it helps in saving power (Lincoln, Messa
and Stone, 2018).
The present report is stating information about usage of computer in library in support of
UOW for enhancing academic communication. It has presence of numerous advantages which
comprises non-academic web browsing, gaming, email and participation in different non-
academic chat rooms are replicated as secondary activities. The library might prohibit these
activities which interfere with objectives which supports institutions along with research. The
primary user group is student, staff and faculty of UOW University with availability of computer
and database which are afforded through library (Mowatt and et.al., 2018). If library computers
are misused which gives outcome in suspension or loss of privilege with its application. In the
similar aspect, this report will articulate this research problem with appropriate data analysis
along with application of statistical tool as t-test from R software and its script as well.
Research aim and objectives
Aim: To find out usage of computer on ground floor in the context of UOW library.
On the basis of above aim following objectives have been drafted:
1
⊘ This is a preview!⊘
Do you want full access?
Subscribe today to unlock all pages.
Trusted by 1+ million students worldwide
To assess implications of usage of computer in UOW library.
To assist high traffic time of computer usage on ground floor in library.
To find that 80 computers are sufficient for UOW library or not.
Research methodology: The data will be gathered by adopting on sample t-test with
context of quantitative analysis (Ledford and Gast, 2018). There will be collection of data by
considering sample of 20 at different time from library.
Research questions
What are the implications of using computer on ground floor in UOW library and there
present sufficiency?
What are timings for high traffic of computer usage in UOW library?
Research problem
The main research problem with numerous implication of computer usage and timing. In
this present scenario, UOW library has 80 computers so in this order are they sufficient or not is
to be determined in this research proposal. In this context, this problem would be accomplished
by taking observations at different time from 10:30 AM to 16:30 PM as it would be creating
unbiasness in its outcome.
Significance of problem
This study has acknowledges effectiveness of computer usage in education system, it
reflects standards and knowledge of its users along with different features of library computers.
Usually, computers helps in gaining knowledgeable information and to reproduce various
desirable outcome for accomplishing its specific expectations. However, computer usage in this
UOW library along with various strategies for improving its standard and efficient way which
impacts university. This research problem has huge significance on basis of library along with
whole university. It is directly leading to security problem and involvement of technology
security as well. If computers are used in library for appropriate aspect, then it is advantage as
initial objective to host computer training session. In UOW library, there are total 80 computer
and there is requirement of assisting that they are enough and used for effective purpose or not.
2
Paraphrase This Document
Need a fresh take? Get an instant paraphrase of this document with our AI Paraphraser
Expected outcome
Most importantly, its outcome of computer usage would be giving a foundation for
improving standard of UOW library. The study of computer usage has been determined in this
particular study which must be pursued for placing more computers in library or not. Secondly,
its outcome of timing of computer usage helps in stimulating traffic in UOW library. Typically,
the research and documentation of observations would entice both traffic and mean to place more
computers. The UOW library must actively encourage the users along with capability of building
their variety of knowledge which consists of database, researches and articles for varied level of
affordability.
Lastly, the UOW library sets vision and creates numerous opportunities for growth and
stability. The database and information of library helps in rehabilitating activities which raises
standard and give unique resources for innovative and updated information.
Statistical Analysis
There will be implication of one sample T-test as statistical procedure for identifying
numerous observation of sample (20) which is generated with process along with particular
mean.
Hypothesis:
H0 (Null hypothesis): The usage of computer on ground floor in UOW library’s mean difference
is 80.
H1 (Alternative hypothesis): The usage of computer on ground floor in UOW library’s mean
difference is less than 80.
Methodology and procedure for the study
Research type: Research is considered as careful consideration of study on basis of
particular concern about issue with application of various scientific methods. It could be
classified in two types for sake of proper understanding of this particular concept such as
quantitative and qualitative analysis (Malti and et.al., 2018). These both types has presence of
different objectives such as:
Qualitative analysis: It is based on description as it interviews and observe people in
particular selected format. Generally, observation of events and people are analysed via
qualitative methods. They observe trends and on its contrary, quantitative analysis
performs it via statistics but in qualitative numbers are not used.
3
Quantitative analysis: It is fully based on statistics and has huge involvement of
questions which could be answered in numerical format. To extract outcome, generally
there is conduct of experiments. Further, there is analysis of numbers with different
statistical models to attain final outcome.
Hence, this research will be performed through quantitative analysis with number of
usage of computer at certain time period in UOW library.
Data collection: This is replicated as process of measuring and collecting information on
basis of different variables of interest for establishing systematic fashion which helps in enabling
answer of stated question of research along with testing hypotheses and to evaluate desired
outcome. In this research, data will be collected from 20 observations at different time of UOW
library. For each sample at a time, there will be extraction of counting of outcome of computers
which are occupied at specific duration (Tourangeau, 2018).
Sampling: It is considered as process with application used on basis of statistical analysis
which is pre-identified number of observations are considered from huge population. In this
research, we will be using random sampling for collecting data with presence of equal
probability of being selected. It is considered as one of the most easy form of gathering data from
whole population. Under this method, every member of dataset ill carry equal opportunity for
being sleeted in process of sampling. The chosen sample will be providing unbiased outcome of
total population (Wang, Gao and Li, 2018).
Data analysis: It is considered as process of transforming, cleansing, modelling and
inspecting data with objective of discovering useful information. There will be application on
One sample t-test as there are 20 observations which is less than 30. There is presence of
statistical difference among sample mean along with hypothesised value of mean of its
population. It is replicated as easiest hypothesis test on basis of statistics that whether a single
factor via sample of measurements which directly differs via hypothesises parameter of
population (McGee, 2018).
QUANTITATIVE ANALYSIS
Data collection
The research objective is accomplished through gathering primary data from computer usage
with 20 observation in library. For articulating our research on basis of finding usage of
4
⊘ This is a preview!⊘
Do you want full access?
Subscribe today to unlock all pages.
Trusted by 1+ million students worldwide
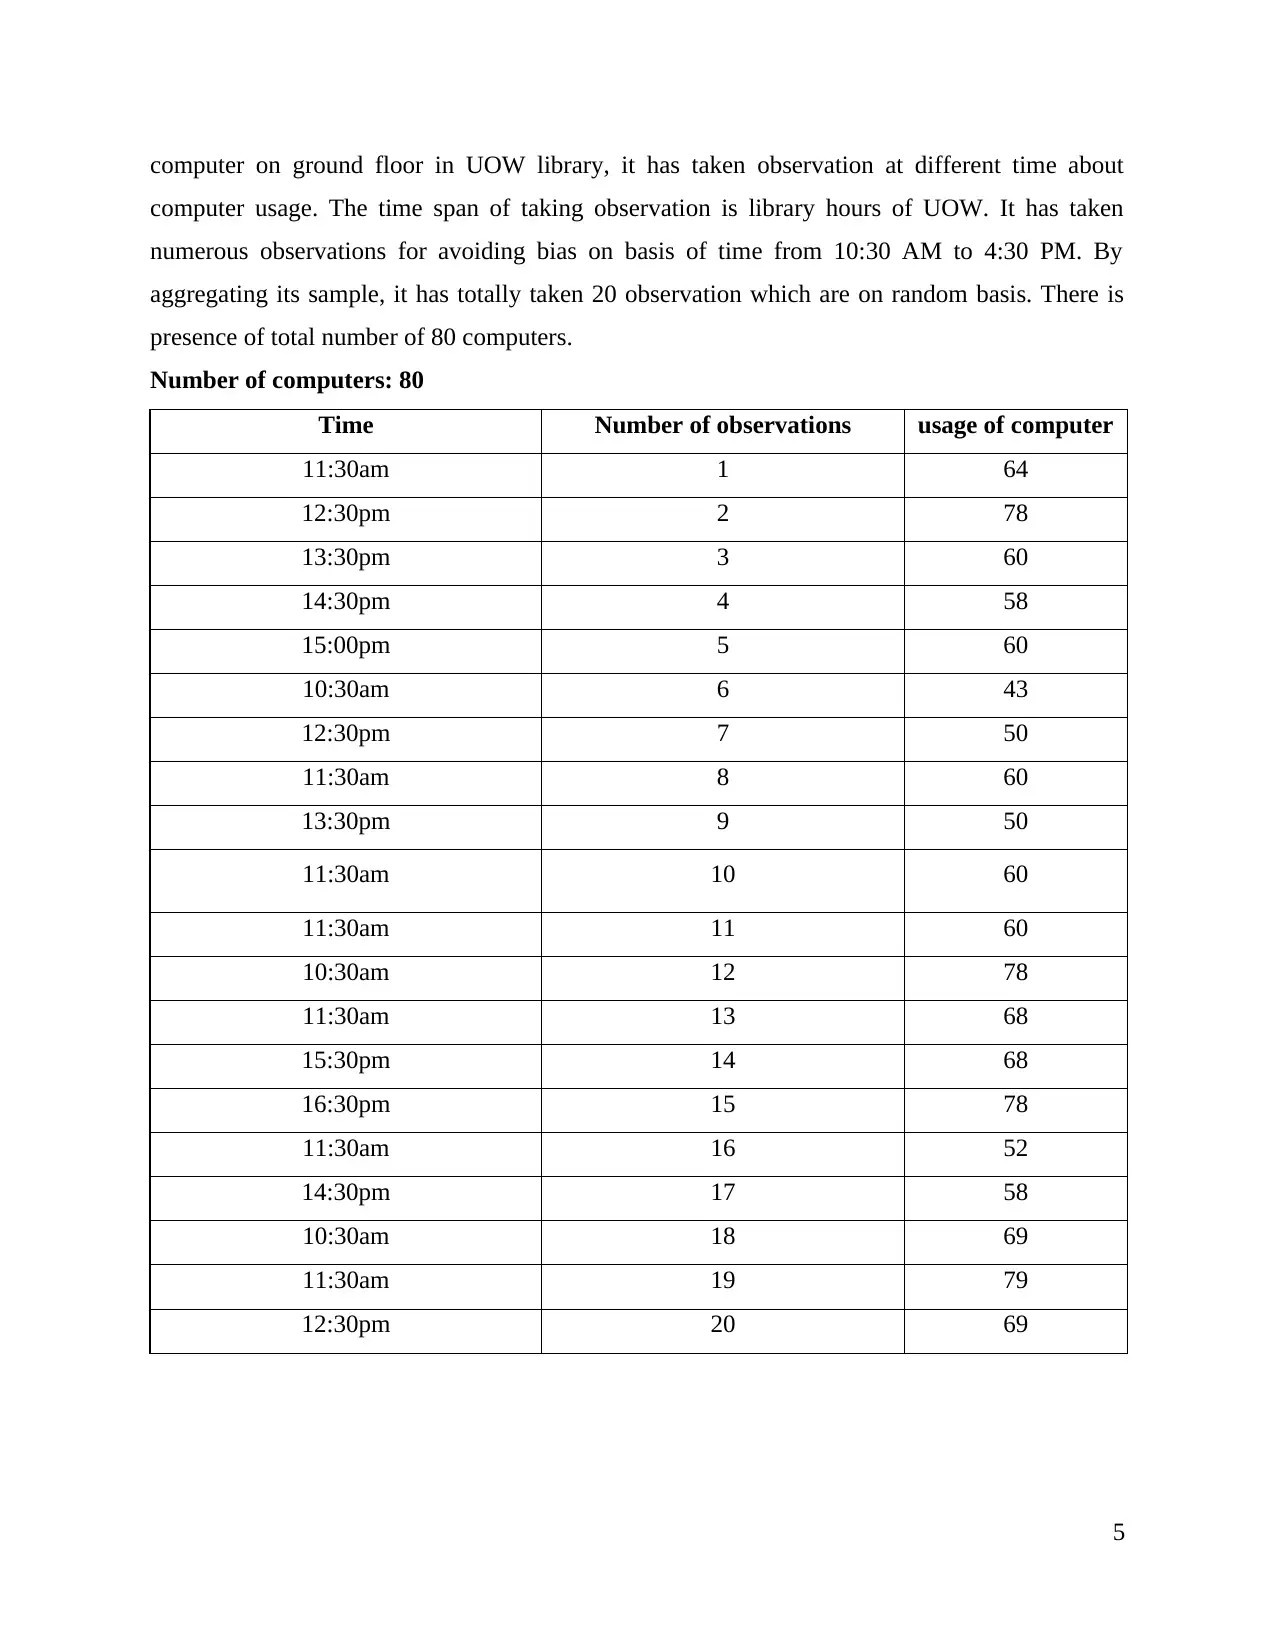
computer on ground floor in UOW library, it has taken observation at different time about
computer usage. The time span of taking observation is library hours of UOW. It has taken
numerous observations for avoiding bias on basis of time from 10:30 AM to 4:30 PM. By
aggregating its sample, it has totally taken 20 observation which are on random basis. There is
presence of total number of 80 computers.
Number of computers: 80
Time Number of observations usage of computer
11:30am 1 64
12:30pm 2 78
13:30pm 3 60
14:30pm 4 58
15:00pm 5 60
10:30am 6 43
12:30pm 7 50
11:30am 8 60
13:30pm 9 50
11:30am 10 60
11:30am 11 60
10:30am 12 78
11:30am 13 68
15:30pm 14 68
16:30pm 15 78
11:30am 16 52
14:30pm 17 58
10:30am 18 69
11:30am 19 79
12:30pm 20 69
5
Paraphrase This Document
Need a fresh take? Get an instant paraphrase of this document with our AI Paraphraser
Statistical hypothesis
H0 (Null hypothesis): The usage of computer on ground floor in UOW library’s mean
difference is 80.
H1 (Alternative hypothesis): The usage of computer on ground floor in UOW library’s mean
difference is less than 80.
Carrying out T test with the application of R software
One Sample t-test
Usage t = -7.3522,
df = 19,
p-value = 2.869e-07
Alternative hypothesis: true mean is less than 80
95 percent confidence interval: -
Inf 67.07463
sample estimates: mean of x 63.1
Data Analysis:
In the above analysis, the t (test statistic) = -7.3522 with 19 degree of freedom and its p
value is high as 2.86. Hence, it has high p value which signifies acceptance of null hypothesis
which shows that computer usage is less than 80. The mean of sample is 63.1 along with 95%
confidence interval for population mean determined through this 20 sample. The mean usage
from sample(20) was significantly lower to its total number as its p value is more than 0.05
which has acceptance of null hypothesis.
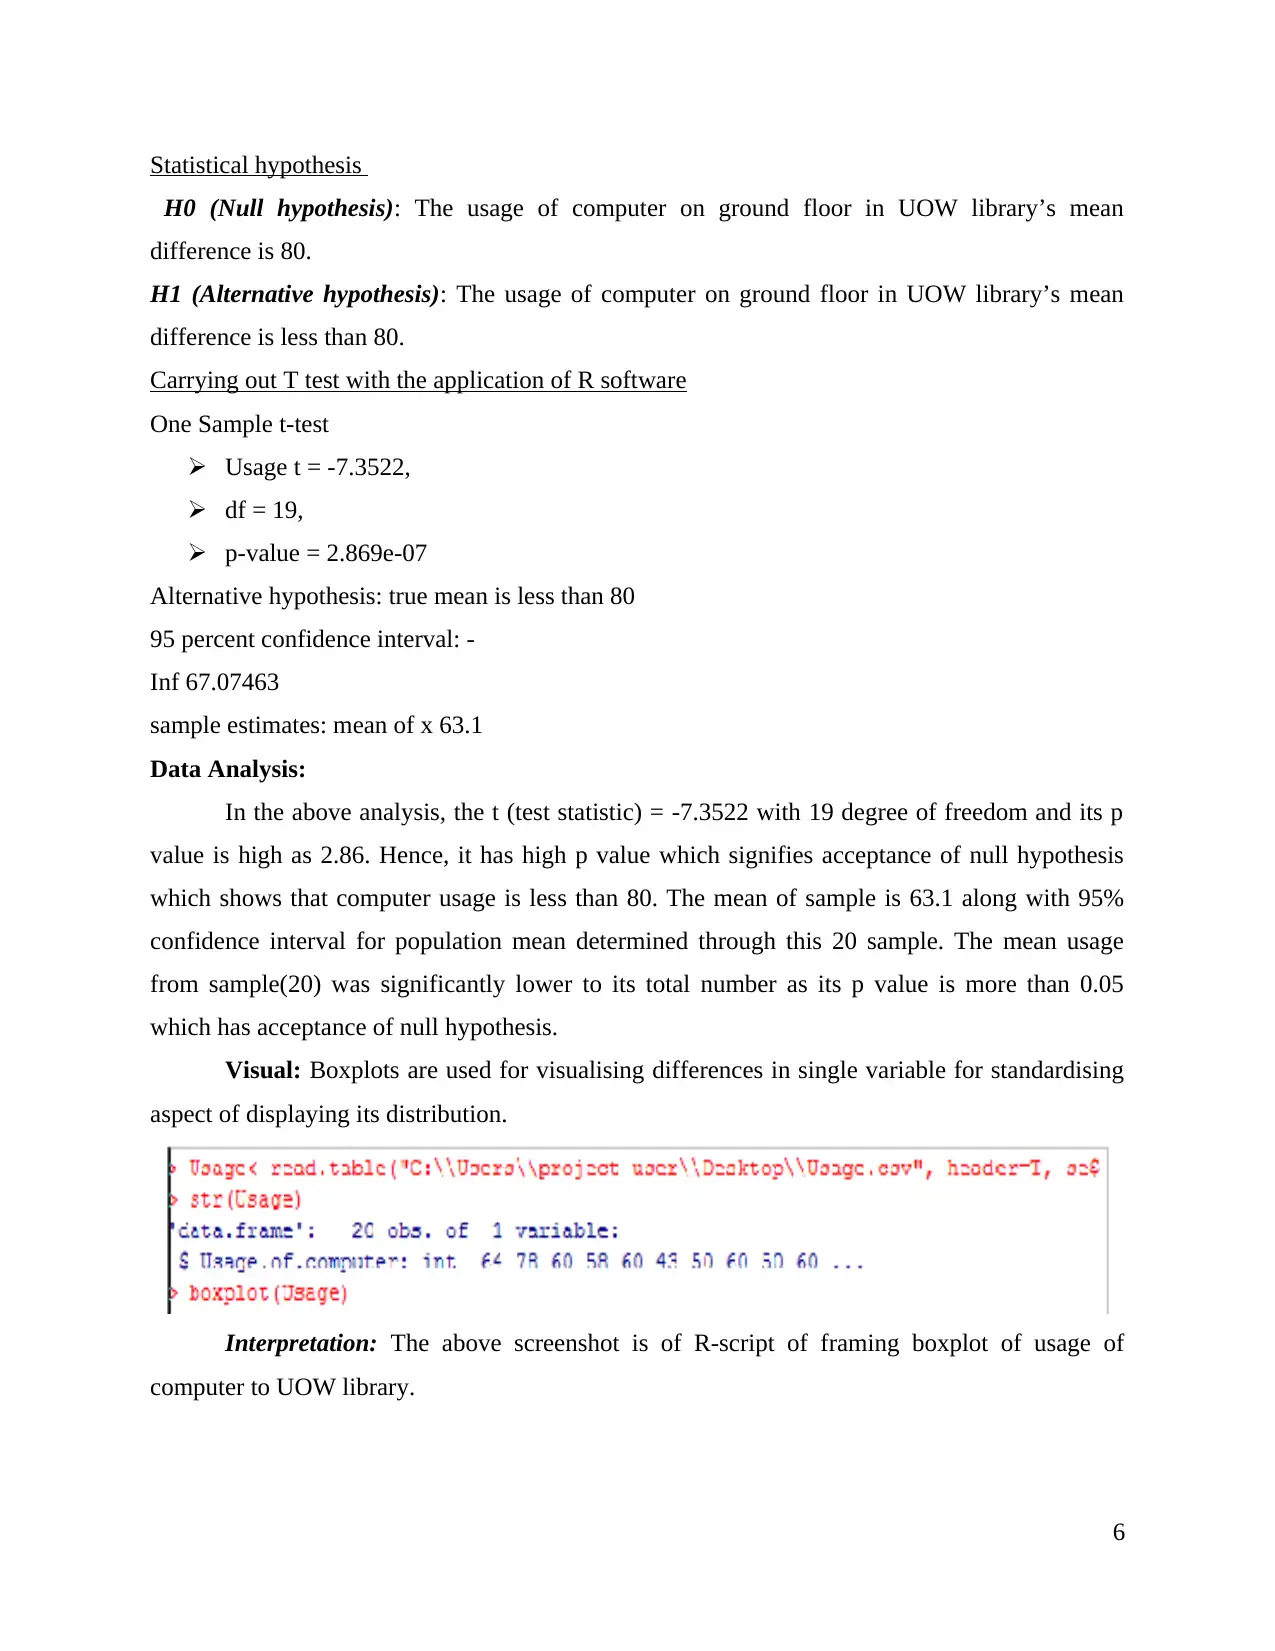
Visual: Boxplots are used for visualising differences in single variable for standardising
aspect of displaying its distribution.
Interpretation: The above screenshot is of R-script of framing boxplot of usage of
computer to UOW library.
6
H0 (Null hypothesis): The usage of computer on ground floor in UOW library’s mean
difference is 80.
H1 (Alternative hypothesis): The usage of computer on ground floor in UOW library’s mean
difference is less than 80.
Carrying out T test with the application of R software
One Sample t-test
Usage t = -7.3522,
df = 19,
p-value = 2.869e-07
Alternative hypothesis: true mean is less than 80
95 percent confidence interval: -
Inf 67.07463
sample estimates: mean of x 63.1
Data Analysis:
In the above analysis, the t (test statistic) = -7.3522 with 19 degree of freedom and its p
value is high as 2.86. Hence, it has high p value which signifies acceptance of null hypothesis
which shows that computer usage is less than 80. The mean of sample is 63.1 along with 95%
confidence interval for population mean determined through this 20 sample. The mean usage
from sample(20) was significantly lower to its total number as its p value is more than 0.05
which has acceptance of null hypothesis.
Visual: Boxplots are used for visualising differences in single variable for standardising
aspect of displaying its distribution.
Interpretation: The above screenshot is of R-script of framing boxplot of usage of
computer to UOW library.
6
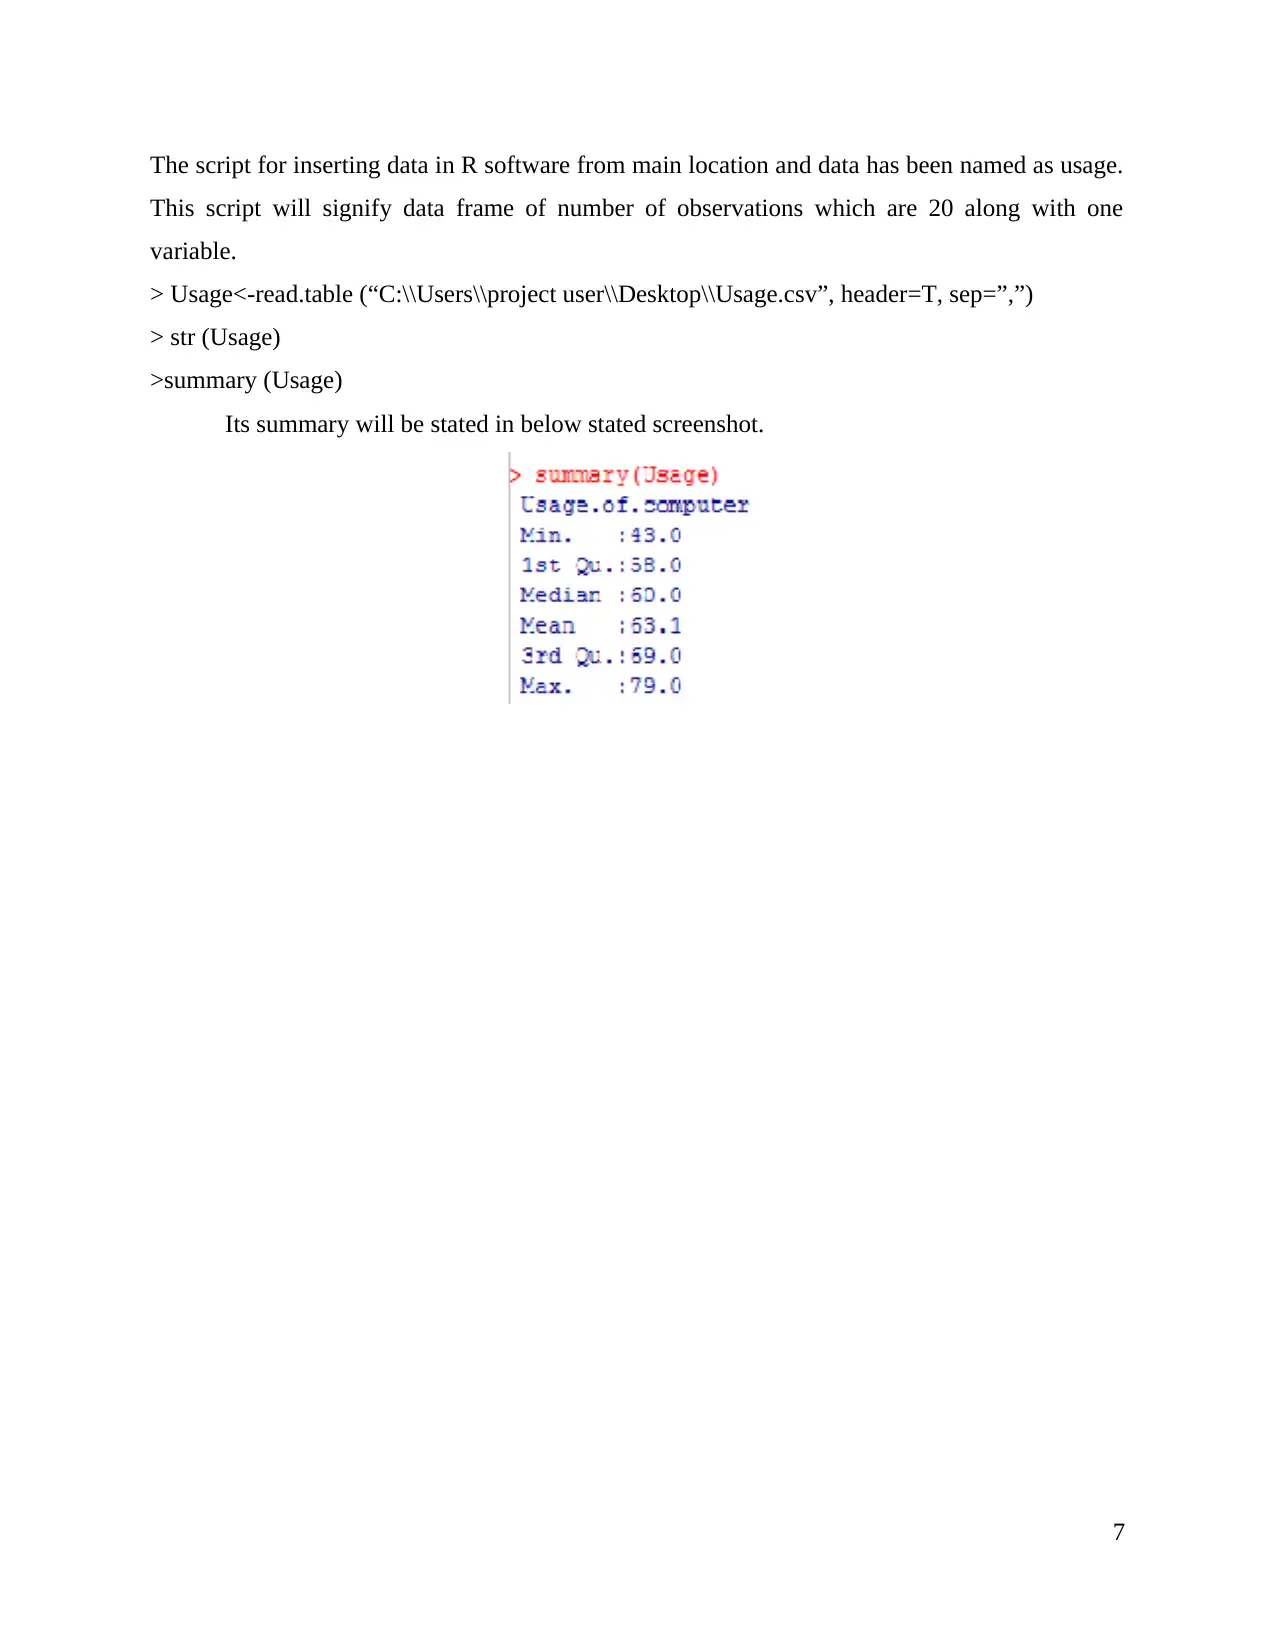
The script for inserting data in R software from main location and data has been named as usage.
This script will signify data frame of number of observations which are 20 along with one
variable.
> Usage<-read.table (“C:\\Users\\project user\\Desktop\\Usage.csv”, header=T, sep=”,”)
> str (Usage)
>summary (Usage)
Its summary will be stated in below stated screenshot.
7
This script will signify data frame of number of observations which are 20 along with one
variable.
> Usage<-read.table (“C:\\Users\\project user\\Desktop\\Usage.csv”, header=T, sep=”,”)
> str (Usage)
>summary (Usage)
Its summary will be stated in below stated screenshot.
7
⊘ This is a preview!⊘
Do you want full access?
Subscribe today to unlock all pages.
Trusted by 1+ million students worldwide
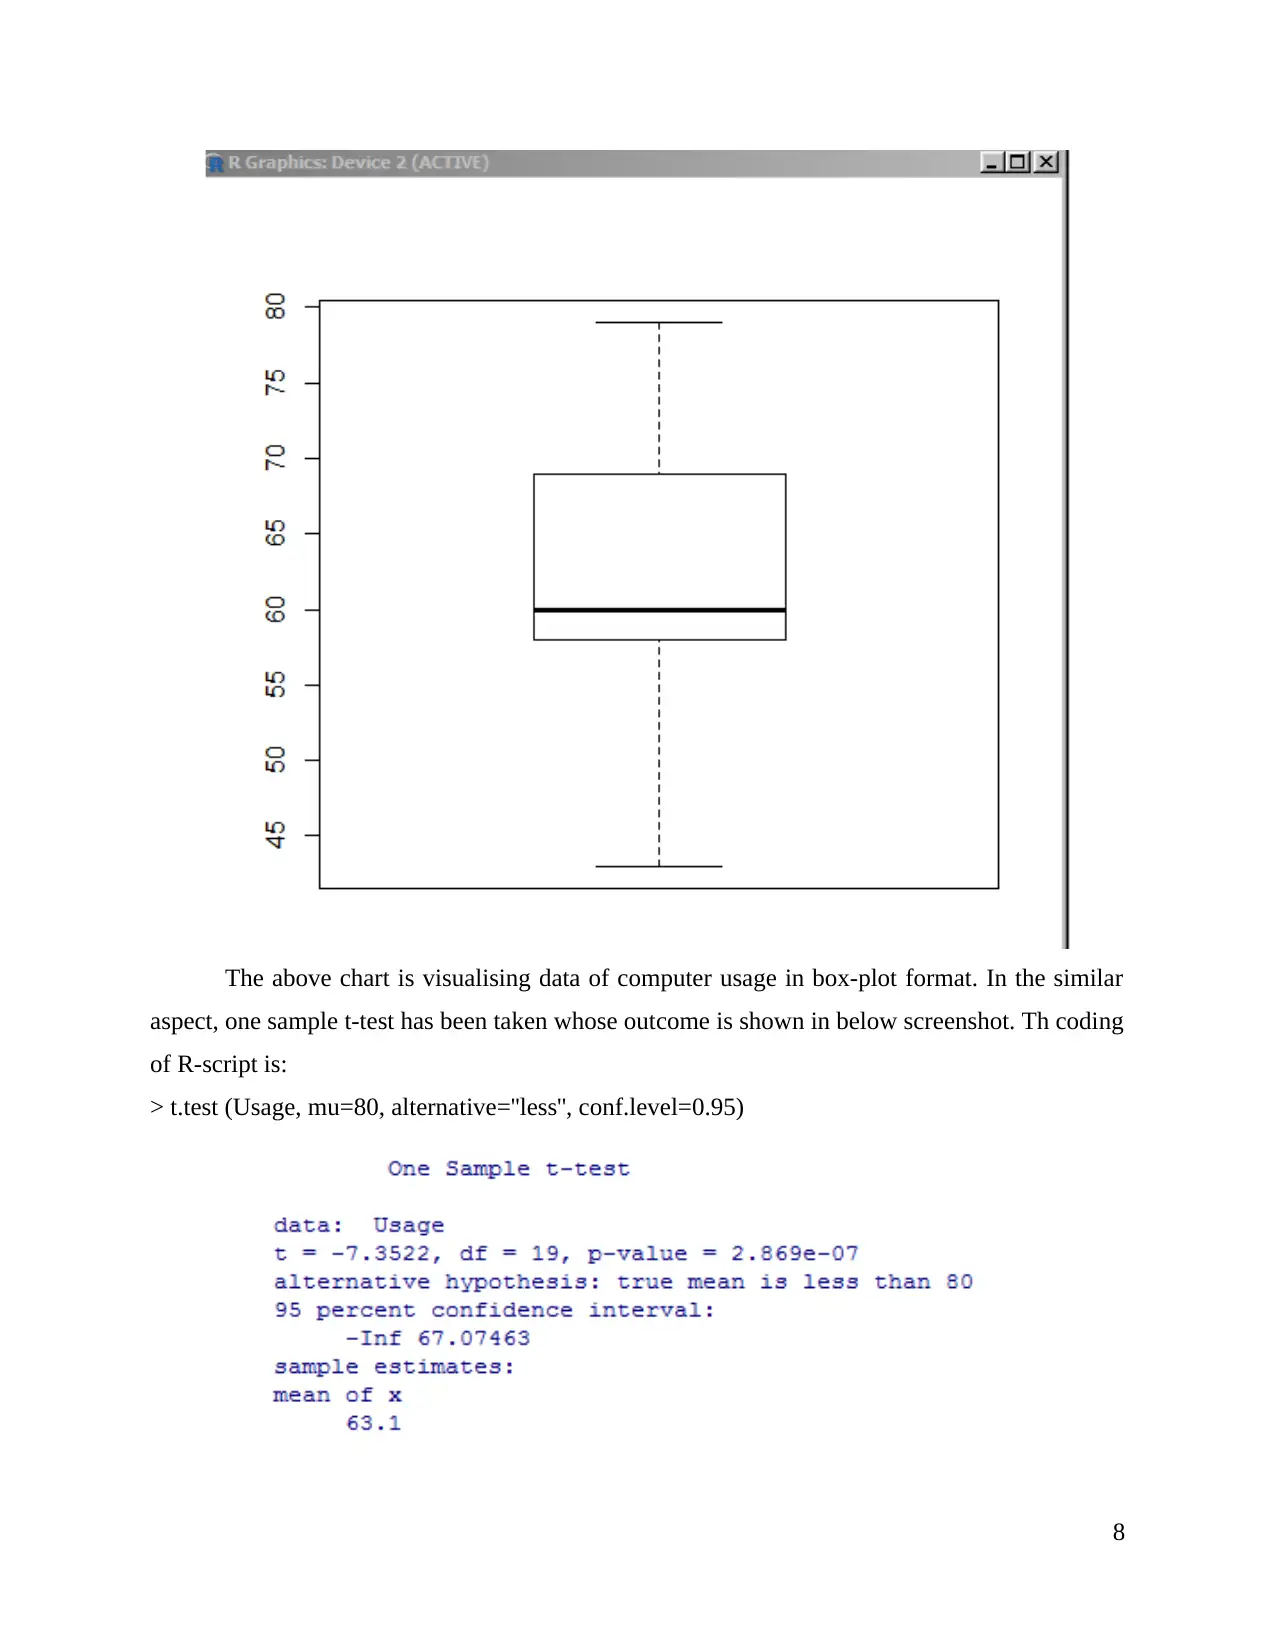
The above chart is visualising data of computer usage in box-plot format. In the similar
aspect, one sample t-test has been taken whose outcome is shown in below screenshot. Th coding
of R-script is:
> t.test (Usage, mu=80, alternative=''less'', conf.level=0.95)
8
aspect, one sample t-test has been taken whose outcome is shown in below screenshot. Th coding
of R-script is:
> t.test (Usage, mu=80, alternative=''less'', conf.level=0.95)
8
Paraphrase This Document
Need a fresh take? Get an instant paraphrase of this document with our AI Paraphraser
Research findings and conclusion
Through my observation of 20 users, I find that they are using computer for gaining
knowledge and sufficient for present scenario. The UOW library has total 80 computers which
are optimised in appropriate format. With context of findings of research of selected sample has
1 variable with 20 observations whose class(R script) is data-frame. The minimum and
maximum range of sample is 43 and 79 respectively. The data collected from primary sources
has median of 60 which is replicated in box plot in this research paper. In the similar aspect, the
average of sample is 63.1 which is less than total number of computers in library. While
observing, summary of dataset (Usage) has specified 1st and 2nd quartile as 58 and 69 which
specifies spread of data set into quarters, similar to breaking median in its half. According to this
research, it had been concluded that at 11:30 AM there is huge traffic for computer usage and it
also raises standards as implications and there is no need of placing more computers in library as
they are sufficient enough.
9
REFERENCES
Books and Journals
Ledford, J. R. and Gast, D. L., 2018. Single case research methodology: Applications in special
education and behavioral sciences. Routledge.
Lincoln, N. K., Messa, J. D. and Stone, S. D., International Business Machines Corp,
2018. Analysis of application programming interface usage for improving a computer
system. U.S. Patent Application 15/409,663.
Malti, T. and et.al., 2018. Innovation and Integrity in Intervention Research: Conceptual Issues,
Methodology, and Knowledge Translation. Prevention Science. 19(3). pp.271-273.
McGee, M., 2018. Case for omitting tied observations in the two-sample t-test and the Wilcoxon-
Mann-Whitney Test. PloS one. 13(7). p.e0200837.
Mowatt, L. and et.al, 2018. Computer vision syndrome and ergonomic practices among
undergraduate university students. International journal of clinical practice. 72(1).
p.e13035.
Tourangeau, R., 2018. Choosing a Mode of Survey Data Collection. In The Palgrave Handbook
of Survey Research(pp. 43-50). Palgrave Macmillan, Cham.
Wang, N., Gao, X. and Li, J., 2018. Random sampling for fast face sketch synthesis. Pattern
Recognition. 76. pp.215-227.
10
⊘ This is a preview!⊘
Do you want full access?
Subscribe today to unlock all pages.
Trusted by 1+ million students worldwide
1 out of 12
Related Documents


Your All-in-One AI-Powered Toolkit for Academic Success.
+13062052269
info@desklib.com
Available 24*7 on WhatsApp / Email
![[object Object]](/_next/static/media/star-bottom.7253800d.svg)
Unlock your academic potential
Copyright © 2020–2026 A2Z Services. All Rights Reserved. Developed and managed by ZUCOL.