Construction Delay Analysis: A Quantitative Study of Public Projects
VerifiedAdded on 2023/01/11
|9
|3775
|94
Report
AI Summary
This report, published in the International Journal of Project Management, presents a quantitative analysis of construction delays in 130 public projects in Jordan. The study investigates various factors contributing to project delays, including design issues, user changes, weather conditions, site issues, late deliveries, economic factors, and quantity increases. The research highlights that the majority of projects experienced delays, with poor design and change orders being the most significant causes. The analysis, based on data from 1990-1997, reveals that the mean actual completion time exceeded the planned duration. The report emphasizes the importance of understanding these factors to minimize contract disputes and improve project management practices. The findings suggest that by paying special attention to the identified factors, industry practitioners can significantly reduce the risks associated with construction delays. The study employs statistical methods, including linear regression, to analyze the relationship between planned and actual project durations, providing valuable insights for construction managers.
Construction delay:a quantitative analysis
Ayman H. Al-Momani
Mu'tah University, Civil Engineering Department, Karak, Mu'tah, P.O. Box 7, Jordan
Abstract
Avoiding construction claims and disputes requires an understanding of the contractualterms and causes of claims.The dual
underlying theme of this paper is to investigate the causes of delays on 130 public projects in Jordan and to aid construction
managers in establishing adequate evaluation prior to the contract award using quantitative data.Projects investigated in this
study included residential,oce and administration buildings,schoolbuildings,medicalcenters and communication facilities.
Results ofthis study indicates the main causes ofdelay in construction ofpublic projects relate to designers,user changes,
weather,site conditions,late deliveries,economic conditions and increase in quantity.The presence ofthese factors have an
impact on the successful completion of the projects at the time contractually speci®ed. The ®ndings suggest that special atte
to factors identi®ed in this study willhelp industry practitioners in minimising the risk ofcontractdisputes.# 1999 Elsevier
Science Ltd and IPMA. All rights reserved.
Keywords: Construction management; Project planning; Construction delay; Dispute
1. Introduction
A vital section speci®ed in the construction contract
is the performance period or time of project execution,
which is established priorto bidding.The successful
execution ofconstruction projectsand keeping them
within estimated costand the prescribed schedules
depend on a methodology thatrequires sound engin-
eering judgment.[1]The construction sector is one of
the vitalsectors in the development process of Jordan.
The government contributes to the development of the
construction industry in severalways.However,there
are limitations and even draw backs to these eorts.
The time required to complete construction ofpublic
projects is frequently greater than the time speci®ed in
the contract.These `overruns'or time extensionsare
granted for many reasons,such as designer changes or
errors, user changes,weather and late deliveries.
Current constructionprojects are complex eorts
requiring the supportof the design and construction
profession.Therefore,a realistic time forprojectex-
ecution will decreasethe possibility of disputes
between state agency and the contractors.
1.1. Previous work
A great dealof information concerned with project
delay and overruns may be found in the literature. The
increased interestin construction overrunsis due, in
part,to eorts by the government to reduce construc-
tion delays.There has been a considerable and contin-
ued interestin the eect of construction delays.The
information available is diverse and widespread.Many
construction managementbooks[2±6]have minimum
coverage on construction delays. Al-Momani[7]
describe the various elements ofcost upon individual
public projects but does not dealspeci®cally with con-
struction delays.
Assaf and Al-khalil[8]outline the main causesof
delay in large building projects and their relative im-
portance.They found that56 causes ofdelay existin
Saudiconstruction projects.According to the contrac-
tors surveyed the mostimportantdelay factorswere
preparation and approvalof shop drawings,delays in
contractor's progress,paymentby owners and design
changes.The architects and engineers view were cash
problems during construction,the relationship between
subcontractors and the slow decision making process
International Journal of Project Management 18 (2000) 51±59
0263-7863/99/$20.00 # 1999 Elsevier Science Ltd and IPMA. All rights reserved.
PII: S 0 2 6 3 - 7 8 6 3 ( 9 8 ) 0 0 0 6 0 - X
www.elsevier.com/locate/ijproman
Paraphrase This Document
Need a fresh take? Get an instant paraphrase of this document with our AI Paraphraser
of the owner.The owners agree that the design errors,
labor shortages and inadequate labor skills are import-
ant delay factors. Hancher and Rowings,[1] for example,
provide a concise summary of the methodologies used
by transportation agencies to establish the contract dur-
ation used for highway construction projects,and also
provides a schedule guide for ®eld engineers during con-
struction. Similarly, Chalabi and Camp[10] conducted a
review on project delays in developing countries during
planning and construction stages.In their study they
found that the delay and cost overruns of construction
projects are dependent entirely on the very early stages
of the project. Fereig and Qaddumi[11] in their study on
the construction experience of the Arabian Gulf demon-
strate the various components of the planning, control-
ling and productivityon construction delay.Their
primary purpose is to alert the reader to the deviation
from the project plans.
Wilson[9]examined the role of the owner and archi-
tect/engineer's roles in the prevention and resolution of
constructionclaims. Wilson also summarisedthe
causesof constructionclaims which include: extra
work, project delays and acceleration,lack of manage-
ment, limited site access and change in work schedule.
Despite the necessity forsuch research,little work
has been described in the literature concerning public
projects,specially in Jordan.The previously proposed
factors contributing to construction delay werefre-
quently observed in publicprojects.The actualfre-
quency and magnitude ofthese factors is notknown,
which has proven to be a serious and very expensive
problem to Jordan's construction industry.
1.2. Research design and objectives
The objective of this study is to determine the causes
and the levelof time extension of public projects and
to aid construction managers in establishing adequate
evaluation prior to the contract award using quantitat-
ive data.The key task is to design research so that the
information obtained permitsthe assessmentof their
impact. Therefore,the best approach to assessing these
potentials is to adoptrandomly selected samples.The
sampling population was established by selecting 130
public projects constructedin dierent regions of
Jordan during the period of1990±97.The data was
found in contract®les ofseveralstate agencies.Data
collected were of 5 kinds of public projects:residential
houses of public ®gures,oce and administrative
buildings,schoolbuildings,medicalcenters and com-
munication facilities.The performance and construc-
tion of these projects were recognisedas being
unsatisfactory to many ocials,and assented to the
study in order to have hard evidence as to the nature
of the problems.This study willsummarise the results
of this research based on actualconstruction times ex-
perienced by public projects.The data collection was
to investigate the reasons related to construction delay
and overruns:
. Planned duration of contract;
. Actual completion date;
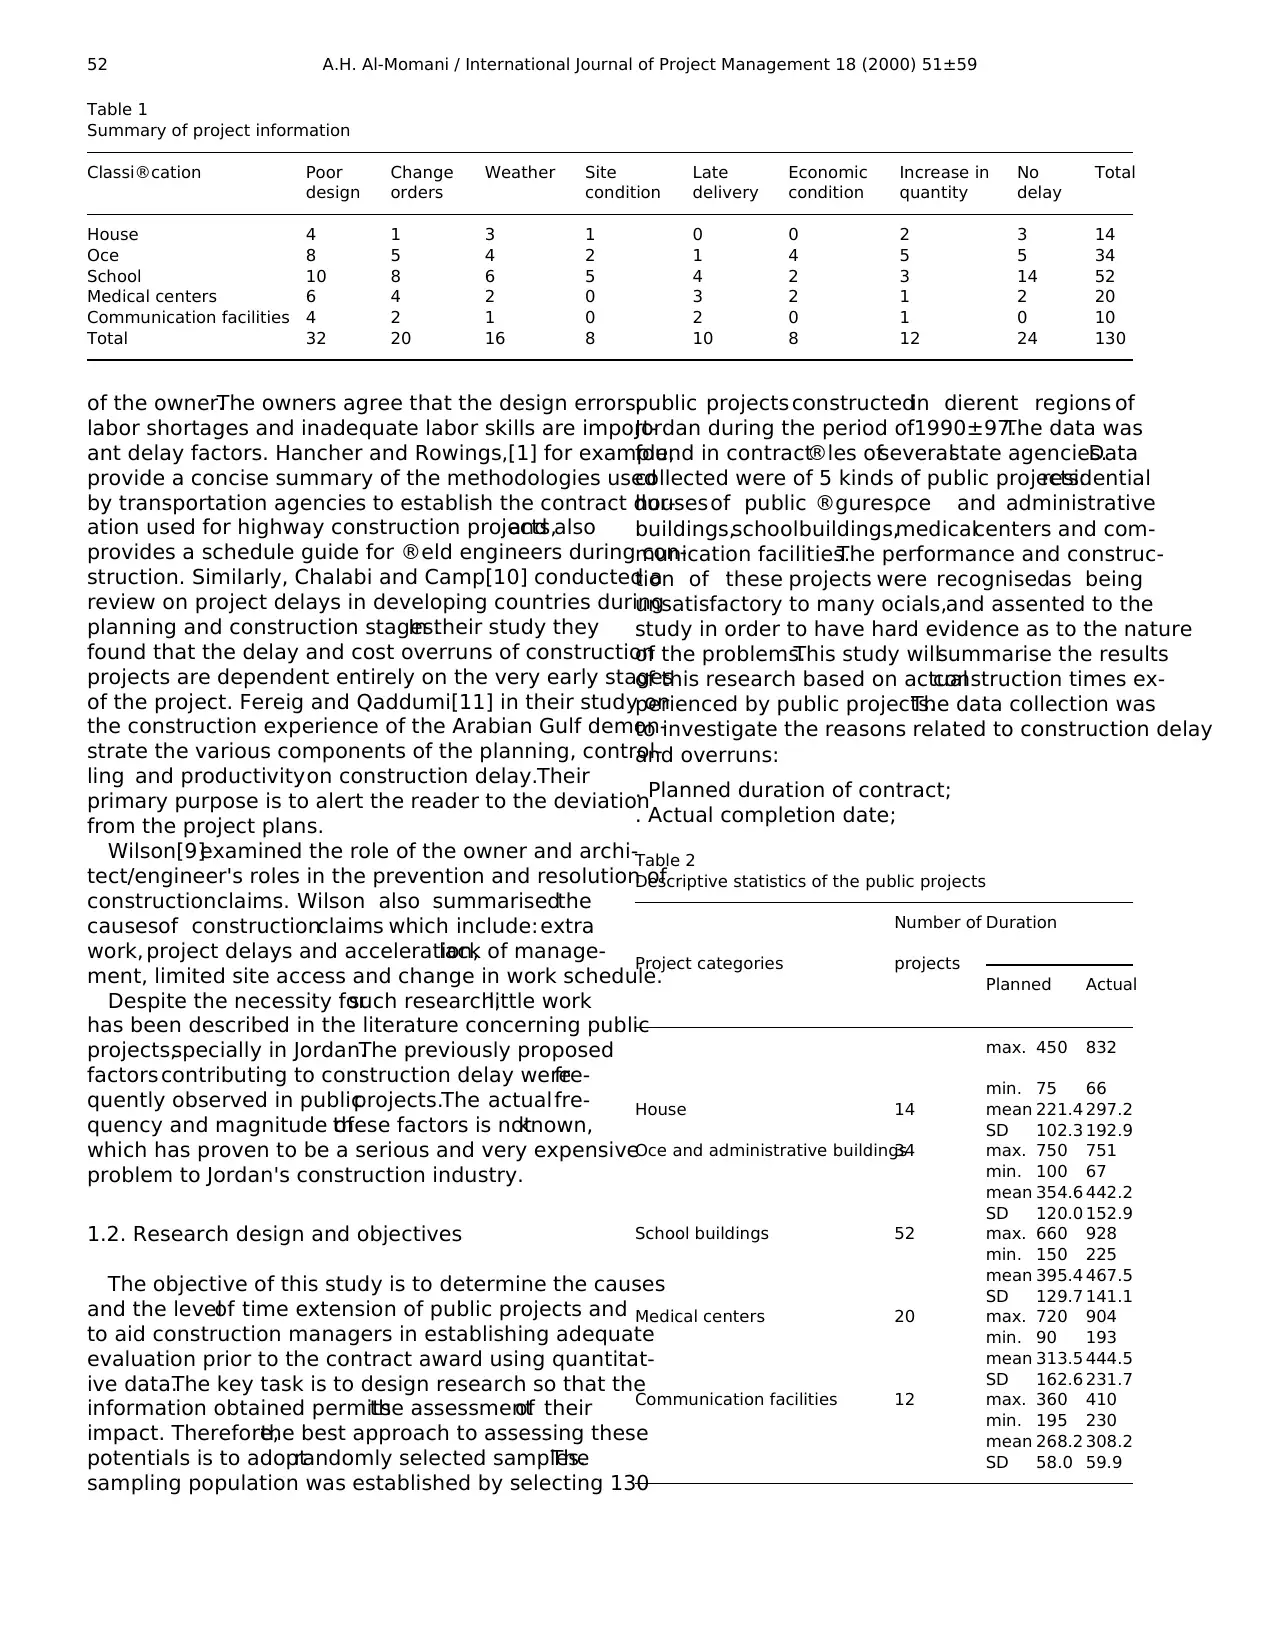
Table 1
Summary of project information
Classi®cation Poor
design
Change
orders
Weather Site
condition
Late
delivery
Economic
condition
Increase in
quantity
No
delay
Total
House 4 1 3 1 0 0 2 3 14
Oce 8 5 4 2 1 4 5 5 34
School 10 8 6 5 4 2 3 14 52
Medical centers 6 4 2 0 3 2 1 2 20
Communication facilities 4 2 1 0 2 0 1 0 10
Total 32 20 16 8 10 8 12 24 130
Table 2
Descriptive statistics of the public projects
Number of Duration
Project categories projects
Planned Actual
House 14
max. 450 832
min. 75 66
mean 221.4 297.2
SD 102.3 192.9
Oce and administrative buildings34 max. 750 751
min. 100 67
mean 354.6 442.2
SD 120.0 152.9
School buildings 52 max. 660 928
min. 150 225
mean 395.4 467.5
SD 129.7 141.1
Medical centers 20 max. 720 904
min. 90 193
mean 313.5 444.5
SD 162.6 231.7
Communication facilities 12 max. 360 410
min. 195 230
mean 268.2 308.2
SD 58.0 59.9
A.H. Al-Momani / International Journal of Project Management 18 (2000) 51±5952
labor shortages and inadequate labor skills are import-
ant delay factors. Hancher and Rowings,[1] for example,
provide a concise summary of the methodologies used
by transportation agencies to establish the contract dur-
ation used for highway construction projects,and also
provides a schedule guide for ®eld engineers during con-
struction. Similarly, Chalabi and Camp[10] conducted a
review on project delays in developing countries during
planning and construction stages.In their study they
found that the delay and cost overruns of construction
projects are dependent entirely on the very early stages
of the project. Fereig and Qaddumi[11] in their study on
the construction experience of the Arabian Gulf demon-
strate the various components of the planning, control-
ling and productivityon construction delay.Their
primary purpose is to alert the reader to the deviation
from the project plans.
Wilson[9]examined the role of the owner and archi-
tect/engineer's roles in the prevention and resolution of
constructionclaims. Wilson also summarisedthe
causesof constructionclaims which include: extra
work, project delays and acceleration,lack of manage-
ment, limited site access and change in work schedule.
Despite the necessity forsuch research,little work
has been described in the literature concerning public
projects,specially in Jordan.The previously proposed
factors contributing to construction delay werefre-
quently observed in publicprojects.The actualfre-
quency and magnitude ofthese factors is notknown,
which has proven to be a serious and very expensive
problem to Jordan's construction industry.
1.2. Research design and objectives
The objective of this study is to determine the causes
and the levelof time extension of public projects and
to aid construction managers in establishing adequate
evaluation prior to the contract award using quantitat-
ive data.The key task is to design research so that the
information obtained permitsthe assessmentof their
impact. Therefore,the best approach to assessing these
potentials is to adoptrandomly selected samples.The
sampling population was established by selecting 130
public projects constructedin dierent regions of
Jordan during the period of1990±97.The data was
found in contract®les ofseveralstate agencies.Data
collected were of 5 kinds of public projects:residential
houses of public ®gures,oce and administrative
buildings,schoolbuildings,medicalcenters and com-
munication facilities.The performance and construc-
tion of these projects were recognisedas being
unsatisfactory to many ocials,and assented to the
study in order to have hard evidence as to the nature
of the problems.This study willsummarise the results
of this research based on actualconstruction times ex-
perienced by public projects.The data collection was
to investigate the reasons related to construction delay
and overruns:
. Planned duration of contract;
. Actual completion date;
Table 1
Summary of project information
Classi®cation Poor
design
Change
orders
Weather Site
condition
Late
delivery
Economic
condition
Increase in
quantity
No
delay
Total
House 4 1 3 1 0 0 2 3 14
Oce 8 5 4 2 1 4 5 5 34
School 10 8 6 5 4 2 3 14 52
Medical centers 6 4 2 0 3 2 1 2 20
Communication facilities 4 2 1 0 2 0 1 0 10
Total 32 20 16 8 10 8 12 24 130
Table 2
Descriptive statistics of the public projects
Number of Duration
Project categories projects
Planned Actual
House 14
max. 450 832
min. 75 66
mean 221.4 297.2
SD 102.3 192.9
Oce and administrative buildings34 max. 750 751
min. 100 67
mean 354.6 442.2
SD 120.0 152.9
School buildings 52 max. 660 928
min. 150 225
mean 395.4 467.5
SD 129.7 141.1
Medical centers 20 max. 720 904
min. 90 193
mean 313.5 444.5
SD 162.6 231.7
Communication facilities 12 max. 360 410
min. 195 230
mean 268.2 308.2
SD 58.0 59.9
A.H. Al-Momani / International Journal of Project Management 18 (2000) 51±5952
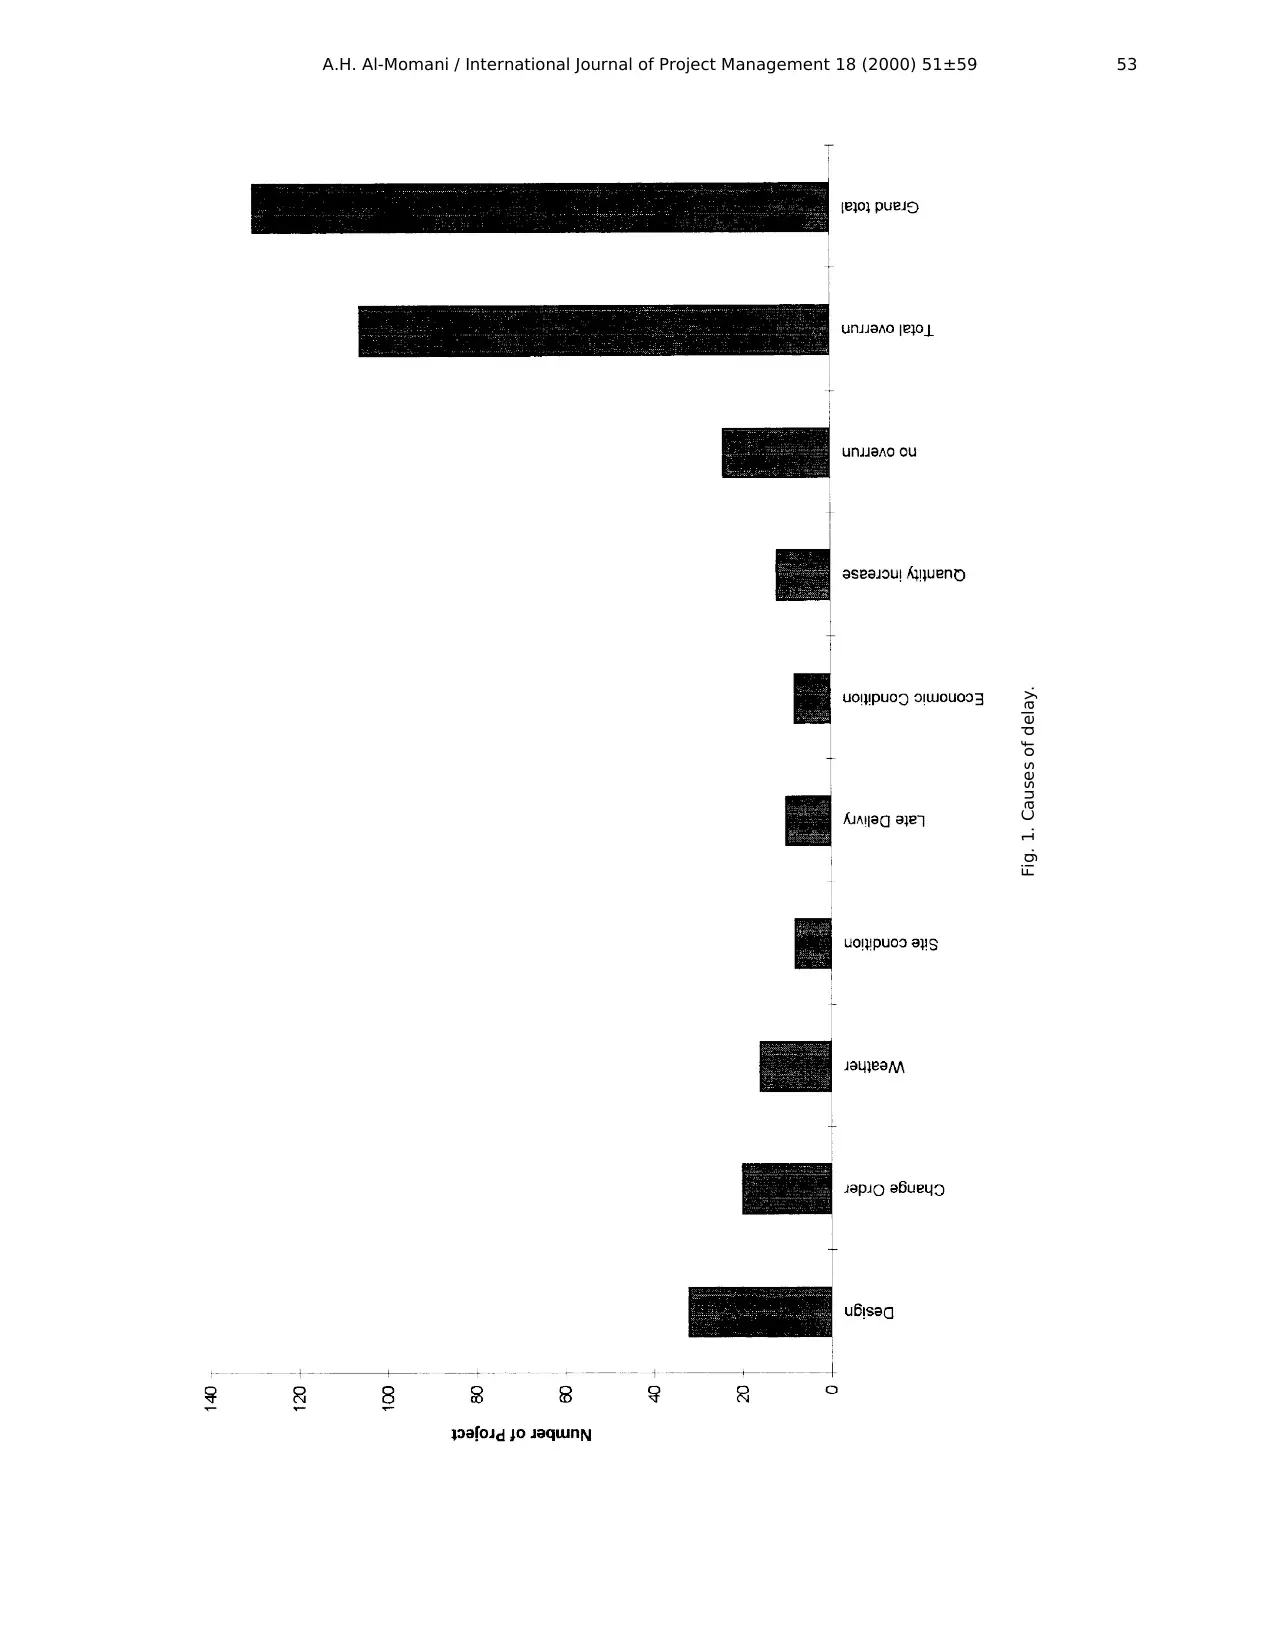
Fig. 1. Causes of delay.
A.H. Al-Momani / International Journal of Project Management 18 (2000) 51±59 53
A.H. Al-Momani / International Journal of Project Management 18 (2000) 51±59 53
⊘ This is a preview!⊘
Do you want full access?
Subscribe today to unlock all pages.
Trusted by 1+ million students worldwide
. Design changes;
. Disputes;
. Noti®cation of extra work;
. Date of notice to proceed;
. Delay encountered during construction;
. Con¯ict of the drawings and speci®cations;
. Time extensions;
. Late delivery of materials and equipment.
2. Discussions
The data were entered into Excel5 where allanaly-
sis and diagrams were developed.The ®rst step was to
explore the parameters as to causes ofdelay.To this
eect, parameterswere de®ned and constructed in
Table 1 for public projects.These restrictions create a
sample with 130 projects.The table provide frequen-
ciesfor each parameterin ®ve dierent construction
categories.Many projects were delayedfor many
reasons.All extensionsto the planned schedule were
considered as delays.The major causes identi®ed were:
poor design,change orders,weather,site conditions,
late delivery,economicconditionsand increasein
quantity.A breakdown of the projects by these par-
ameters is graphically illustrated in Fig.1. The overall
delays were in 106 outof 130 (81.5%)projects.The
main causes for delays were poor design in 32 projects
(24.6%),while the second cause was the change orders
in 20 projects(15.4%).The site conditionsand the
economic conditions were the least cause of delay and
were found in 8 projects.
2.1. Planned and actual duration
The mean actualduration for allpublic projects was
426.6 days,and a standard deviation of137 days.
While the planned duration for the same projects was
343.1 days in mean, with a standard deviation of 137.4
days. The mean,maximum,minimum and standard
deviation for the planned and actualtime were com-
puted as shown in Table 2 for ®veprojectclassi®-
cations.It can be noticed that the actualtime for each
type of project vary considerably.This is illustrated by
large dierences between the means of the planned and
Fig. 2. Scatter plot of actual time Y versus planned time X for general model of public projects.
A.H. Al-Momani / International Journal of Project Management 18 (2000) 51±5954
Paraphrase This Document
Need a fresh take? Get an instant paraphrase of this document with our AI Paraphraser
actualtimes and the high values of standard deviation.
For instance,the mean planned time for schoolbuild-
ings varied from 395.4 days to an actual of 467.5 days,
while the oce and adminstrativebuildingsvaried
from 354.6 planned days to 442.2 actualdays.The im-
plication is therefore,that on averageduring the
sample period,the planned and actualduration was
upward sloping. Standard deviation are reported
which suggestthat the variance ofthe actualtime is
considerably greaterthan that of the planned time,
with the varianceof the actualtime being approxi-
mately 29 444.67 days and the variance of the planned
time being approximately 18 894 days.
A mathematicalstructurewas studied by dierent
functionsthat ®tsthe data,which indicated thatthe
simple linear regressionappearsto be appropriate
for this type of problem.The speci®cation ofour
model is determinedby one independentvariable
which signi®cantlyexplainedvariations in the re-
sponse variable. Correlation coecients were used
for screeningthe variables.Severalstatisticaltests
were conducted.Each of these was performedat
99% con®dence level.It was assumed thatboth the
actual and planned timesdistributionswere normal
and independently distributed.
3. Tests and results
Simple linearregression developsan equation that
describesthe relationship between two variables.In
this case the equation takes the form of:
Y b 0 b 1X e
In this modelY is the dependentvariable,the par-
ameters,b0 and b1 are the coecients which are
unknown and are to be estimated.X is the indepen-
dent variable,and e is a random errorwhich is the
amount of variation in Y not accounted for by the lin-
ear relationship.The theoreticalmodelsare derived
and explained in the following.
For a comparison ofthe actualand planned time
distribution,the equation developed for overallpublic
projects is:
Y 82:87 1:0016x
R2 0:64
D:W: 1:58 R 0:80 S:E: 102:8 F ÿ value
231:25
1
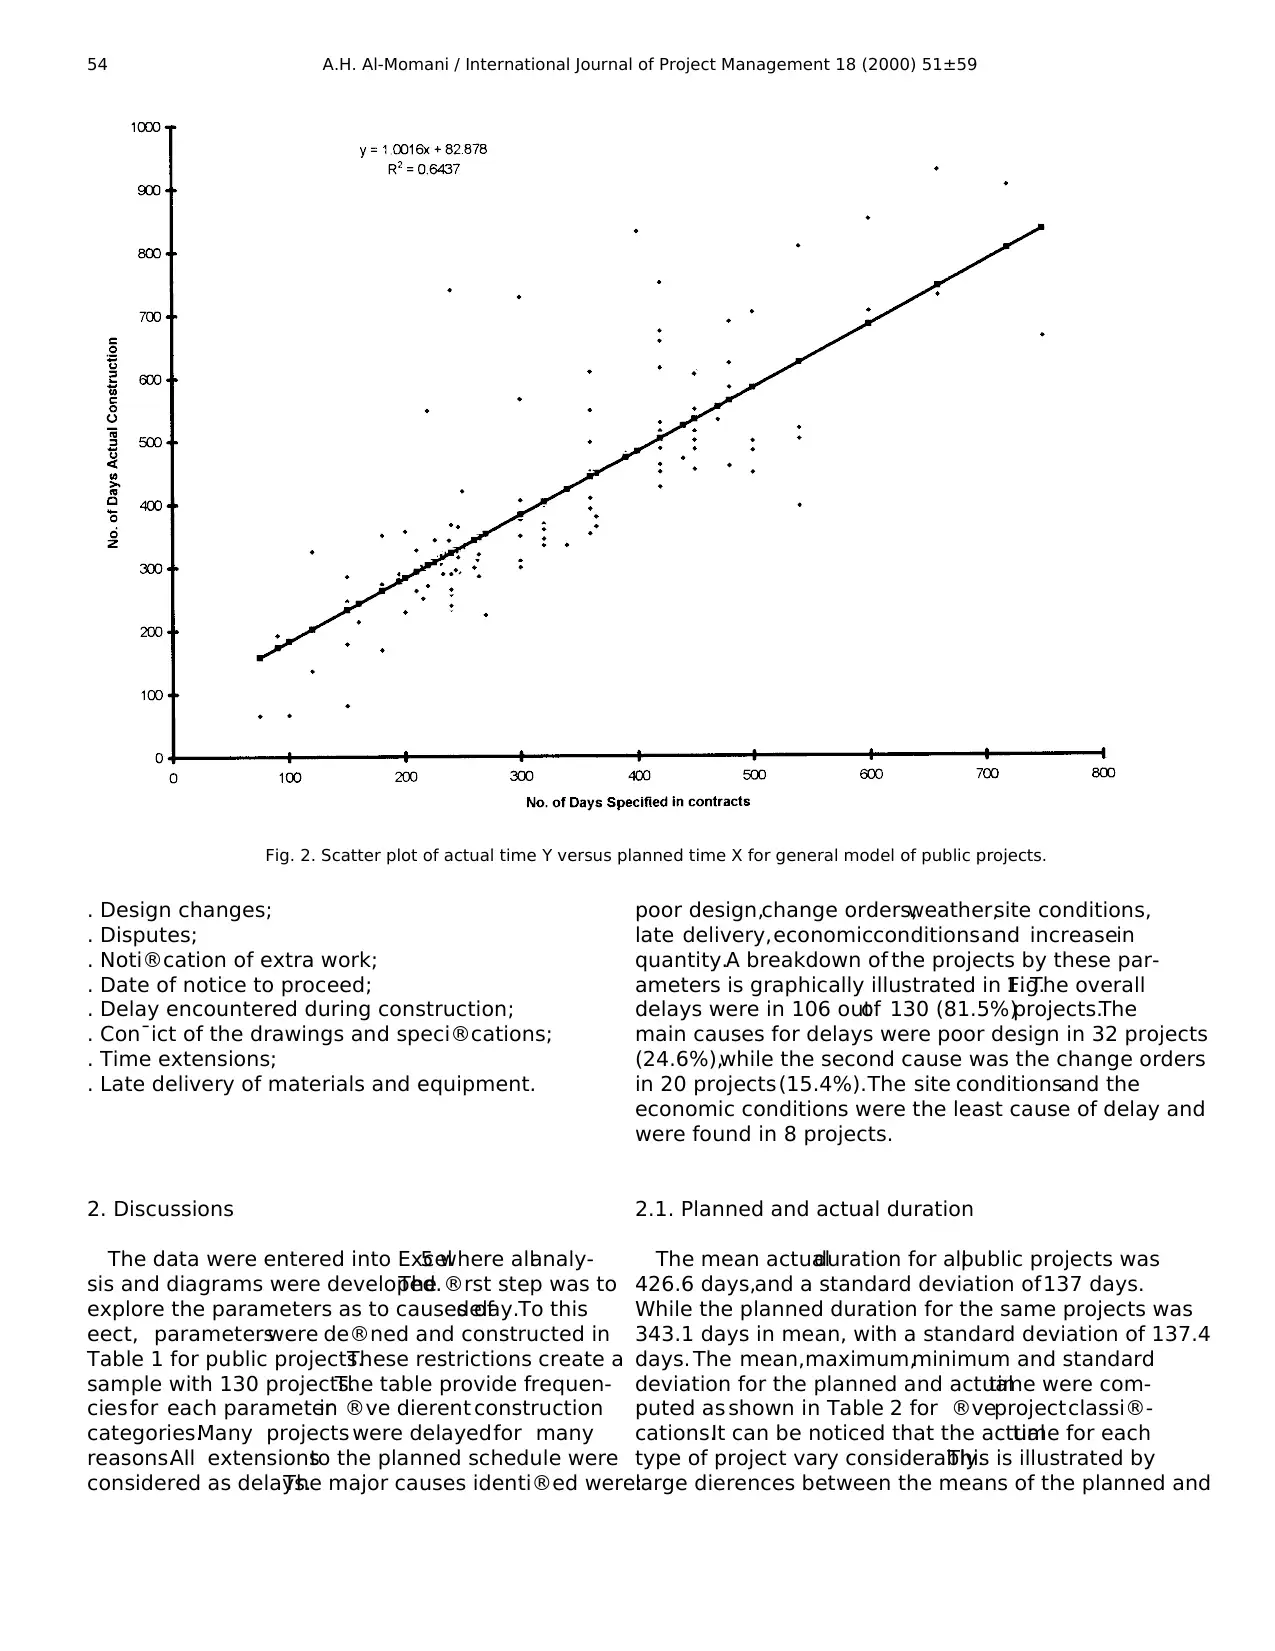
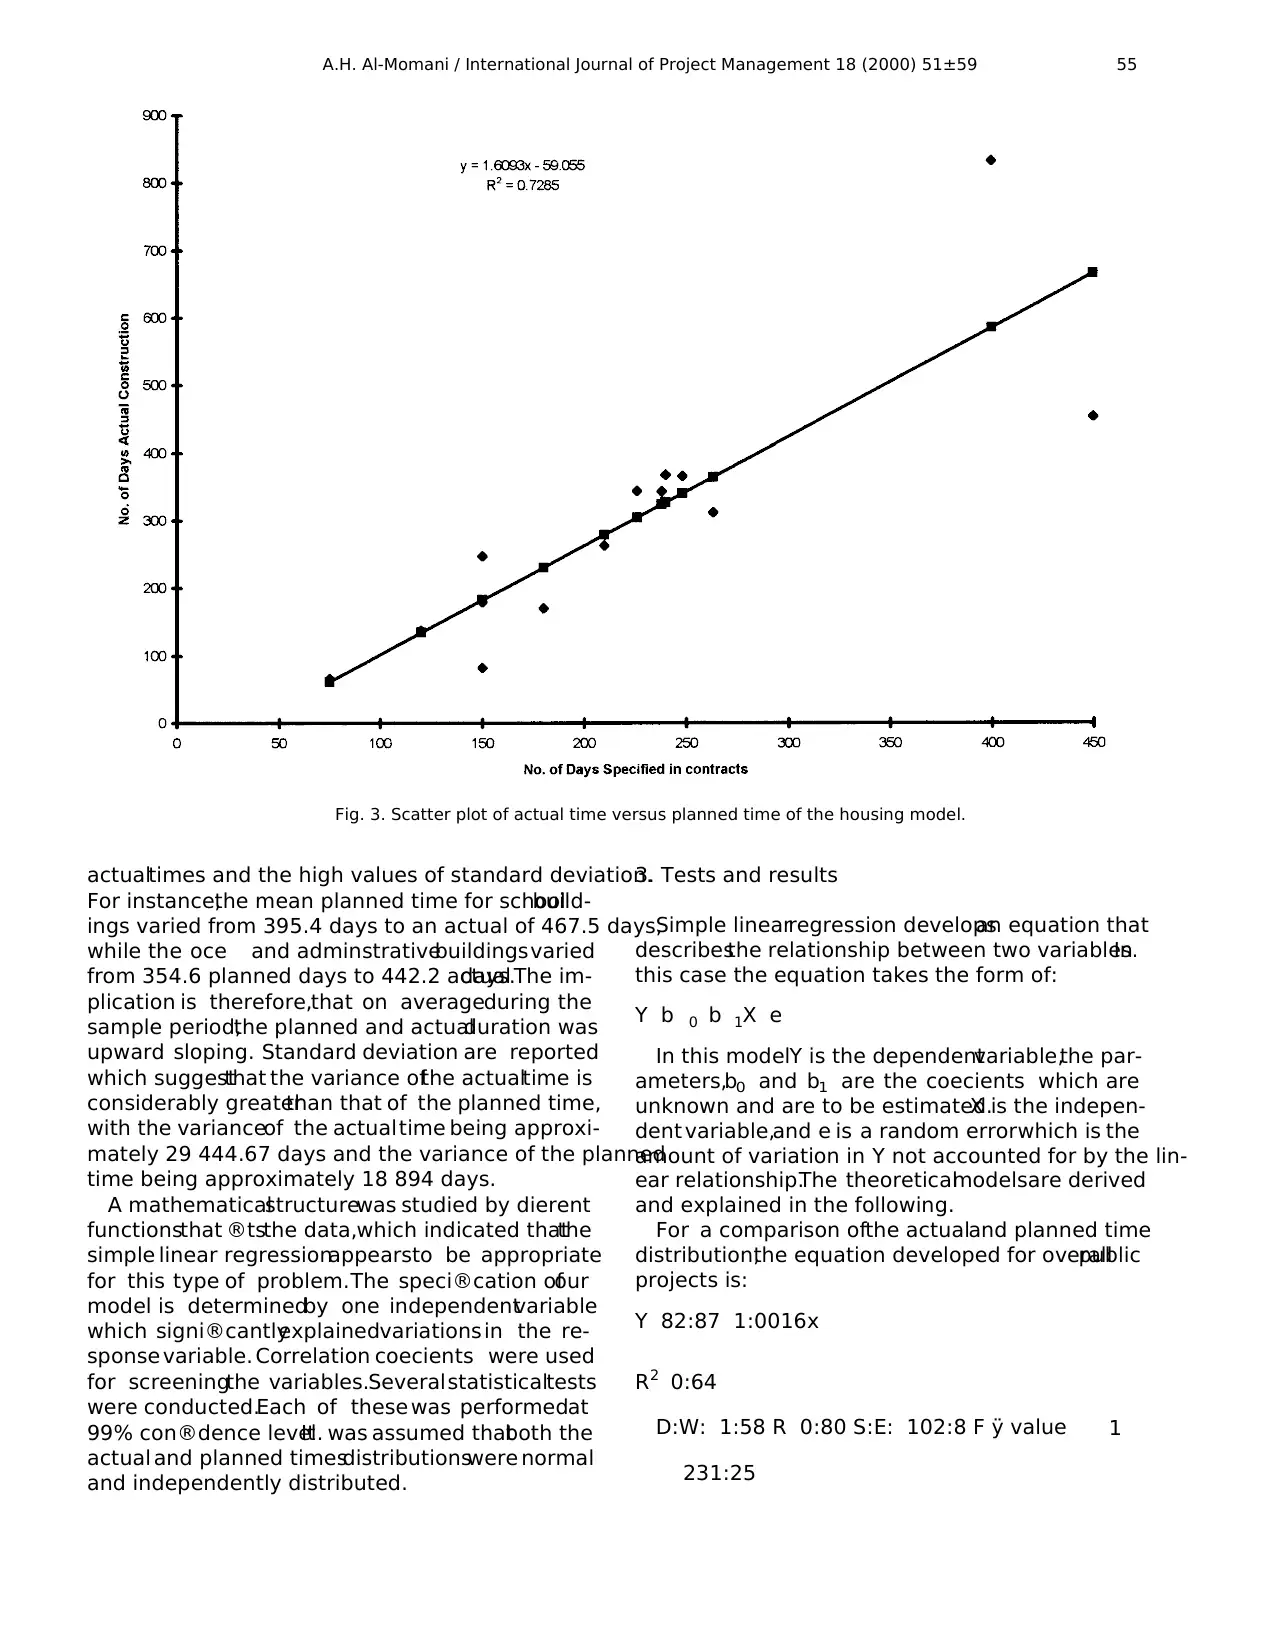
Fig. 3. Scatter plot of actual time versus planned time of the housing model.
A.H. Al-Momani / International Journal of Project Management 18 (2000) 51±59 55
For instance,the mean planned time for schoolbuild-
ings varied from 395.4 days to an actual of 467.5 days,
while the oce and adminstrativebuildingsvaried
from 354.6 planned days to 442.2 actualdays.The im-
plication is therefore,that on averageduring the
sample period,the planned and actualduration was
upward sloping. Standard deviation are reported
which suggestthat the variance ofthe actualtime is
considerably greaterthan that of the planned time,
with the varianceof the actualtime being approxi-
mately 29 444.67 days and the variance of the planned
time being approximately 18 894 days.
A mathematicalstructurewas studied by dierent
functionsthat ®tsthe data,which indicated thatthe
simple linear regressionappearsto be appropriate
for this type of problem.The speci®cation ofour
model is determinedby one independentvariable
which signi®cantlyexplainedvariations in the re-
sponse variable. Correlation coecients were used
for screeningthe variables.Severalstatisticaltests
were conducted.Each of these was performedat
99% con®dence level.It was assumed thatboth the
actual and planned timesdistributionswere normal
and independently distributed.
3. Tests and results
Simple linearregression developsan equation that
describesthe relationship between two variables.In
this case the equation takes the form of:
Y b 0 b 1X e
In this modelY is the dependentvariable,the par-
ameters,b0 and b1 are the coecients which are
unknown and are to be estimated.X is the indepen-
dent variable,and e is a random errorwhich is the
amount of variation in Y not accounted for by the lin-
ear relationship.The theoreticalmodelsare derived
and explained in the following.
For a comparison ofthe actualand planned time
distribution,the equation developed for overallpublic
projects is:
Y 82:87 1:0016x
R2 0:64
D:W: 1:58 R 0:80 S:E: 102:8 F ÿ value
231:25
1
Fig. 3. Scatter plot of actual time versus planned time of the housing model.
A.H. Al-Momani / International Journal of Project Management 18 (2000) 51±59 55
The correlation coecient for this relationship is
0.80 indicating thatthe distribution ofplanned time
mirrors the actual time with a high degree of accuracy.
The calculated F is 231.25,the higher absolute value
of the F-statistics reported may re¯ect the observation
that are powerfulpredictorsof the measured data.
Therefore, true linearity exists in the developed model.
Comparing samplemeansto test the agreement
between thetwo distribution wasemployed.In this
case the t-statistic is 9.28 which is much larger than t-
value of 1.97,giving furtherproof of the agreement
between the two distributions.The generalmodelis
valuablein that it providesa universalmodel of
phenomena and would primarily be of interest to con-
struction ocials. The predictiveequation hasbeen
developed as an aggregate modelfor actualconstruc-
tion time of a public projects.
In this setting,more speci®c modelssuch as Eqs.
(2)±(6)were developed,which exhibited a reasonable
®tto the data.Figures2±7 give a graphicalview of
how well the charts relate the actualtime by project
type to the planned time.Speci®c models are prefer-
able and would be ofparticular interestto construc-
tion managers and practitioners ratherthan selection
of the generalmodel.The ®tted equations are as fol-
lows:
3.1. Housing project
Y 59:05 1:6X
R 0:853 R 2 073 S:E: 104:62 F ÿ value
32:19 2
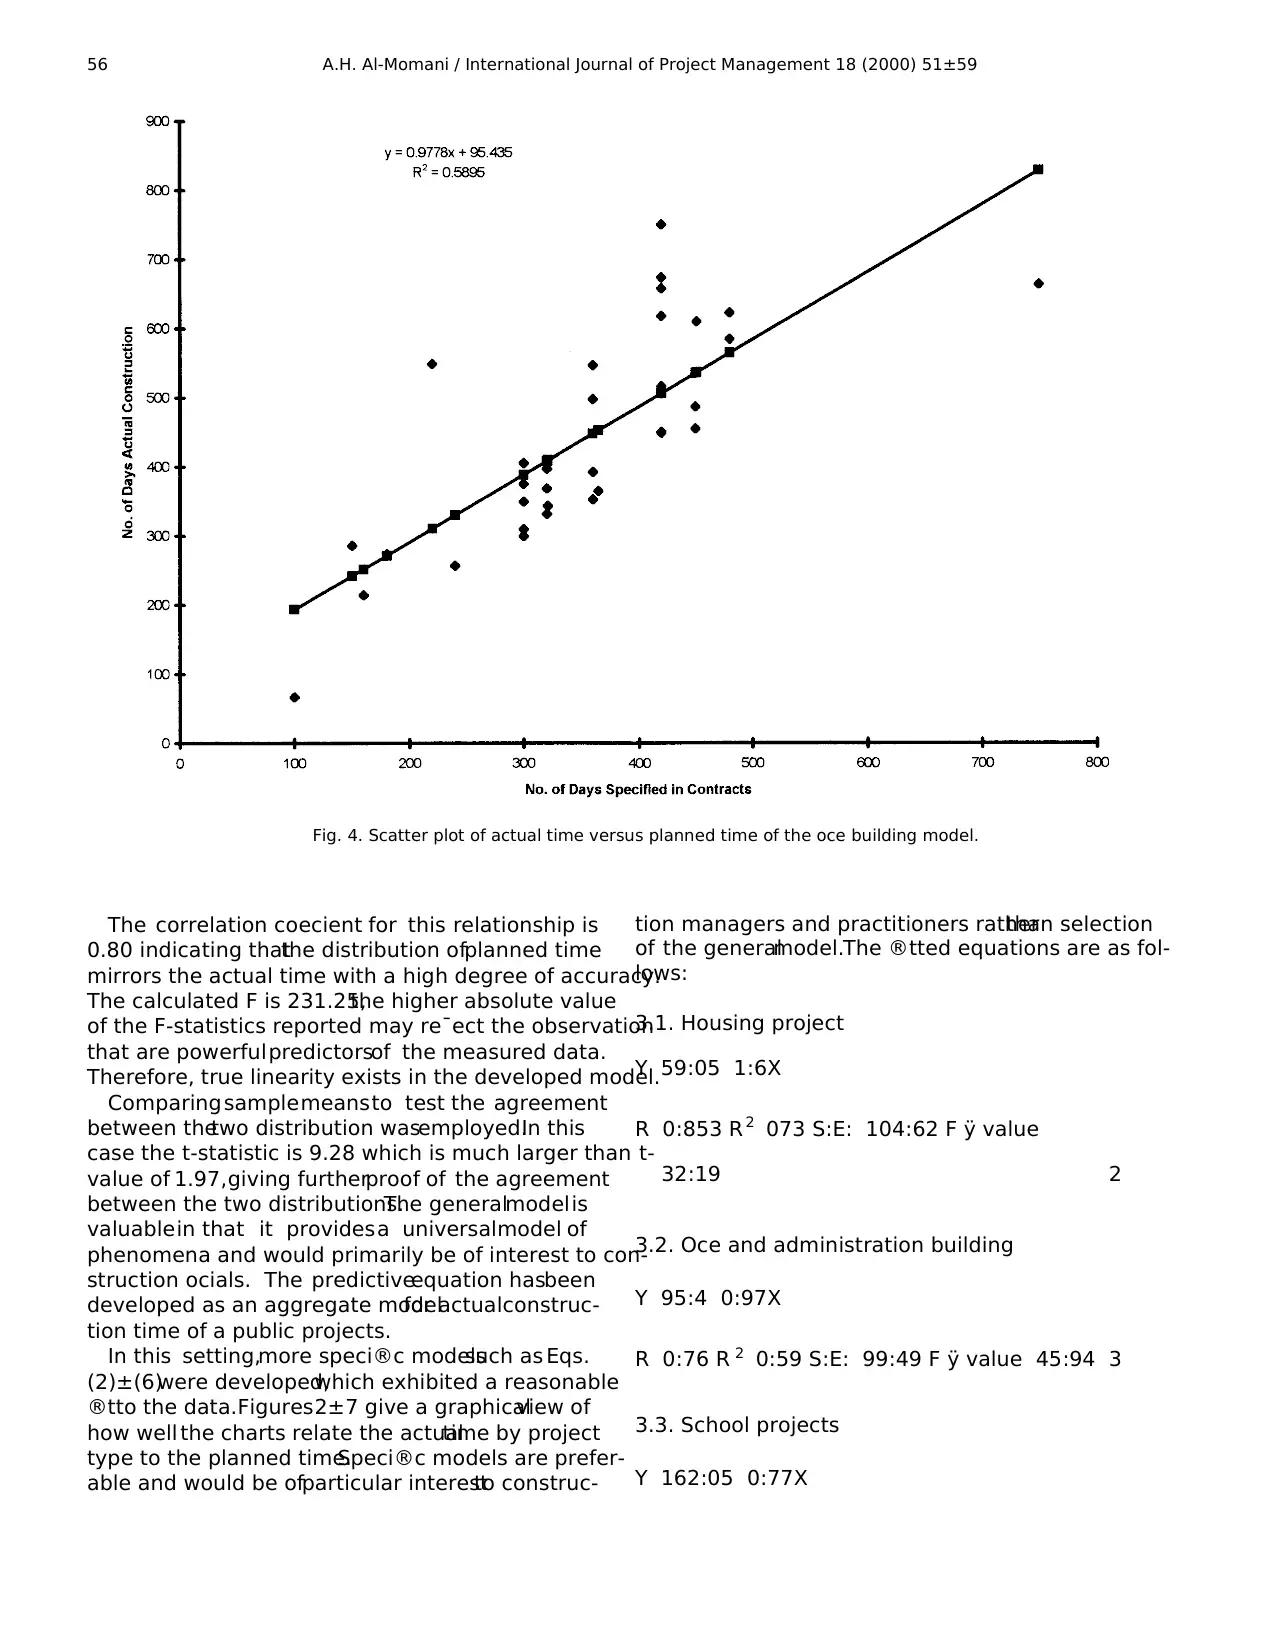
3.2. Oce and administration building
Y 95:4 0:97X
R 0:76 R 2 0:59 S:E: 99:49 F ÿ value 45:94 3
3.3. School projects
Y 162:05 0:77X
Fig. 4. Scatter plot of actual time versus planned time of the oce building model.
A.H. Al-Momani / International Journal of Project Management 18 (2000) 51±5956
0.80 indicating thatthe distribution ofplanned time
mirrors the actual time with a high degree of accuracy.
The calculated F is 231.25,the higher absolute value
of the F-statistics reported may re¯ect the observation
that are powerfulpredictorsof the measured data.
Therefore, true linearity exists in the developed model.
Comparing samplemeansto test the agreement
between thetwo distribution wasemployed.In this
case the t-statistic is 9.28 which is much larger than t-
value of 1.97,giving furtherproof of the agreement
between the two distributions.The generalmodelis
valuablein that it providesa universalmodel of
phenomena and would primarily be of interest to con-
struction ocials. The predictiveequation hasbeen
developed as an aggregate modelfor actualconstruc-
tion time of a public projects.
In this setting,more speci®c modelssuch as Eqs.
(2)±(6)were developed,which exhibited a reasonable
®tto the data.Figures2±7 give a graphicalview of
how well the charts relate the actualtime by project
type to the planned time.Speci®c models are prefer-
able and would be ofparticular interestto construc-
tion managers and practitioners ratherthan selection
of the generalmodel.The ®tted equations are as fol-
lows:
3.1. Housing project
Y 59:05 1:6X
R 0:853 R 2 073 S:E: 104:62 F ÿ value
32:19 2
3.2. Oce and administration building
Y 95:4 0:97X
R 0:76 R 2 0:59 S:E: 99:49 F ÿ value 45:94 3
3.3. School projects
Y 162:05 0:77X
Fig. 4. Scatter plot of actual time versus planned time of the oce building model.
A.H. Al-Momani / International Journal of Project Management 18 (2000) 51±5956
⊘ This is a preview!⊘
Do you want full access?
Subscribe today to unlock all pages.
Trusted by 1+ million students worldwide
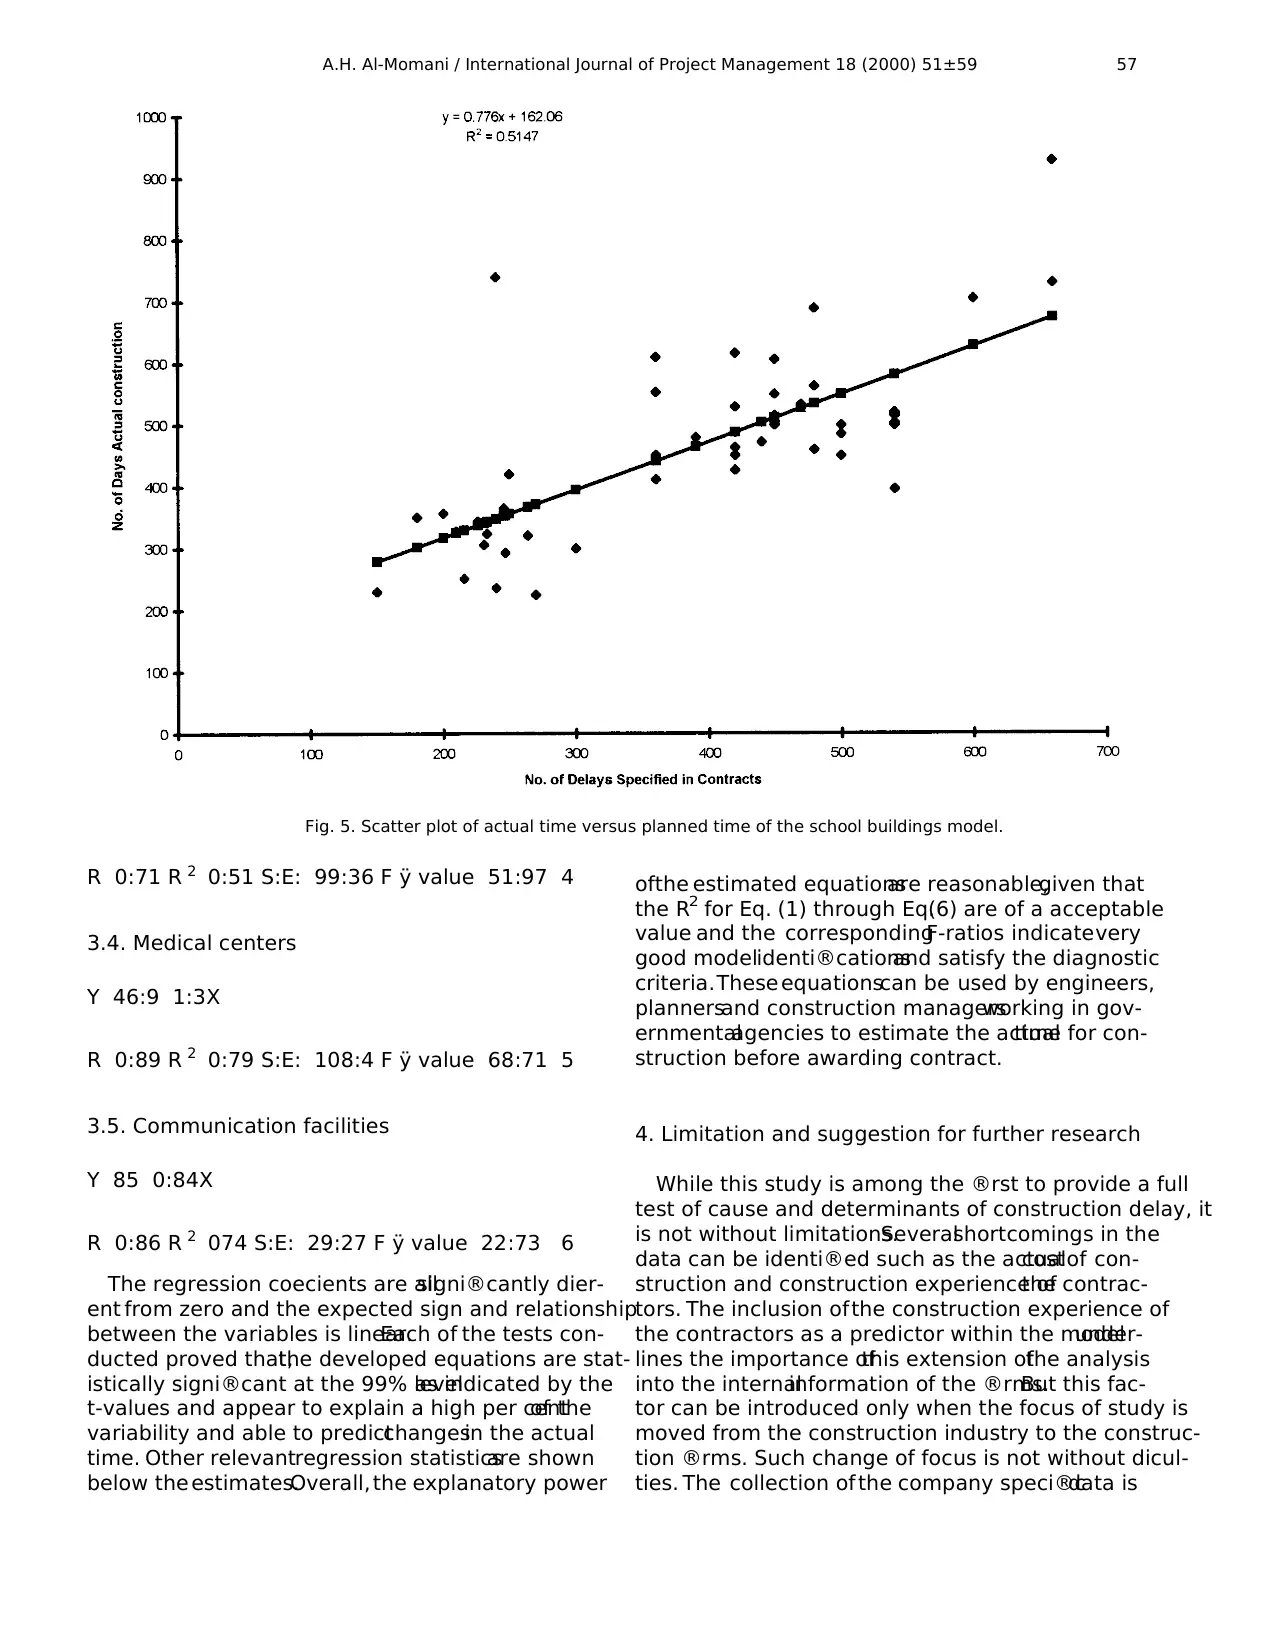
R 0:71 R 2 0:51 S:E: 99:36 F ÿ value 51:97
4
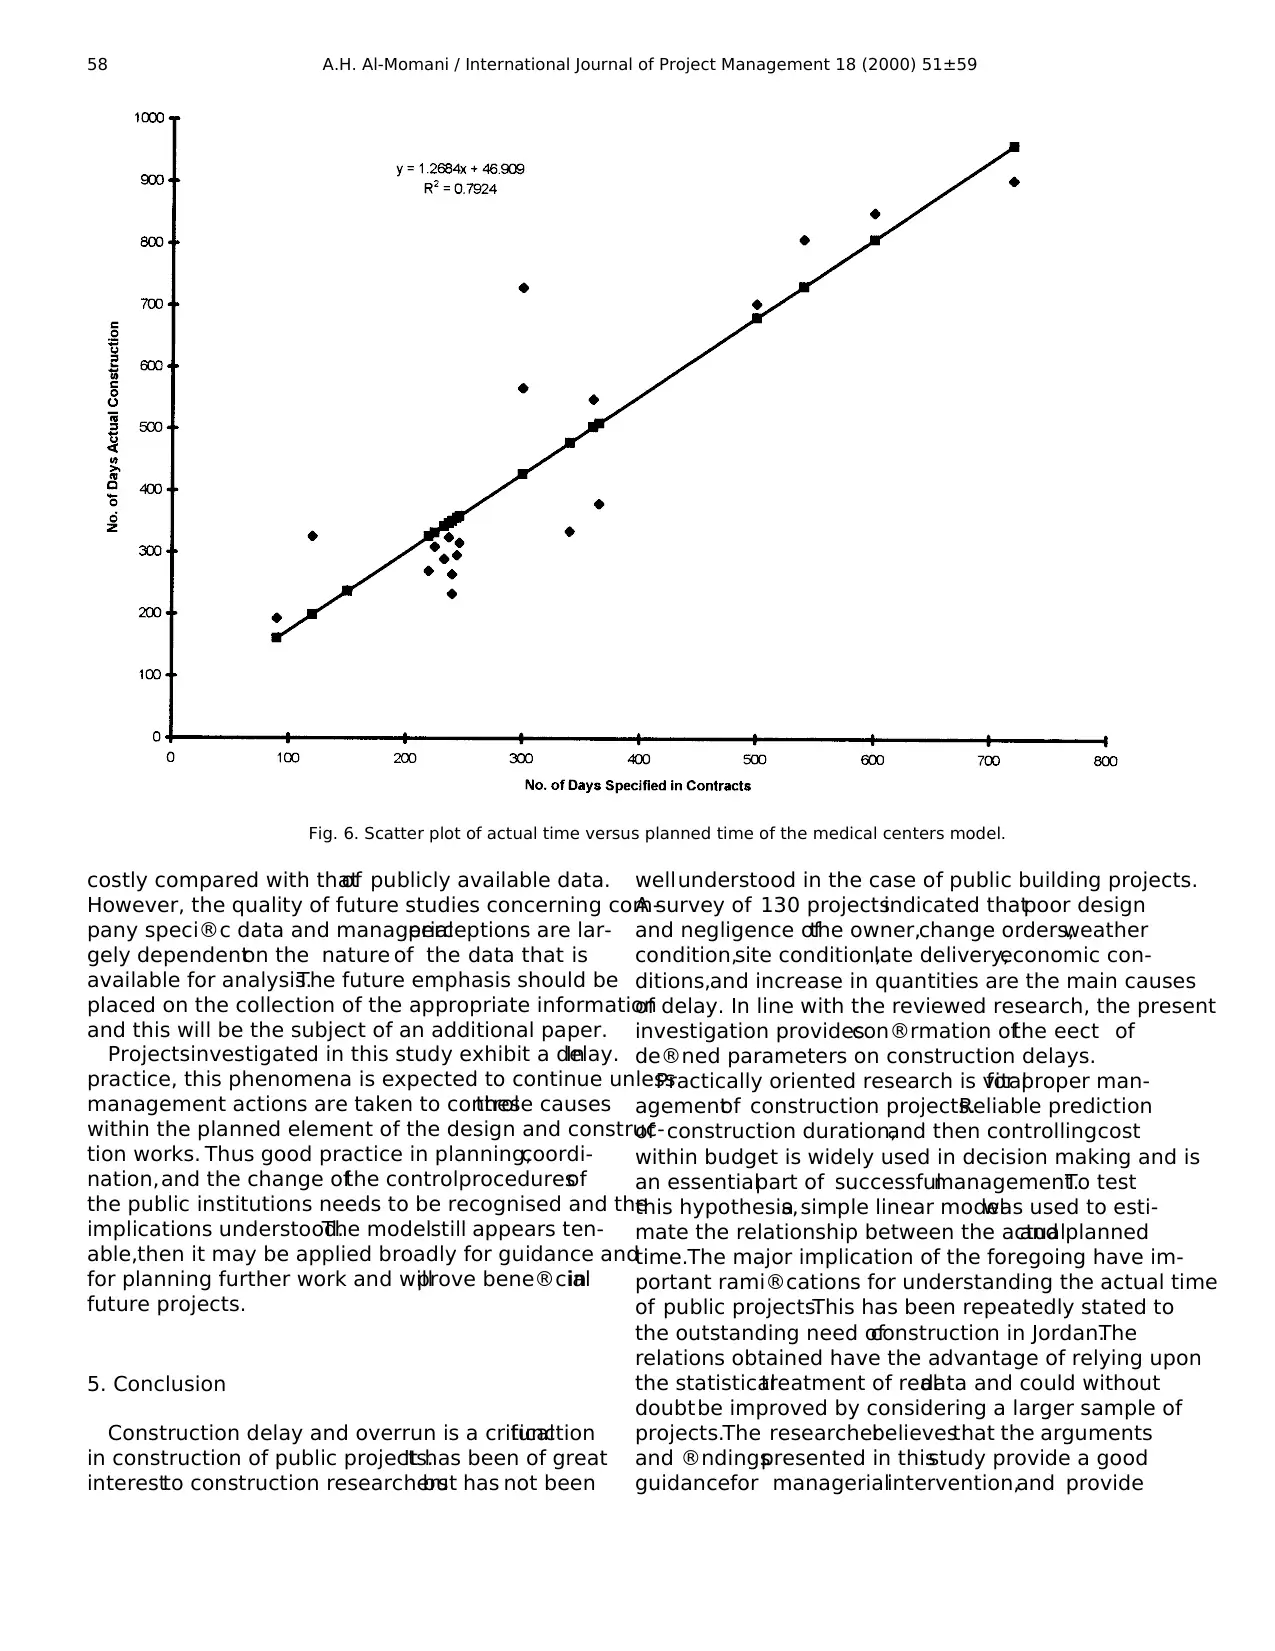
3.4. Medical centers
Y 46:9 1:3X
R 0:89 R 2 0:79 S:E: 108:4 F ÿ value 68:71 5
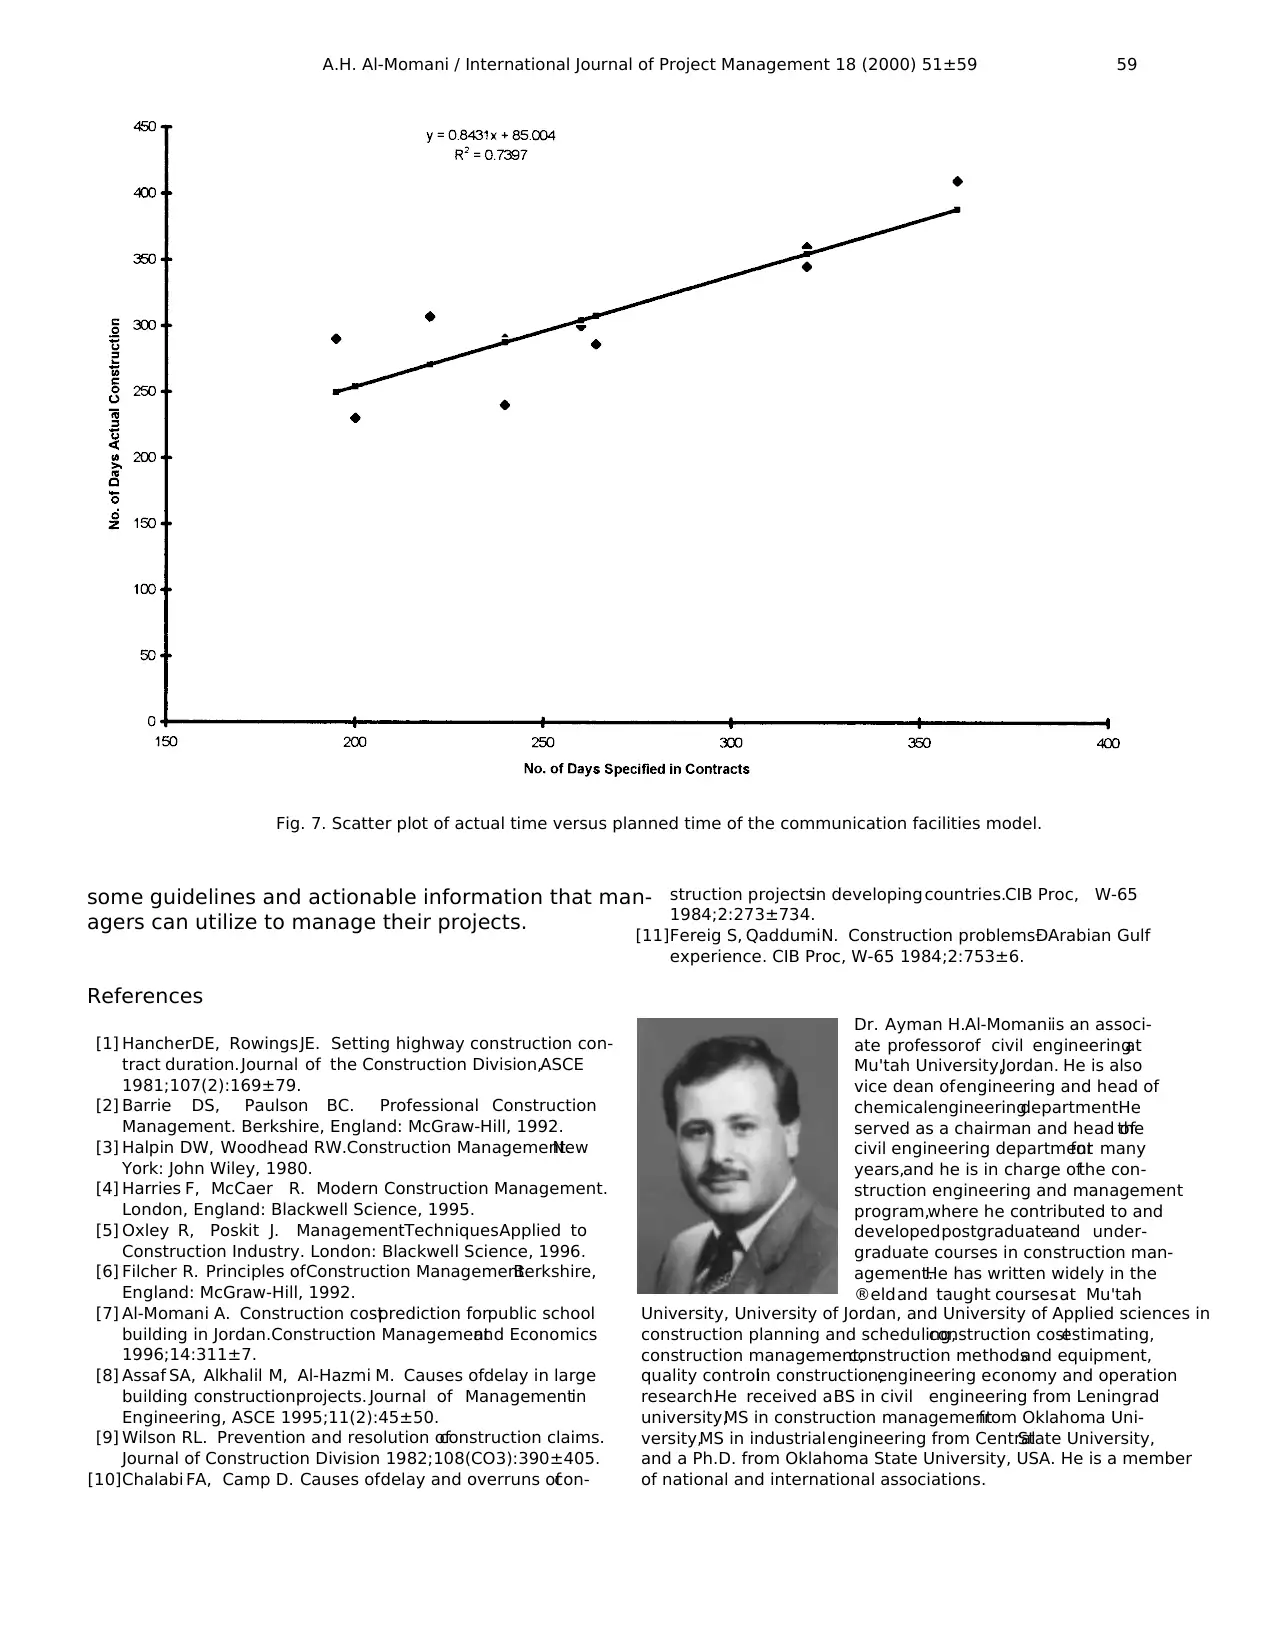
3.5. Communication facilities
Y 85 0:84X
R 0:86 R 2 074 S:E: 29:27 F ÿ value 22:73 6
The regression coecients are allsigni®cantly dier-
ent from zero and the expected sign and relationship
between the variables is linear.Each of the tests con-
ducted proved that,the developed equations are stat-
istically signi®cant at the 99% levelas indicated by the
t-values and appear to explain a high per centof the
variability and able to predictchangesin the actual
time. Other relevantregression statisticsare shown
below the estimates.Overall, the explanatory power
ofthe estimated equationsare reasonable,given that
the R2 for Eq. (1) through Eq.(6) are of a acceptable
value and the correspondingF-ratios indicatevery
good modelidenti®cationsand satisfy the diagnostic
criteria.These equationscan be used by engineers,
plannersand construction managersworking in gov-
ernmentalagencies to estimate the actualtime for con-
struction before awarding contract.
4. Limitation and suggestion for further research
While this study is among the ®rst to provide a full
test of cause and determinants of construction delay, it
is not without limitations.Severalshortcomings in the
data can be identi®ed such as the actualcostof con-
struction and construction experience ofthe contrac-
tors. The inclusion ofthe construction experience of
the contractors as a predictor within the modelunder-
lines the importance ofthis extension ofthe analysis
into the internalinformation of the ®rms.But this fac-
tor can be introduced only when the focus of study is
moved from the construction industry to the construc-
tion ®rms. Such change of focus is not without dicul-
ties. The collection of the company speci®cdata is
Fig. 5. Scatter plot of actual time versus planned time of the school buildings model.
A.H. Al-Momani / International Journal of Project Management 18 (2000) 51±59 57
3.4. Medical centers
Y 46:9 1:3X
R 0:89 R 2 0:79 S:E: 108:4 F ÿ value 68:71 5
3.5. Communication facilities
Y 85 0:84X
R 0:86 R 2 074 S:E: 29:27 F ÿ value 22:73 6
The regression coecients are allsigni®cantly dier-
ent from zero and the expected sign and relationship
between the variables is linear.Each of the tests con-
ducted proved that,the developed equations are stat-
istically signi®cant at the 99% levelas indicated by the
t-values and appear to explain a high per centof the
variability and able to predictchangesin the actual
time. Other relevantregression statisticsare shown
below the estimates.Overall, the explanatory power
ofthe estimated equationsare reasonable,given that
the R2 for Eq. (1) through Eq.(6) are of a acceptable
value and the correspondingF-ratios indicatevery
good modelidenti®cationsand satisfy the diagnostic
criteria.These equationscan be used by engineers,
plannersand construction managersworking in gov-
ernmentalagencies to estimate the actualtime for con-
struction before awarding contract.
4. Limitation and suggestion for further research
While this study is among the ®rst to provide a full
test of cause and determinants of construction delay, it
is not without limitations.Severalshortcomings in the
data can be identi®ed such as the actualcostof con-
struction and construction experience ofthe contrac-
tors. The inclusion ofthe construction experience of
the contractors as a predictor within the modelunder-
lines the importance ofthis extension ofthe analysis
into the internalinformation of the ®rms.But this fac-
tor can be introduced only when the focus of study is
moved from the construction industry to the construc-
tion ®rms. Such change of focus is not without dicul-
ties. The collection of the company speci®cdata is
Fig. 5. Scatter plot of actual time versus planned time of the school buildings model.
A.H. Al-Momani / International Journal of Project Management 18 (2000) 51±59 57
Paraphrase This Document
Need a fresh take? Get an instant paraphrase of this document with our AI Paraphraser
costly compared with thatof publicly available data.
However, the quality of future studies concerning com-
pany speci®c data and managerialperceptions are lar-
gely dependenton the nature of the data that is
available for analysis.The future emphasis should be
placed on the collection of the appropriate information
and this will be the subject of an additional paper.
Projectsinvestigated in this study exhibit a delay.In
practice, this phenomena is expected to continue unless
management actions are taken to controlthese causes
within the planned element of the design and construc-
tion works. Thus good practice in planning,coordi-
nation,and the change ofthe controlproceduresof
the public institutions needs to be recognised and the
implications understood.The modelstill appears ten-
able,then it may be applied broadly for guidance and
for planning further work and willprove bene®cialin
future projects.
5. Conclusion
Construction delay and overrun is a criticalfunction
in construction of public projects.It has been of great
interestto construction researchersbut has not been
wellunderstood in the case of public building projects.
A survey of 130 projectsindicated thatpoor design
and negligence ofthe owner,change orders,weather
condition,site condition,late delivery,economic con-
ditions,and increase in quantities are the main causes
of delay. In line with the reviewed research, the present
investigation providescon®rmation ofthe eect of
de®ned parameters on construction delays.
Practically oriented research is vitalfor proper man-
agementof construction projects.Reliable prediction
of construction duration,and then controllingcost
within budget is widely used in decision making and is
an essentialpart of successfulmanagement.To test
this hypothesis,a simple linear modelwas used to esti-
mate the relationship between the actualand planned
time.The major implication of the foregoing have im-
portant rami®cations for understanding the actual time
of public projects.This has been repeatedly stated to
the outstanding need ofconstruction in Jordan.The
relations obtained have the advantage of relying upon
the statisticaltreatment of realdata and could without
doubtbe improved by considering a larger sample of
projects.The researcherbelievesthat the arguments
and ®ndingspresented in thisstudy provide a good
guidancefor managerialintervention,and provide
Fig. 6. Scatter plot of actual time versus planned time of the medical centers model.
A.H. Al-Momani / International Journal of Project Management 18 (2000) 51±5958
some guidelines and actionable information that man-
agers can utilize to manage their projects.
References
[1] HancherDE, RowingsJE. Setting highway construction con-
tract duration.Journal of the Construction Division,ASCE
1981;107(2):169±79.
[2] Barrie DS, Paulson BC. Professional Construction
Management. Berkshire, England: McGraw-Hill, 1992.
[3] Halpin DW, Woodhead RW.Construction Management.New
York: John Wiley, 1980.
[4] Harries F, McCaer R. Modern Construction Management.
London, England: Blackwell Science, 1995.
[5] Oxley R, Poskit J. ManagementTechniquesApplied to
Construction Industry. London: Blackwell Science, 1996.
[6] Filcher R. Principles ofConstruction Management.Berkshire,
England: McGraw-Hill, 1992.
[7] Al-Momani A. Construction costprediction forpublic school
building in Jordan.Construction Managementand Economics
1996;14:311±7.
[8] Assaf SA, Alkhalil M, Al-Hazmi M. Causes ofdelay in large
building constructionprojects. Journal of Managementin
Engineering, ASCE 1995;11(2):45±50.
[9] Wilson RL. Prevention and resolution ofconstruction claims.
Journal of Construction Division 1982;108(CO3):390±405.
[10]Chalabi FA, Camp D. Causes ofdelay and overruns ofcon-
struction projectsin developing countries.CIB Proc, W-65
1984;2:273±734.
[11]Fereig S, QaddumiN. Construction problemsÐArabian Gulf
experience. CIB Proc, W-65 1984;2:753±6.
Fig. 7. Scatter plot of actual time versus planned time of the communication facilities model.
Dr. Ayman H.Al-Momaniis an associ-
ate professorof civil engineeringat
Mu'tah University,Jordan. He is also
vice dean ofengineering and head of
chemicalengineeringdepartment.He
served as a chairman and head ofthe
civil engineering departmentfor many
years,and he is in charge ofthe con-
struction engineering and management
program,where he contributed to and
developedpostgraduateand under-
graduate courses in construction man-
agement.He has written widely in the
®eldand taught coursesat Mu'tah
University, University of Jordan, and University of Applied sciences in
construction planning and scheduling,construction costestimating,
construction management,construction methodsand equipment,
quality controlin construction,engineering economy and operation
research.He received aBS in civil engineering from Leningrad
university,MS in construction managementfrom Oklahoma Uni-
versity,MS in industrialengineering from CentralState University,
and a Ph.D. from Oklahoma State University, USA. He is a member
of national and international associations.
A.H. Al-Momani / International Journal of Project Management 18 (2000) 51±59 59
⊘ This is a preview!⊘
Do you want full access?
Subscribe today to unlock all pages.
Trusted by 1+ million students worldwide
1 out of 9
Related Documents


Your All-in-One AI-Powered Toolkit for Academic Success.
+13062052269
info@desklib.com
Available 24*7 on WhatsApp / Email
![[object Object]](/_next/static/media/star-bottom.7253800d.svg)
Unlock your academic potential
Copyright © 2020–2026 A2Z Services. All Rights Reserved. Developed and managed by ZUCOL.