Comprehensive Overview of Data Analysis Techniques and Methods
VerifiedAdded on 2023/03/21
|8
|2934
|24
Report
AI Summary
This report provides a detailed analysis of various data analysis techniques, encompassing both qualitative and quantitative methods. It begins by defining data analysis and outlining the different types of data, including primary and secondary sources, and the importance of research objectives and hypotheses. The report then delves into qualitative analysis, describing methods such as content, narrative, discourse, and framework analysis, emphasizing their role in understanding human behavior. Subsequently, the report focuses on quantitative analysis, exploring parametric and non-parametric methods. It explains t-tests, one-way ANOVA, correlation, and regression analysis, including their assumptions, applications, and interpretation of results. The report includes examples of t-tests, ANOVA, and correlation analyses, providing a comprehensive understanding of data analysis methodologies and their practical applications.
Data analysis is the process of systematically applying statistical techniques to describe,
evaluate, inspect and derive useful and meaningful information from data that can assist in sound
decision making and to solve specific problems. Data are collected facts that convey no meaning
but organized in a given order. There are various methods of obtaining data depending on type
that is required. There are two types data, secondary and primary. Secondary data are those that
have been collected and stored which can be obtained from records, internet, journals among
others. Primary are those that the researcher has direct involvement in collection process.
Primary data can be collected through interviews, administration of the questionnaires among
others. Before data is collected, the researcher must come up with relevant research objectives
and hypothesis. The objectives are what the researcher want to accomplish, target or goal, which
guides the researcher to identify the variables. Hypotheses are prediction statements about the
outcome. Hypotheses, objectives together with well-designed research questions assist the
researcher to identify the type and the structure of data that are needed. They also assist the
researcher to decide on the data analysis method that will give the required findings. There are
qualitative and quantitative data analysis methods, which are broadly categorized into inferential
and descriptive analysis.
Qualitative data analysis is analytical method applied to qualisstative data to derive information.
It is a method that is used in identifying and interpreting of patterns from a textual data that can
be used to answer research objectives. It deals with studying human behavior. It is the best
method of studying questions like how and why concerning human experiences have strong basis
in sociology. Qualitative data consist of words, observations and symbols which can easily be
obtained using primary methods of data collection. Qualitative analysis consists of content,
narrative, discourse, grounded and framework analysis. Content is categorizing of behavioral
data to classify and to summary. Narrative is the reformulation of stories presented while taking
into account the content and experience of each respondent. A discourse is analysis of naturally
occurring talks and written texts. Framework is familiarization, identification of thematic
framework, mapping, charting and interpretation. Grounded deals with analysis of single case to
develop a theory. Qualitative research helps in understanding and interpreting human
psychology. Qualitative research argues that understanding of a phenomenon comes from
exploration of the totality of the situation with access of non-numerical data. The method is
highly applied in communicative analysis that include journalism among others.
Quantitative analysis is the process of applying mathematical and statistical techniques in
extracting useful information from measurable and verifiable data. These techniques include
parametric and non-parametric methods. The parameters are normally mean and standard
deviation. The methods are based upon given set of assumptions. These assumptions are
population parameter is normal or can be estimated through central limit theorem, observations
are independent from each other, experiment randomly conducted among others. Some of the
parametric methods of data analysis include t test, Chi-square test of association and goodness of
fit, Analysis of variance, F test for equality of variances, Regression techniques, Z test of means
for dependent and independent samples, Confident intervals among others. Non parametric
Paraphrase This Document
Need a fresh take? Get an instant paraphrase of this document with our AI Paraphraser
methods that do not have assumptions concerning the population parameter. Neither the
parameters nor the distributions are fixed. Some of the non-parametric methods include Sign test,
Wilcoxon Mann Whitney, Wilcoxon Sign Rank test, Median test, test of randomness, Spearman
correlation, U test, Kruskal test among others. These non-parametric tests do not depend on the
mean. Quantitative analysis also comprises of descriptive analysis. Descriptive analysis include
means, standard deviation, quartiles, skewness among others.
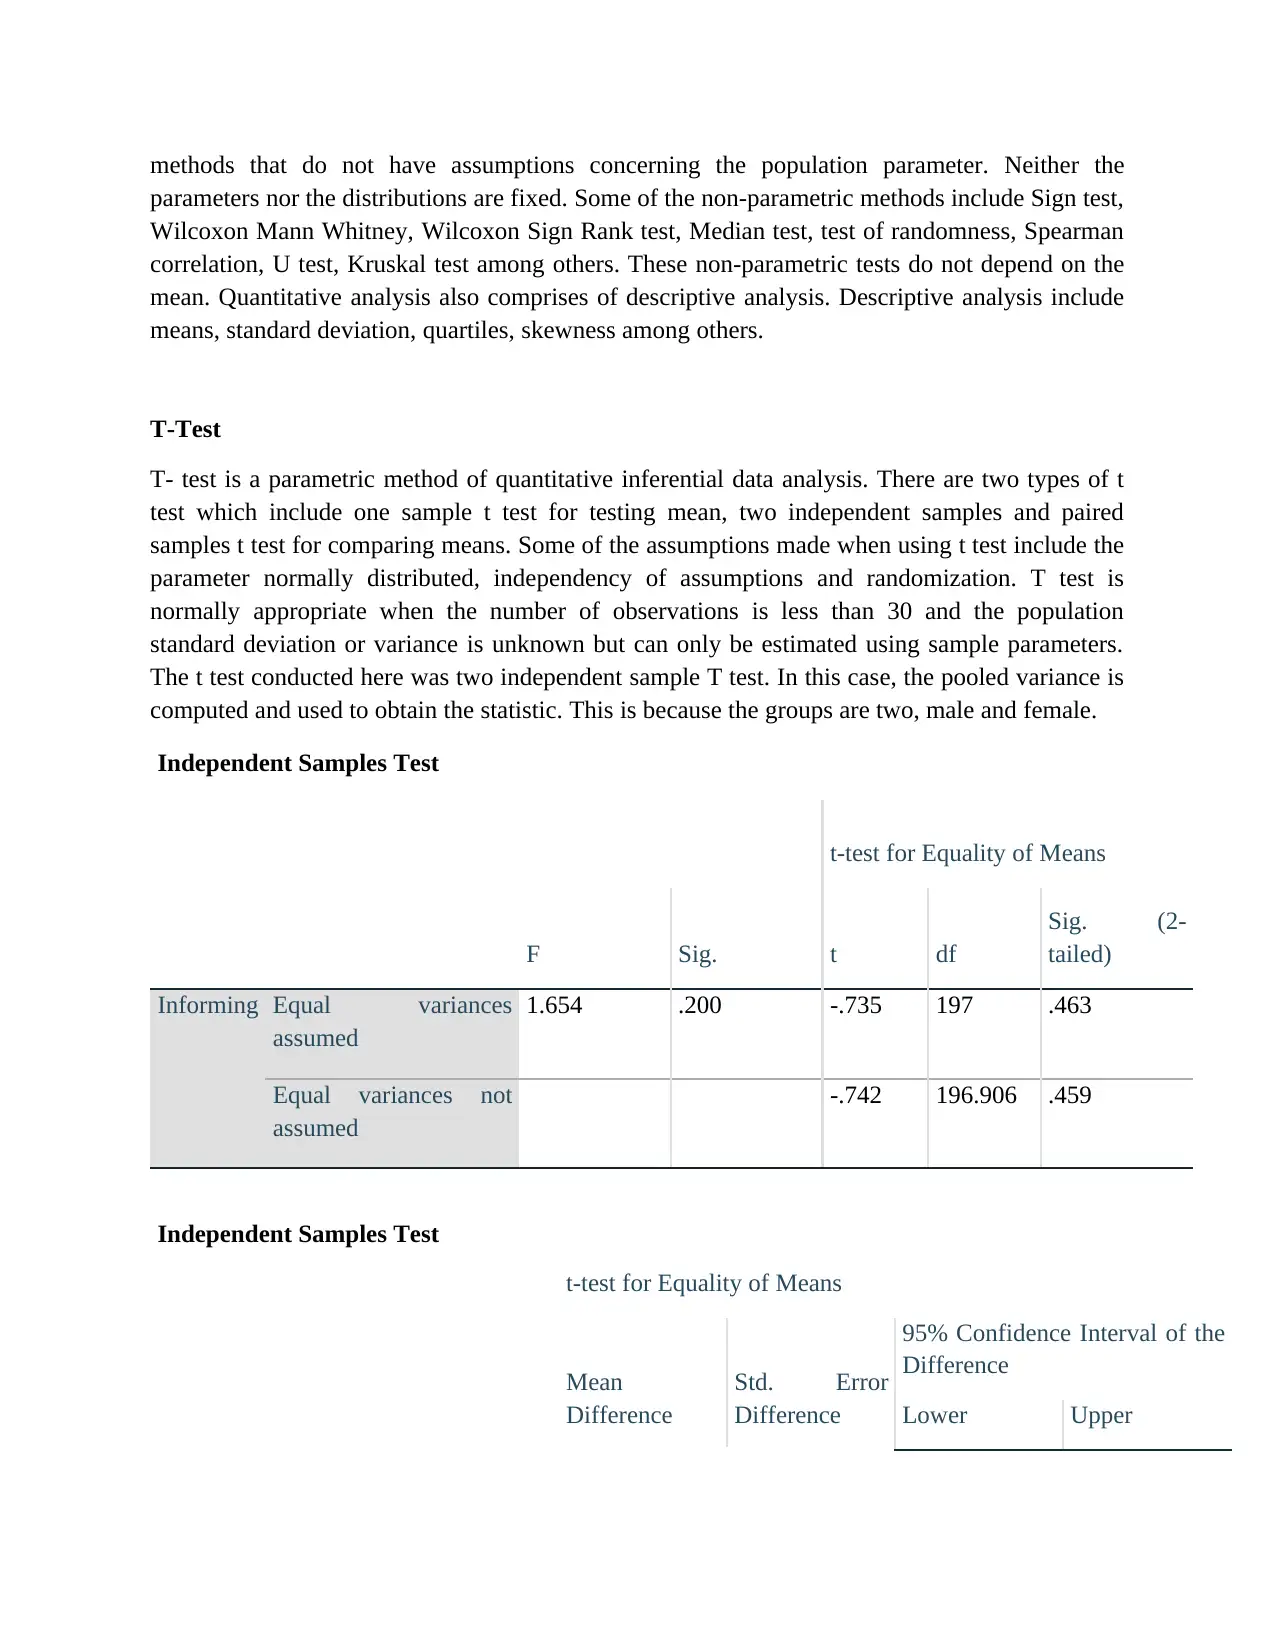
T-Test
T- test is a parametric method of quantitative inferential data analysis. There are two types of t
test which include one sample t test for testing mean, two independent samples and paired
samples t test for comparing means. Some of the assumptions made when using t test include the
parameter normally distributed, independency of assumptions and randomization. T test is
normally appropriate when the number of observations is less than 30 and the population
standard deviation or variance is unknown but can only be estimated using sample parameters.
The t test conducted here was two independent sample T test. In this case, the pooled variance is
computed and used to obtain the statistic. This is because the groups are two, male and female.
Independent Samples Test
t-test for Equality of Means
F Sig. t df
Sig. (2-
tailed)
Informing Equal variances
assumed
1.654 .200 -.735 197 .463
Equal variances not
assumed
-.742 196.906 .459
Independent Samples Test
t-test for Equality of Means
Mean
Difference
Std. Error
Difference
95% Confidence Interval of the
Difference
Lower Upper
parameters nor the distributions are fixed. Some of the non-parametric methods include Sign test,
Wilcoxon Mann Whitney, Wilcoxon Sign Rank test, Median test, test of randomness, Spearman
correlation, U test, Kruskal test among others. These non-parametric tests do not depend on the
mean. Quantitative analysis also comprises of descriptive analysis. Descriptive analysis include
means, standard deviation, quartiles, skewness among others.
T-Test
T- test is a parametric method of quantitative inferential data analysis. There are two types of t
test which include one sample t test for testing mean, two independent samples and paired
samples t test for comparing means. Some of the assumptions made when using t test include the
parameter normally distributed, independency of assumptions and randomization. T test is
normally appropriate when the number of observations is less than 30 and the population
standard deviation or variance is unknown but can only be estimated using sample parameters.
The t test conducted here was two independent sample T test. In this case, the pooled variance is
computed and used to obtain the statistic. This is because the groups are two, male and female.
Independent Samples Test
t-test for Equality of Means
F Sig. t df
Sig. (2-
tailed)
Informing Equal variances
assumed
1.654 .200 -.735 197 .463
Equal variances not
assumed
-.742 196.906 .459
Independent Samples Test
t-test for Equality of Means
Mean
Difference
Std. Error
Difference
95% Confidence Interval of the
Difference
Lower Upper
Informing Equal variances assumed -.08024 .10920 -.29558 .13510
Equal variances not
assumed
-.08024 .10811 -.29344 .13296
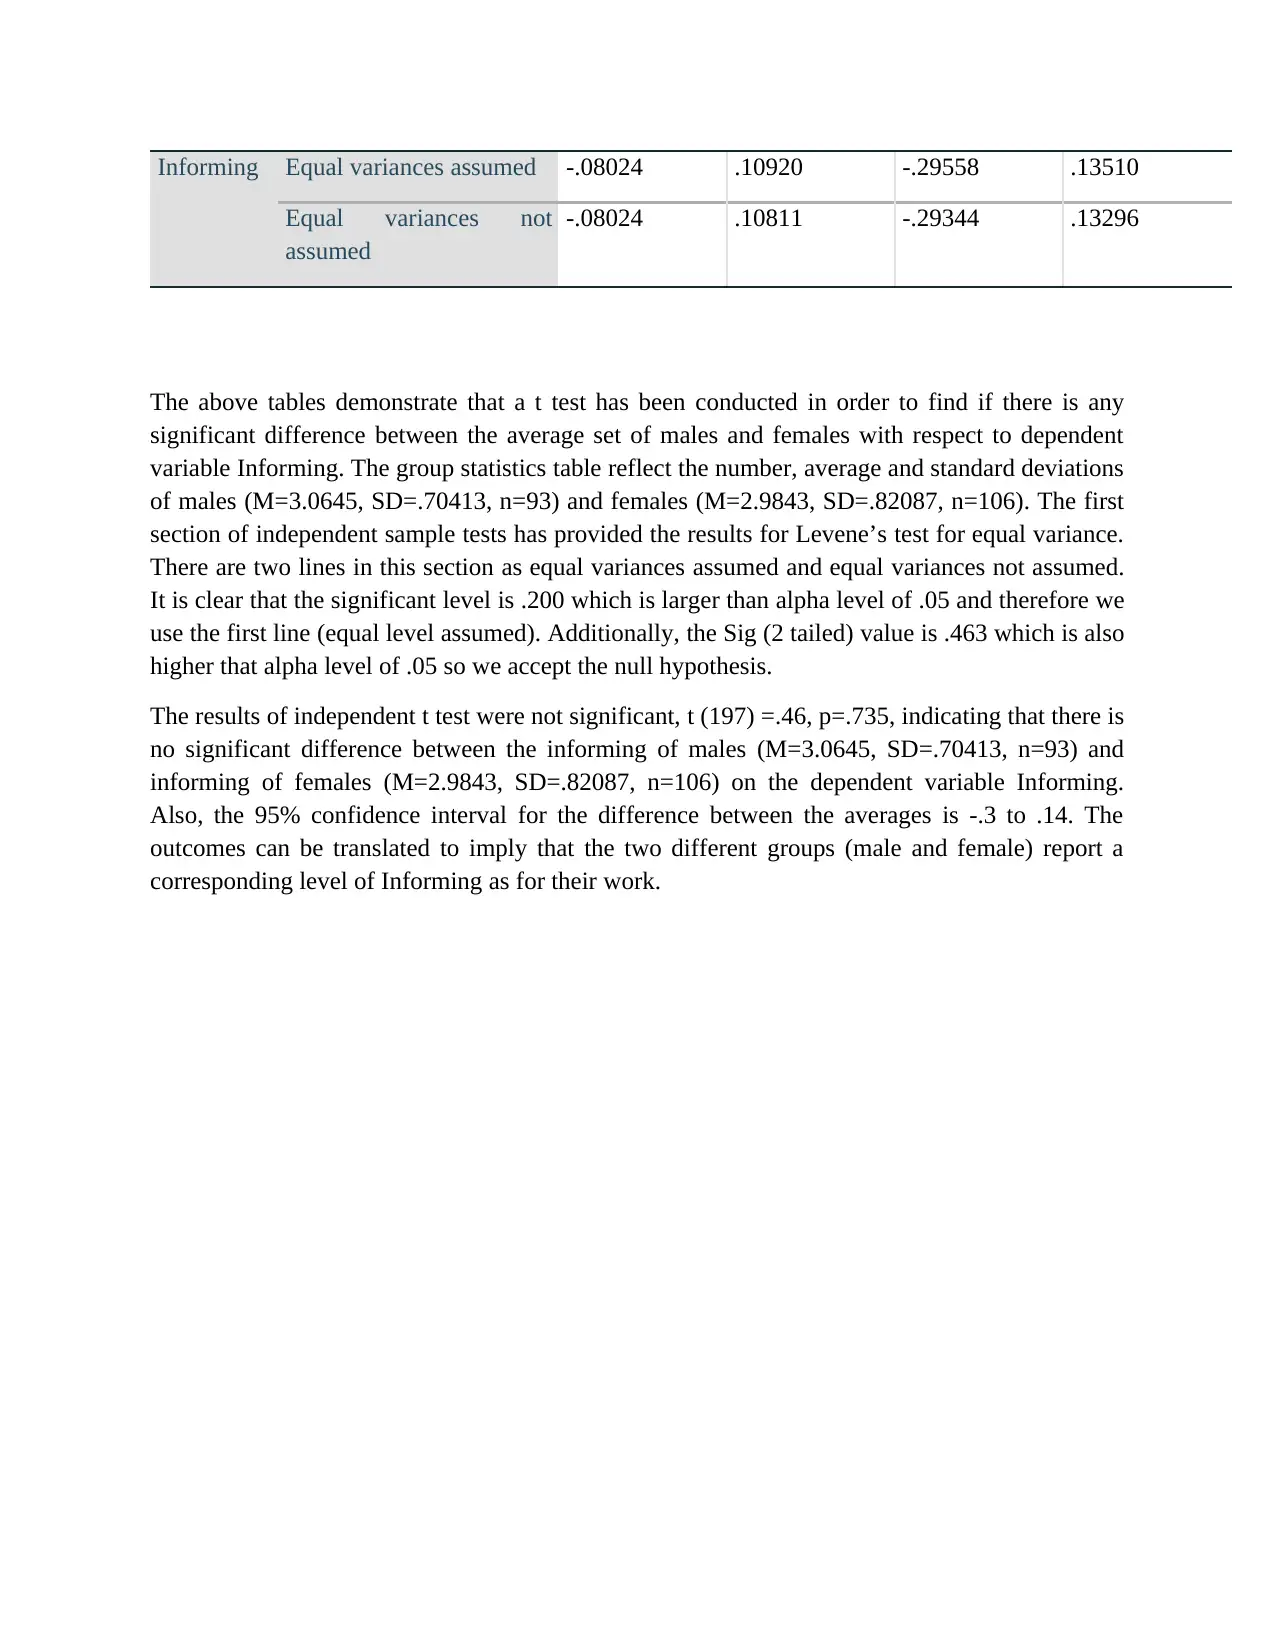
The above tables demonstrate that a t test has been conducted in order to find if there is any
significant difference between the average set of males and females with respect to dependent
variable Informing. The group statistics table reflect the number, average and standard deviations
of males (M=3.0645, SD=.70413, n=93) and females (M=2.9843, SD=.82087, n=106). The first
section of independent sample tests has provided the results for Levene’s test for equal variance.
There are two lines in this section as equal variances assumed and equal variances not assumed.
It is clear that the significant level is .200 which is larger than alpha level of .05 and therefore we
use the first line (equal level assumed). Additionally, the Sig (2 tailed) value is .463 which is also
higher that alpha level of .05 so we accept the null hypothesis.
The results of independent t test were not significant, t (197) =.46, p=.735, indicating that there is
no significant difference between the informing of males (M=3.0645, SD=.70413, n=93) and
informing of females (M=2.9843, SD=.82087, n=106) on the dependent variable Informing.
Also, the 95% confidence interval for the difference between the averages is -.3 to .14. The
outcomes can be translated to imply that the two different groups (male and female) report a
corresponding level of Informing as for their work.
Equal variances not
assumed
-.08024 .10811 -.29344 .13296
The above tables demonstrate that a t test has been conducted in order to find if there is any
significant difference between the average set of males and females with respect to dependent
variable Informing. The group statistics table reflect the number, average and standard deviations
of males (M=3.0645, SD=.70413, n=93) and females (M=2.9843, SD=.82087, n=106). The first
section of independent sample tests has provided the results for Levene’s test for equal variance.
There are two lines in this section as equal variances assumed and equal variances not assumed.
It is clear that the significant level is .200 which is larger than alpha level of .05 and therefore we
use the first line (equal level assumed). Additionally, the Sig (2 tailed) value is .463 which is also
higher that alpha level of .05 so we accept the null hypothesis.
The results of independent t test were not significant, t (197) =.46, p=.735, indicating that there is
no significant difference between the informing of males (M=3.0645, SD=.70413, n=93) and
informing of females (M=2.9843, SD=.82087, n=106) on the dependent variable Informing.
Also, the 95% confidence interval for the difference between the averages is -.3 to .14. The
outcomes can be translated to imply that the two different groups (male and female) report a
corresponding level of Informing as for their work.
⊘ This is a preview!⊘
Do you want full access?
Subscribe today to unlock all pages.
Trusted by 1+ million students worldwide
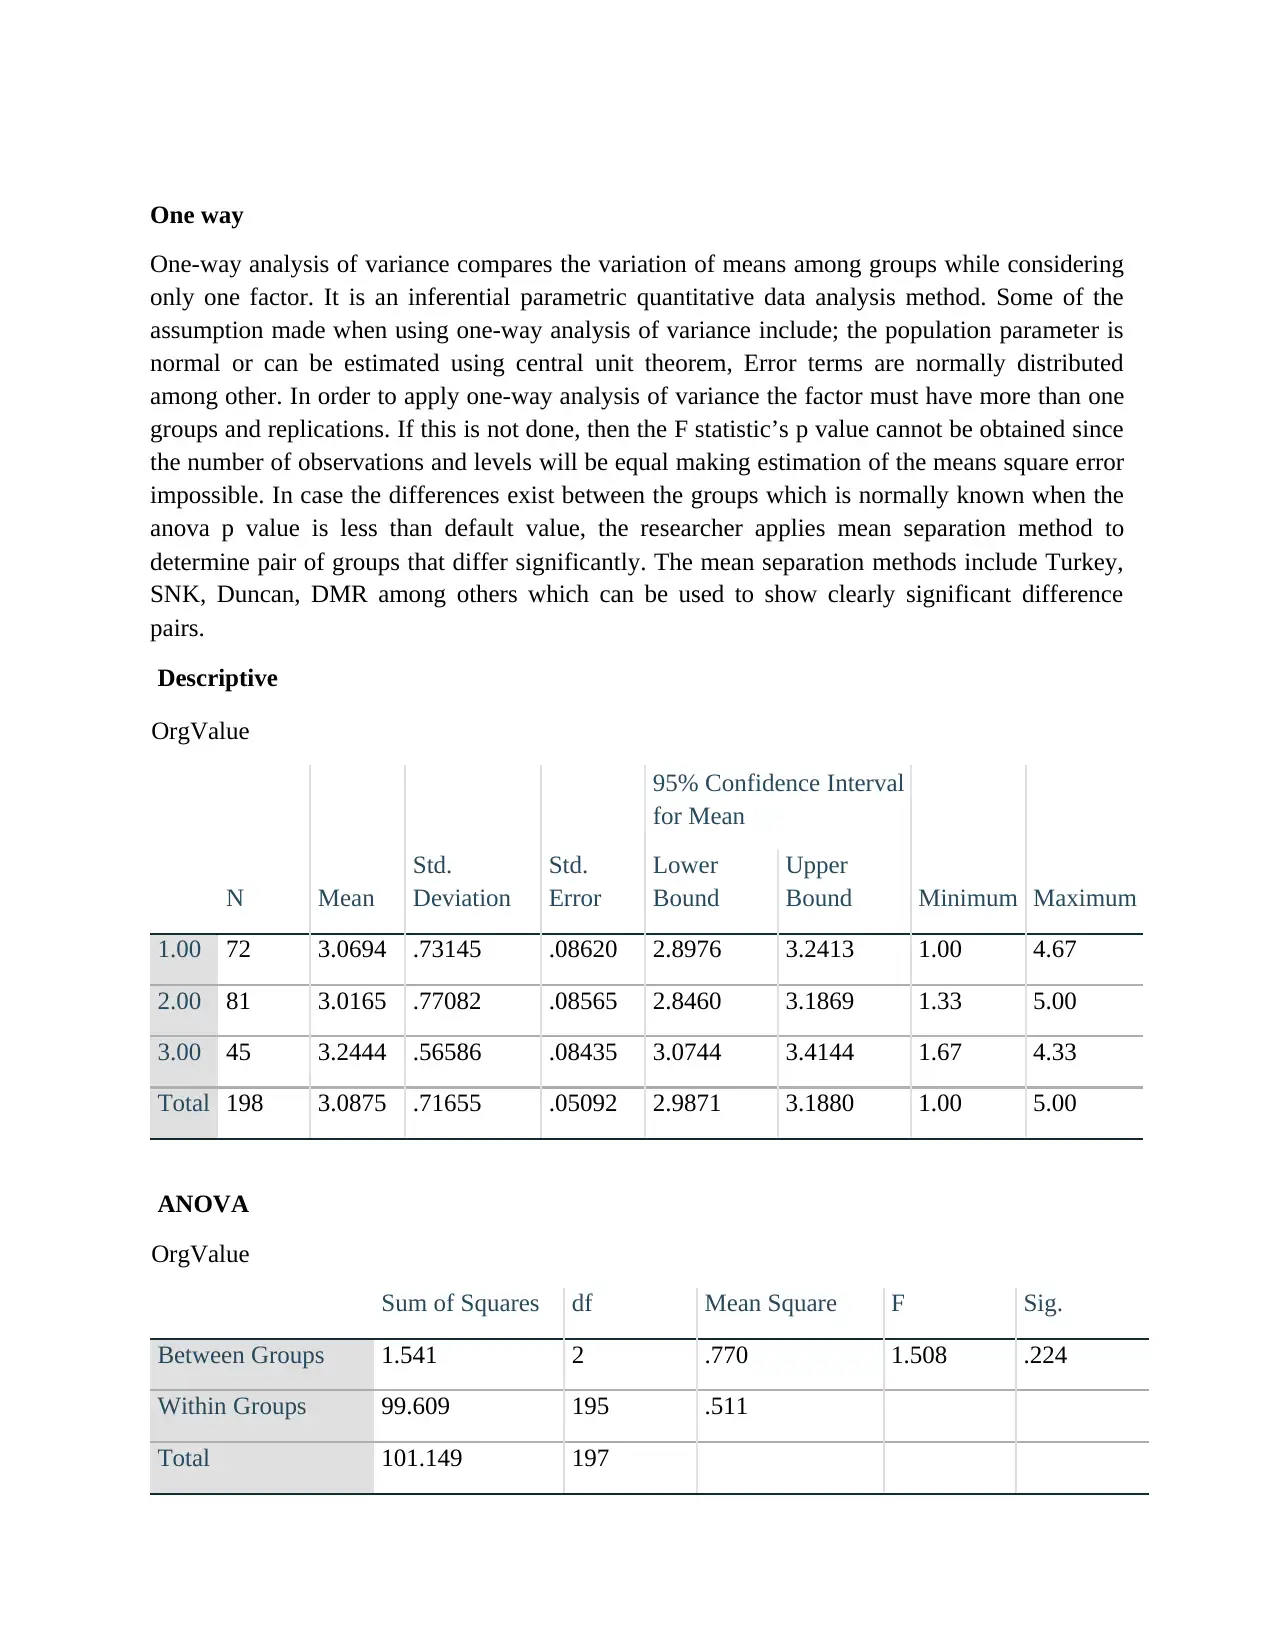
One way
One-way analysis of variance compares the variation of means among groups while considering
only one factor. It is an inferential parametric quantitative data analysis method. Some of the
assumption made when using one-way analysis of variance include; the population parameter is
normal or can be estimated using central unit theorem, Error terms are normally distributed
among other. In order to apply one-way analysis of variance the factor must have more than one
groups and replications. If this is not done, then the F statistic’s p value cannot be obtained since
the number of observations and levels will be equal making estimation of the means square error
impossible. In case the differences exist between the groups which is normally known when the
anova p value is less than default value, the researcher applies mean separation method to
determine pair of groups that differ significantly. The mean separation methods include Turkey,
SNK, Duncan, DMR among others which can be used to show clearly significant difference
pairs.
Descriptive
OrgValue
N Mean
Std.
Deviation
Std.
Error
95% Confidence Interval
for Mean
Minimum Maximum
Lower
Bound
Upper
Bound
1.00 72 3.0694 .73145 .08620 2.8976 3.2413 1.00 4.67
2.00 81 3.0165 .77082 .08565 2.8460 3.1869 1.33 5.00
3.00 45 3.2444 .56586 .08435 3.0744 3.4144 1.67 4.33
Total 198 3.0875 .71655 .05092 2.9871 3.1880 1.00 5.00
ANOVA
OrgValue
Sum of Squares df Mean Square F Sig.
Between Groups 1.541 2 .770 1.508 .224
Within Groups 99.609 195 .511
Total 101.149 197
Paraphrase This Document
Need a fresh take? Get an instant paraphrase of this document with our AI Paraphraser
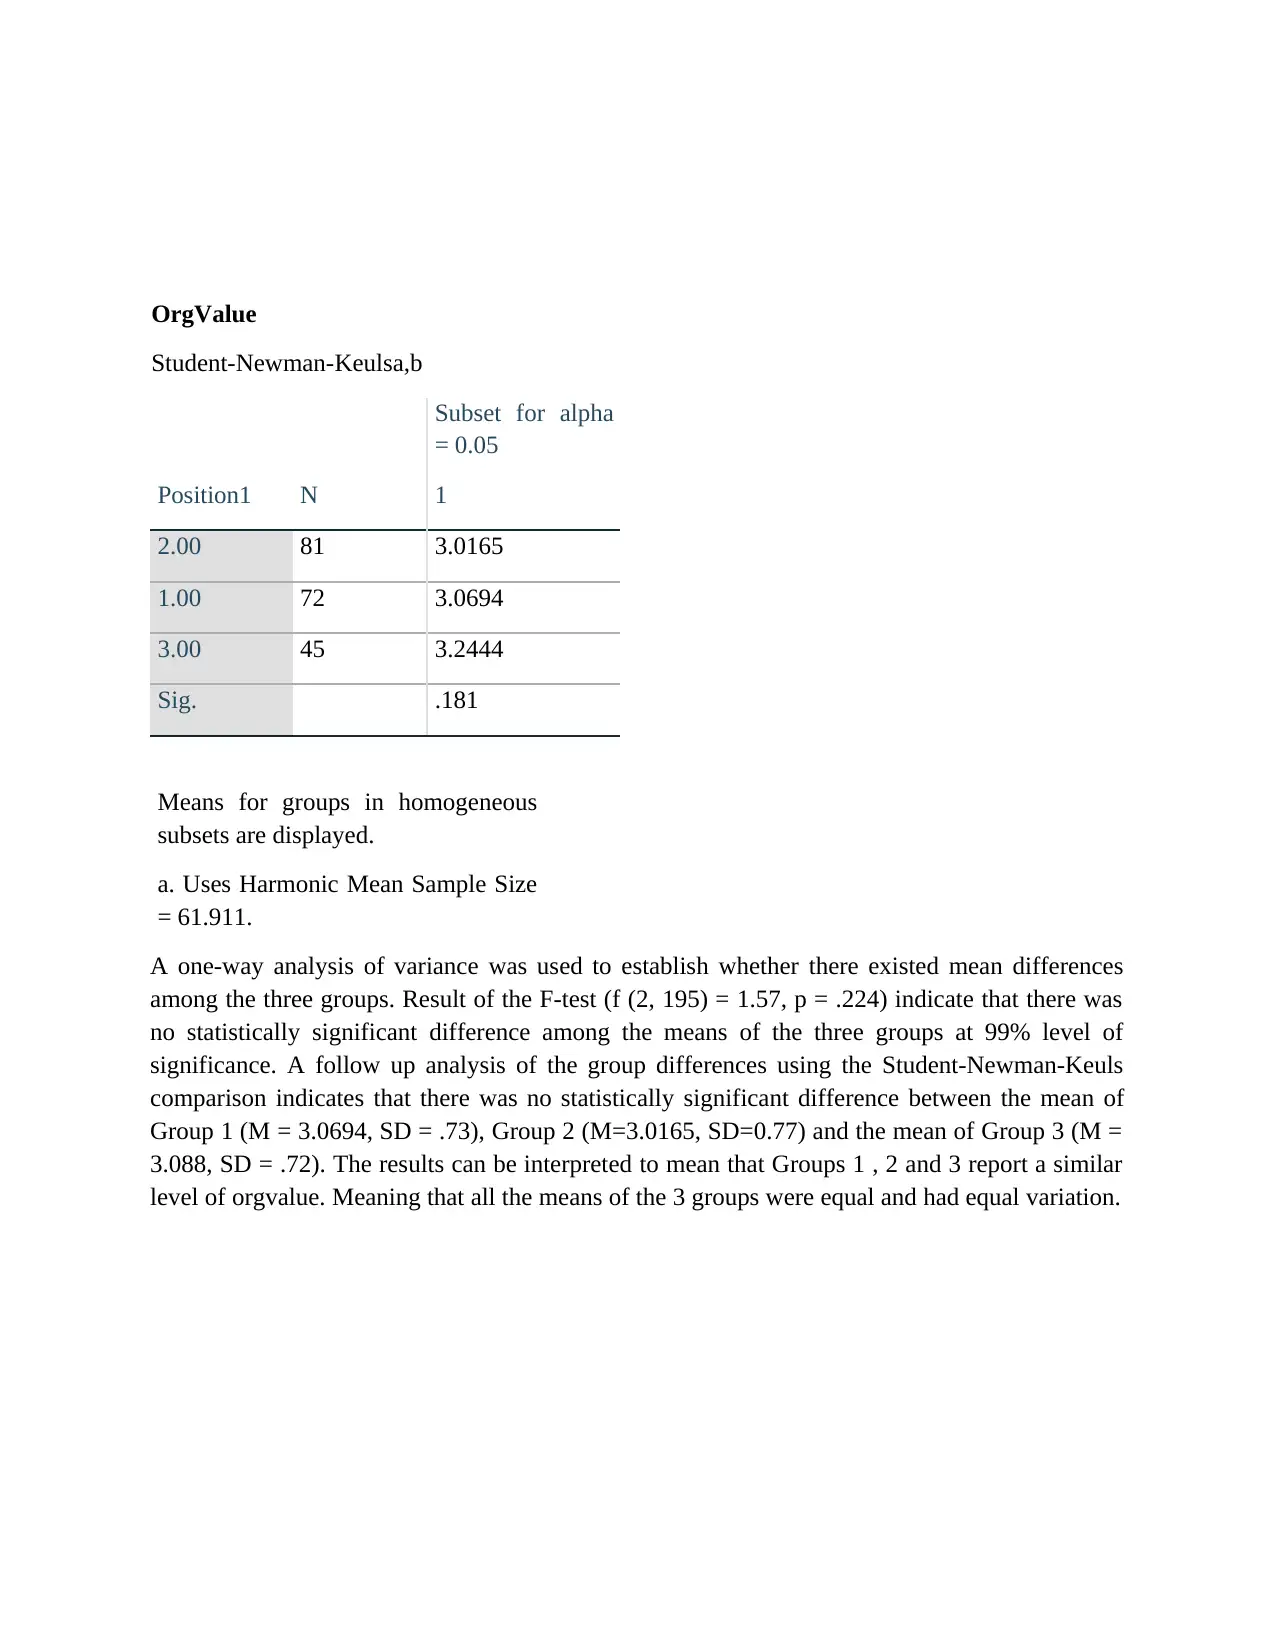
OrgValue
Student-Newman-Keulsa,b
Position1 N
Subset for alpha
= 0.05
1
2.00 81 3.0165
1.00 72 3.0694
3.00 45 3.2444
Sig. .181
Means for groups in homogeneous
subsets are displayed.
a. Uses Harmonic Mean Sample Size
= 61.911.
A one-way analysis of variance was used to establish whether there existed mean differences
among the three groups. Result of the F-test (f (2, 195) = 1.57, p = .224) indicate that there was
no statistically significant difference among the means of the three groups at 99% level of
significance. A follow up analysis of the group differences using the Student-Newman-Keuls
comparison indicates that there was no statistically significant difference between the mean of
Group 1 (M = 3.0694, SD = .73), Group 2 (M=3.0165, SD=0.77) and the mean of Group 3 (M =
3.088, SD = .72). The results can be interpreted to mean that Groups 1 , 2 and 3 report a similar
level of orgvalue. Meaning that all the means of the 3 groups were equal and had equal variation.
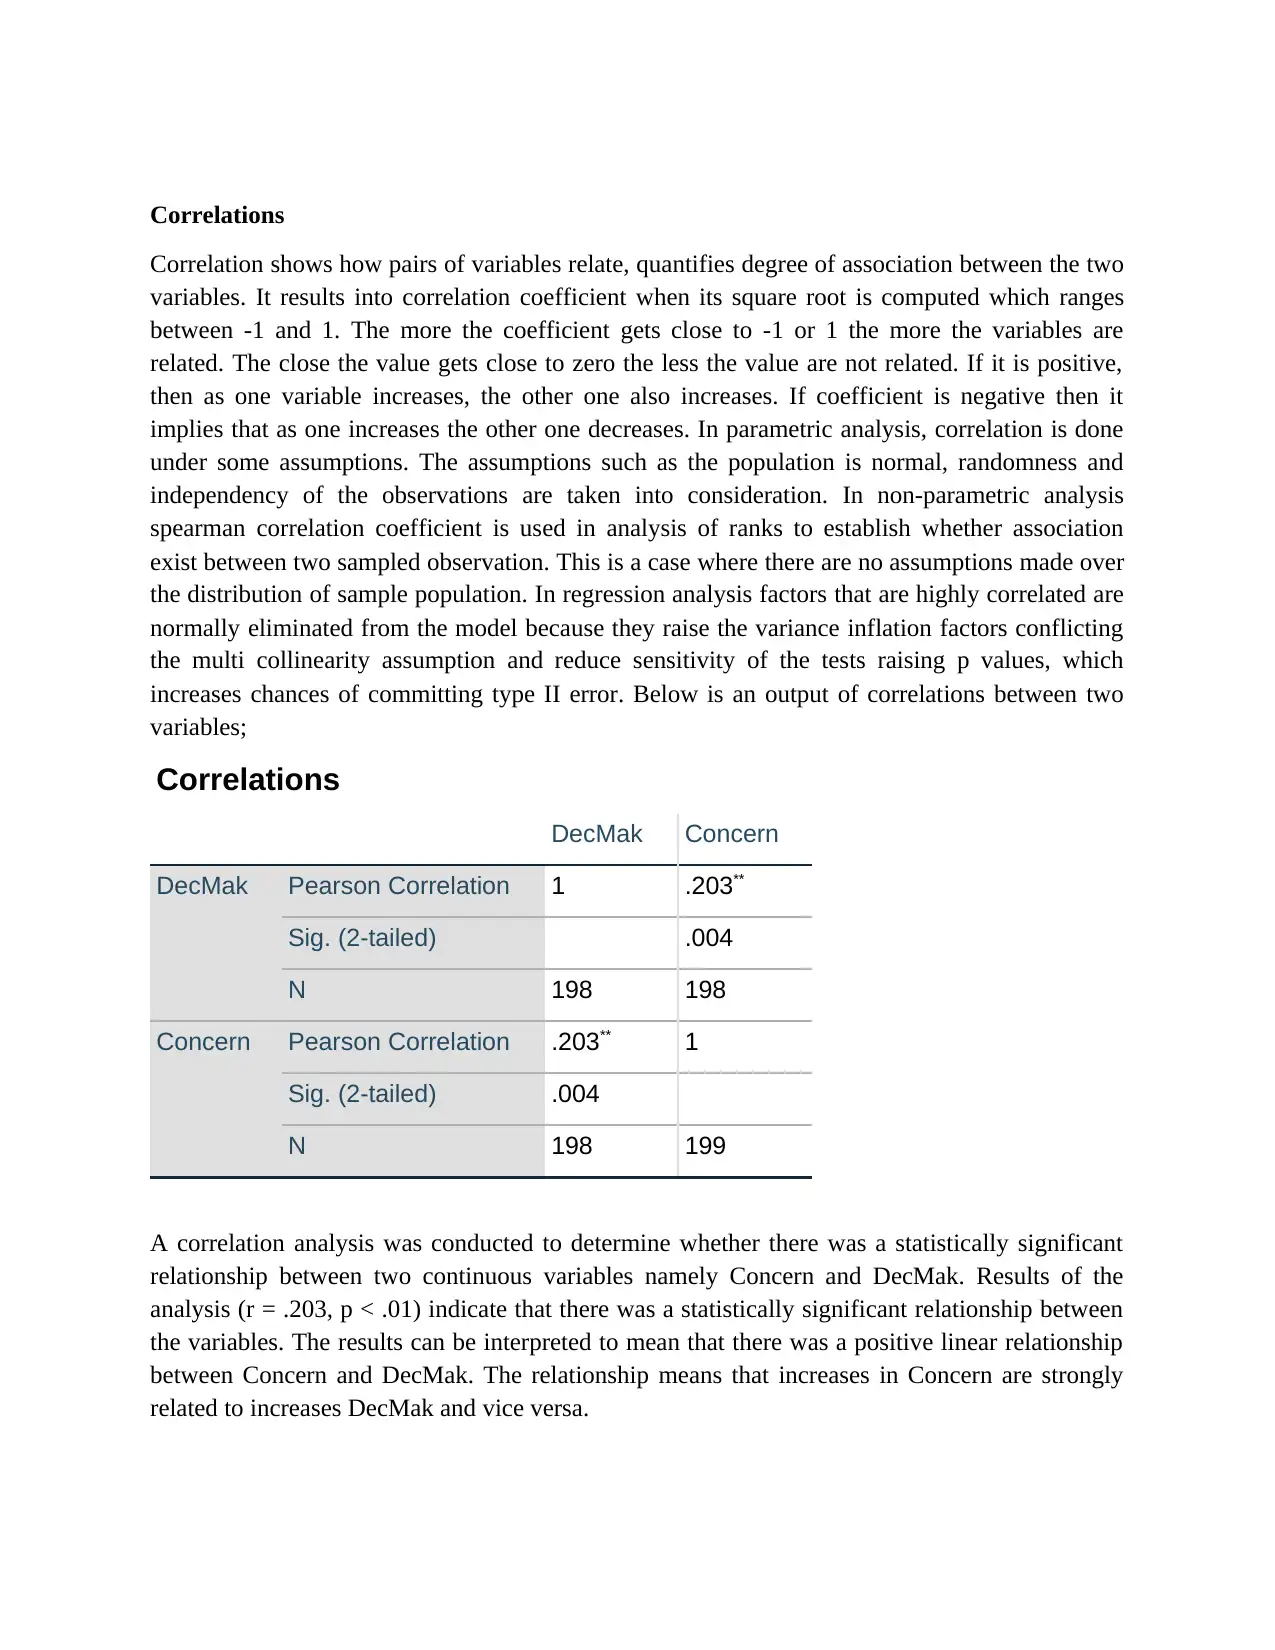
Correlations
Correlation shows how pairs of variables relate, quantifies degree of association between the two
variables. It results into correlation coefficient when its square root is computed which ranges
between -1 and 1. The more the coefficient gets close to -1 or 1 the more the variables are
related. The close the value gets close to zero the less the value are not related. If it is positive,
then as one variable increases, the other one also increases. If coefficient is negative then it
implies that as one increases the other one decreases. In parametric analysis, correlation is done
under some assumptions. The assumptions such as the population is normal, randomness and
independency of the observations are taken into consideration. In non-parametric analysis
spearman correlation coefficient is used in analysis of ranks to establish whether association
exist between two sampled observation. This is a case where there are no assumptions made over
the distribution of sample population. In regression analysis factors that are highly correlated are
normally eliminated from the model because they raise the variance inflation factors conflicting
the multi collinearity assumption and reduce sensitivity of the tests raising p values, which
increases chances of committing type II error. Below is an output of correlations between two
variables;
Correlations
DecMak Concern
DecMak Pearson Correlation 1 .203**
Sig. (2-tailed) .004
N 198 198
Concern Pearson Correlation .203** 1
Sig. (2-tailed) .004
N 198 199
A correlation analysis was conducted to determine whether there was a statistically significant
relationship between two continuous variables namely Concern and DecMak. Results of the
analysis (r = .203, p < .01) indicate that there was a statistically significant relationship between
the variables. The results can be interpreted to mean that there was a positive linear relationship
between Concern and DecMak. The relationship means that increases in Concern are strongly
related to increases DecMak and vice versa.
⊘ This is a preview!⊘
Do you want full access?
Subscribe today to unlock all pages.
Trusted by 1+ million students worldwide
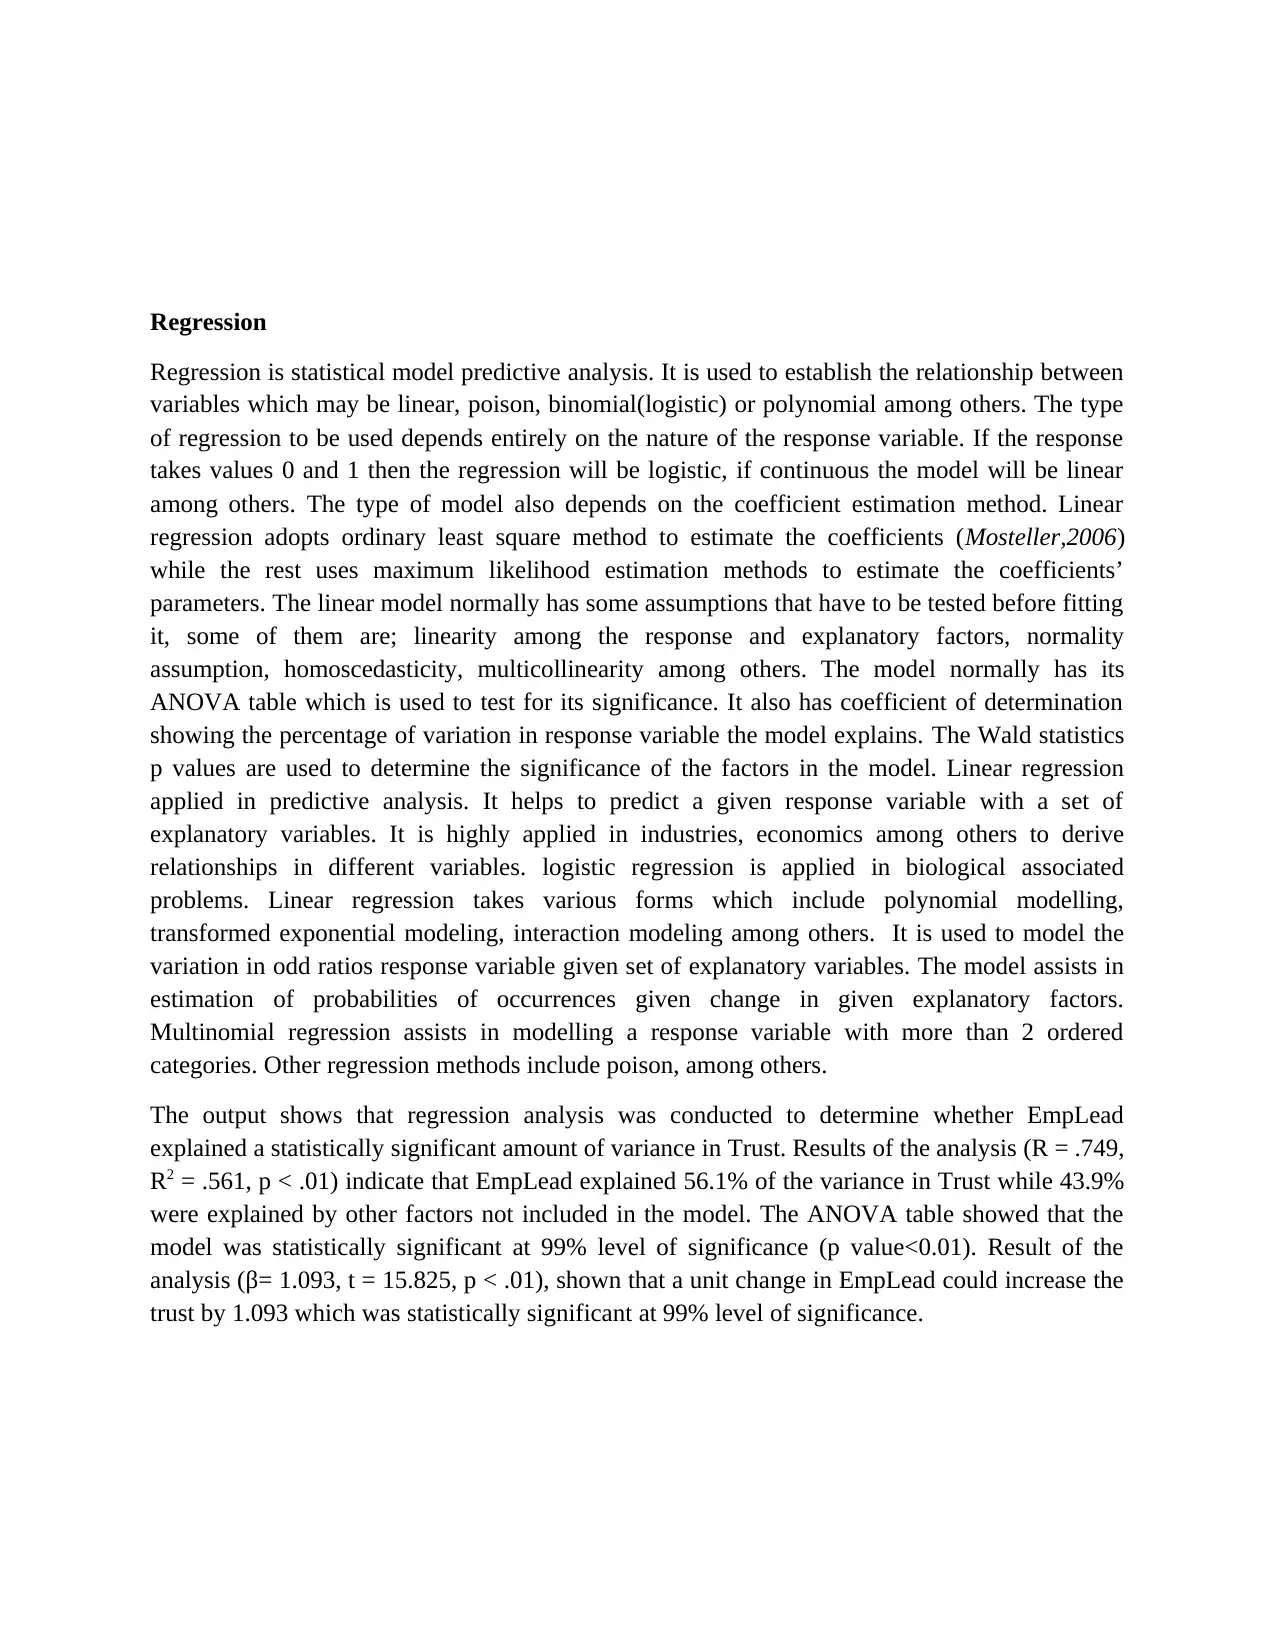
Regression
Regression is statistical model predictive analysis. It is used to establish the relationship between
variables which may be linear, poison, binomial(logistic) or polynomial among others. The type
of regression to be used depends entirely on the nature of the response variable. If the response
takes values 0 and 1 then the regression will be logistic, if continuous the model will be linear
among others. The type of model also depends on the coefficient estimation method. Linear
regression adopts ordinary least square method to estimate the coefficients (Mosteller,2006)
while the rest uses maximum likelihood estimation methods to estimate the coefficients’
parameters. The linear model normally has some assumptions that have to be tested before fitting
it, some of them are; linearity among the response and explanatory factors, normality
assumption, homoscedasticity, multicollinearity among others. The model normally has its
ANOVA table which is used to test for its significance. It also has coefficient of determination
showing the percentage of variation in response variable the model explains. The Wald statistics
p values are used to determine the significance of the factors in the model. Linear regression
applied in predictive analysis. It helps to predict a given response variable with a set of
explanatory variables. It is highly applied in industries, economics among others to derive
relationships in different variables. logistic regression is applied in biological associated
problems. Linear regression takes various forms which include polynomial modelling,
transformed exponential modeling, interaction modeling among others. It is used to model the
variation in odd ratios response variable given set of explanatory variables. The model assists in
estimation of probabilities of occurrences given change in given explanatory factors.
Multinomial regression assists in modelling a response variable with more than 2 ordered
categories. Other regression methods include poison, among others.
The output shows that regression analysis was conducted to determine whether EmpLead
explained a statistically significant amount of variance in Trust. Results of the analysis (R = .749,
R2 = .561, p < .01) indicate that EmpLead explained 56.1% of the variance in Trust while 43.9%
were explained by other factors not included in the model. The ANOVA table showed that the
model was statistically significant at 99% level of significance (p value<0.01). Result of the
analysis (β= 1.093, t = 15.825, p < .01), shown that a unit change in EmpLead could increase the
trust by 1.093 which was statistically significant at 99% level of significance.
Paraphrase This Document
Need a fresh take? Get an instant paraphrase of this document with our AI Paraphraser
References
Yu, C. H. (1977). Exploratory data analysis. Methods, 2, 131-160.
Ryan, C. G., E. Clayton, W. L. Griffin, S. H. Sie, and D. R. Cousens. "SNIP, a statistics-sensitive
background treatment for the quantitative analysis of PIXE spectra in geoscience
applications." Nuclear Instruments and Methods in Physics Research Section B: Beam
Interactions with Materials and Atoms 34, no. 3 (1988): 396-402.
Fisz, M., & Bartoszyński, R. (2018). Probability theory and mathematical statistics (Vol. 3). J.
wiley.
Bryman, A., & Cramer, D. (2002). Quantitative data analysis with SPSS release 10 for
Windows: A guide for social scientists. Routledge.
Bewick, V., Cheek, L., & Ball, J. (2004). Statistics review 9: one-way analysis of
variance. Critical care, 8(2), 130.
Norušis, M. J. (2006). SPSS 14.0 guide to data analysis. Upper Saddle River, NJ: Prentice Hall.
Miles, M. B., Huberman, A. M., Huberman, M. A., & Huberman, M. (1994). Qualitative data
analysis: An expanded sourcebook. sage.
Bazeley, P., & Jackson, K. (Eds.). (2013). Qualitative data analysis with NVivo. Sage
Publications Limited.
Mosteller, F., & Tukey, J. W. (1977). Data analysis and regression: a second course in
statistics. Addison-Wesley Series in Behavioral Science: Quantitative Methods.
Olson, C. L. (1976). On choosing a test statistic in multivariate analysis of
variance. Psychological bulletin, 83(4), 579.
Davis, J. C., & Sampson, R. J. (1986). Statistics and data analysis in geology (Vol. 646). New
York et al.: Wiley.
Cohen, P., West, S. G., & Aiken, L. S. (2014). Applied multiple regression/correlation analysis
for the behavioral sciences. Psychology Press
Zou, K. H., Tuncali, K., & Silverman, S. G. (2003). Correlation and simple linear
regression. Radiology, 227(3), 617-628.
Lee Rodgers, J., & Nicewander, W. A. (1988). Thirteen ways to look at the correlation
coefficient. The American Statistician, 42(1), 59-66.
Cruz, C. D. (2013). Genes: a software package for analysis in experimental statistics and
quantitative genetics. Acta Scientiarum. Agronomy, 35(3), 271-276.
Seber, G. A., & Lee, A. J. (2012). Linear regression analysis(Vol. 329). John Wiley & Sons.
1 out of 8
Related Documents


Your All-in-One AI-Powered Toolkit for Academic Success.
+13062052269
info@desklib.com
Available 24*7 on WhatsApp / Email
![[object Object]](/_next/static/media/star-bottom.7253800d.svg)
Unlock your academic potential
Copyright © 2020–2026 A2Z Services. All Rights Reserved. Developed and managed by ZUCOL.