Quantitative Data Analysis Assignment for DDBA 8307, Week 2 Analysis

Verified

Added on  2022/11/16

|14
|1209
|441
Homework Assignment
AI Summary
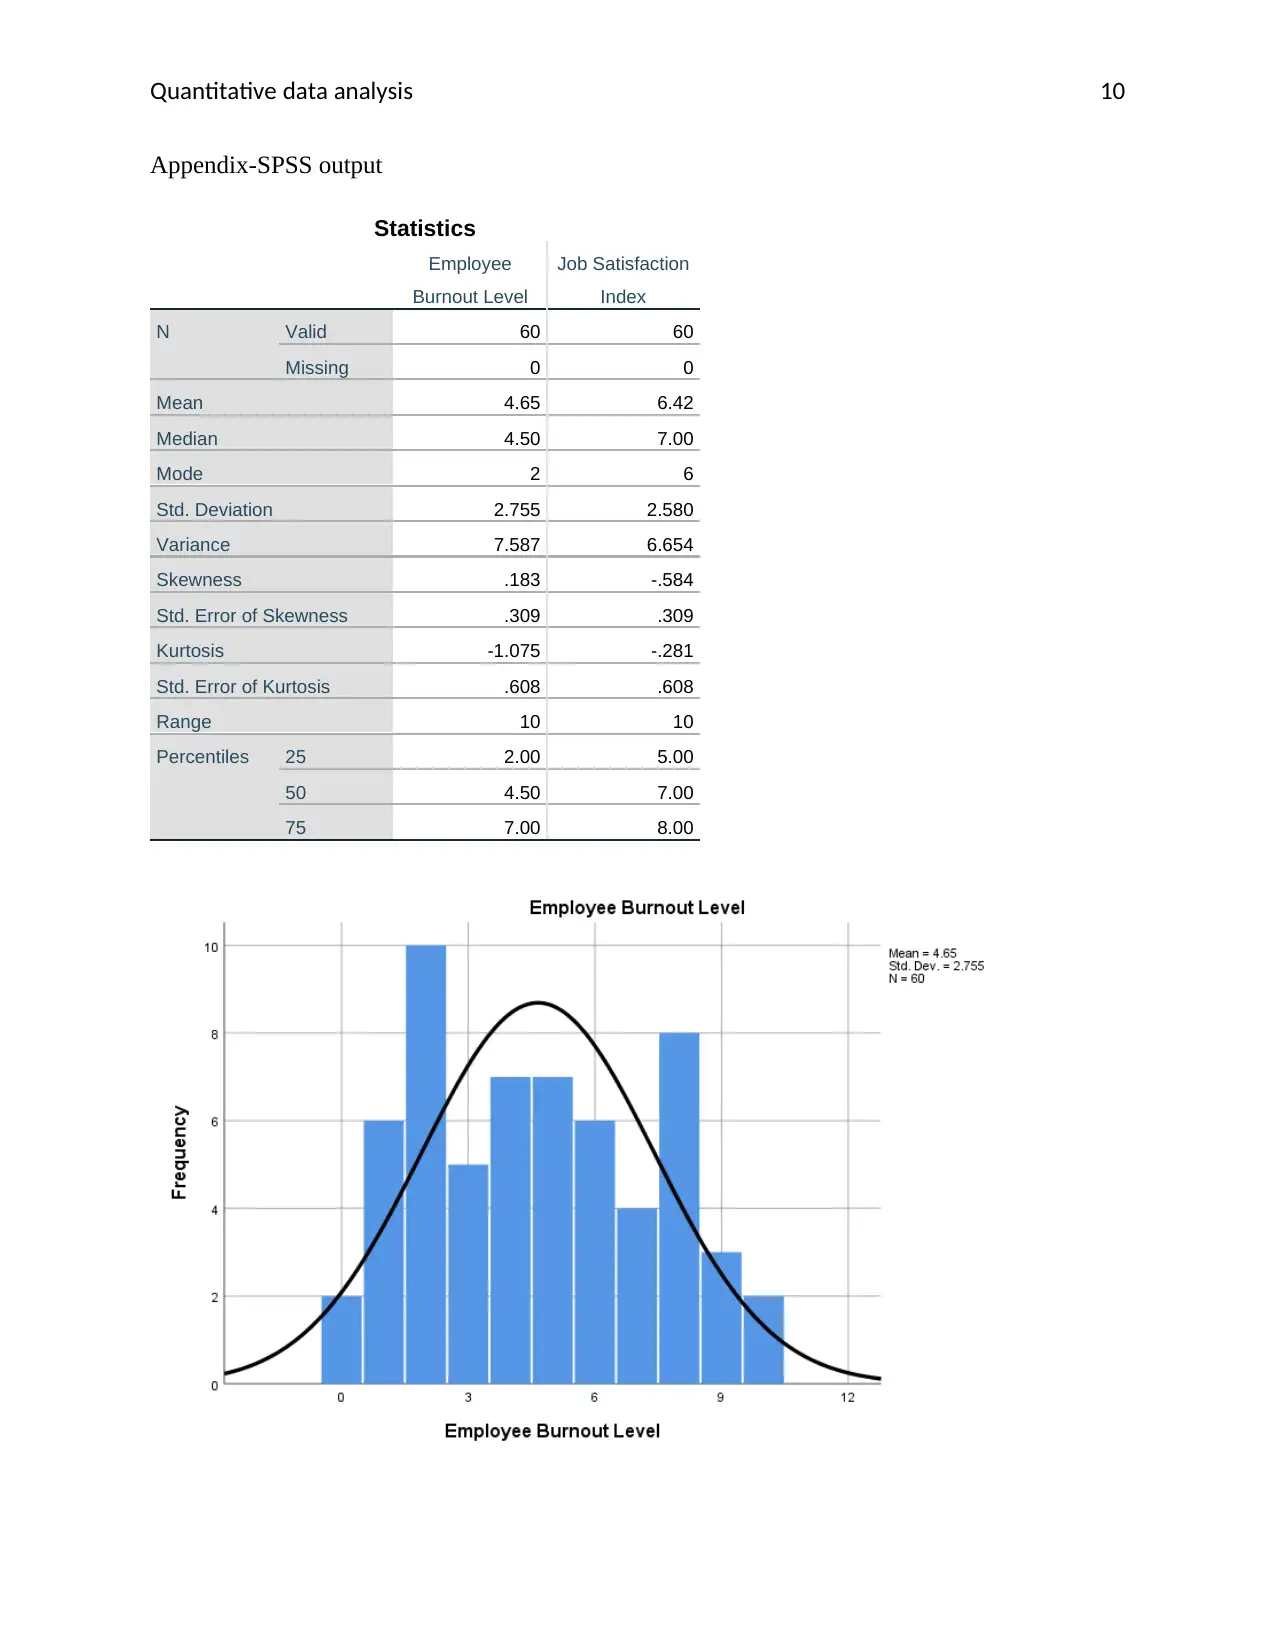
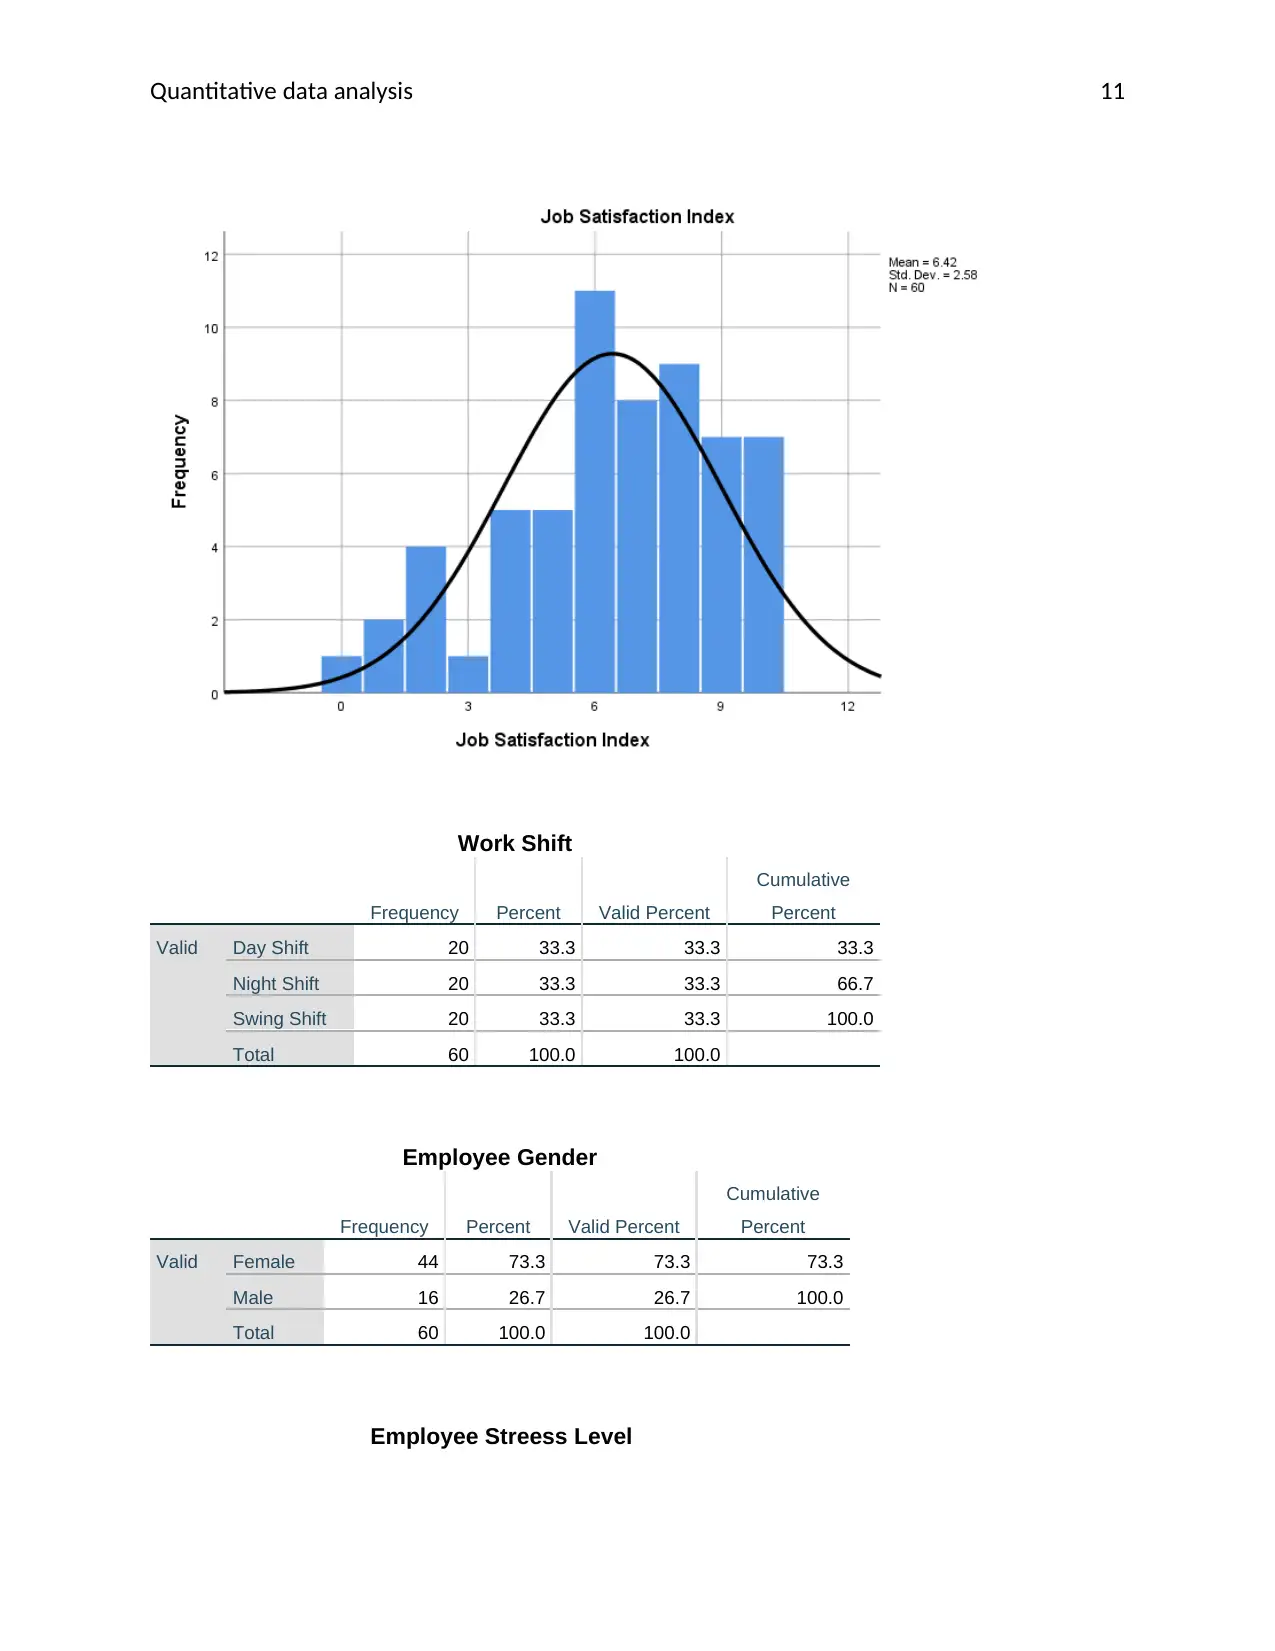
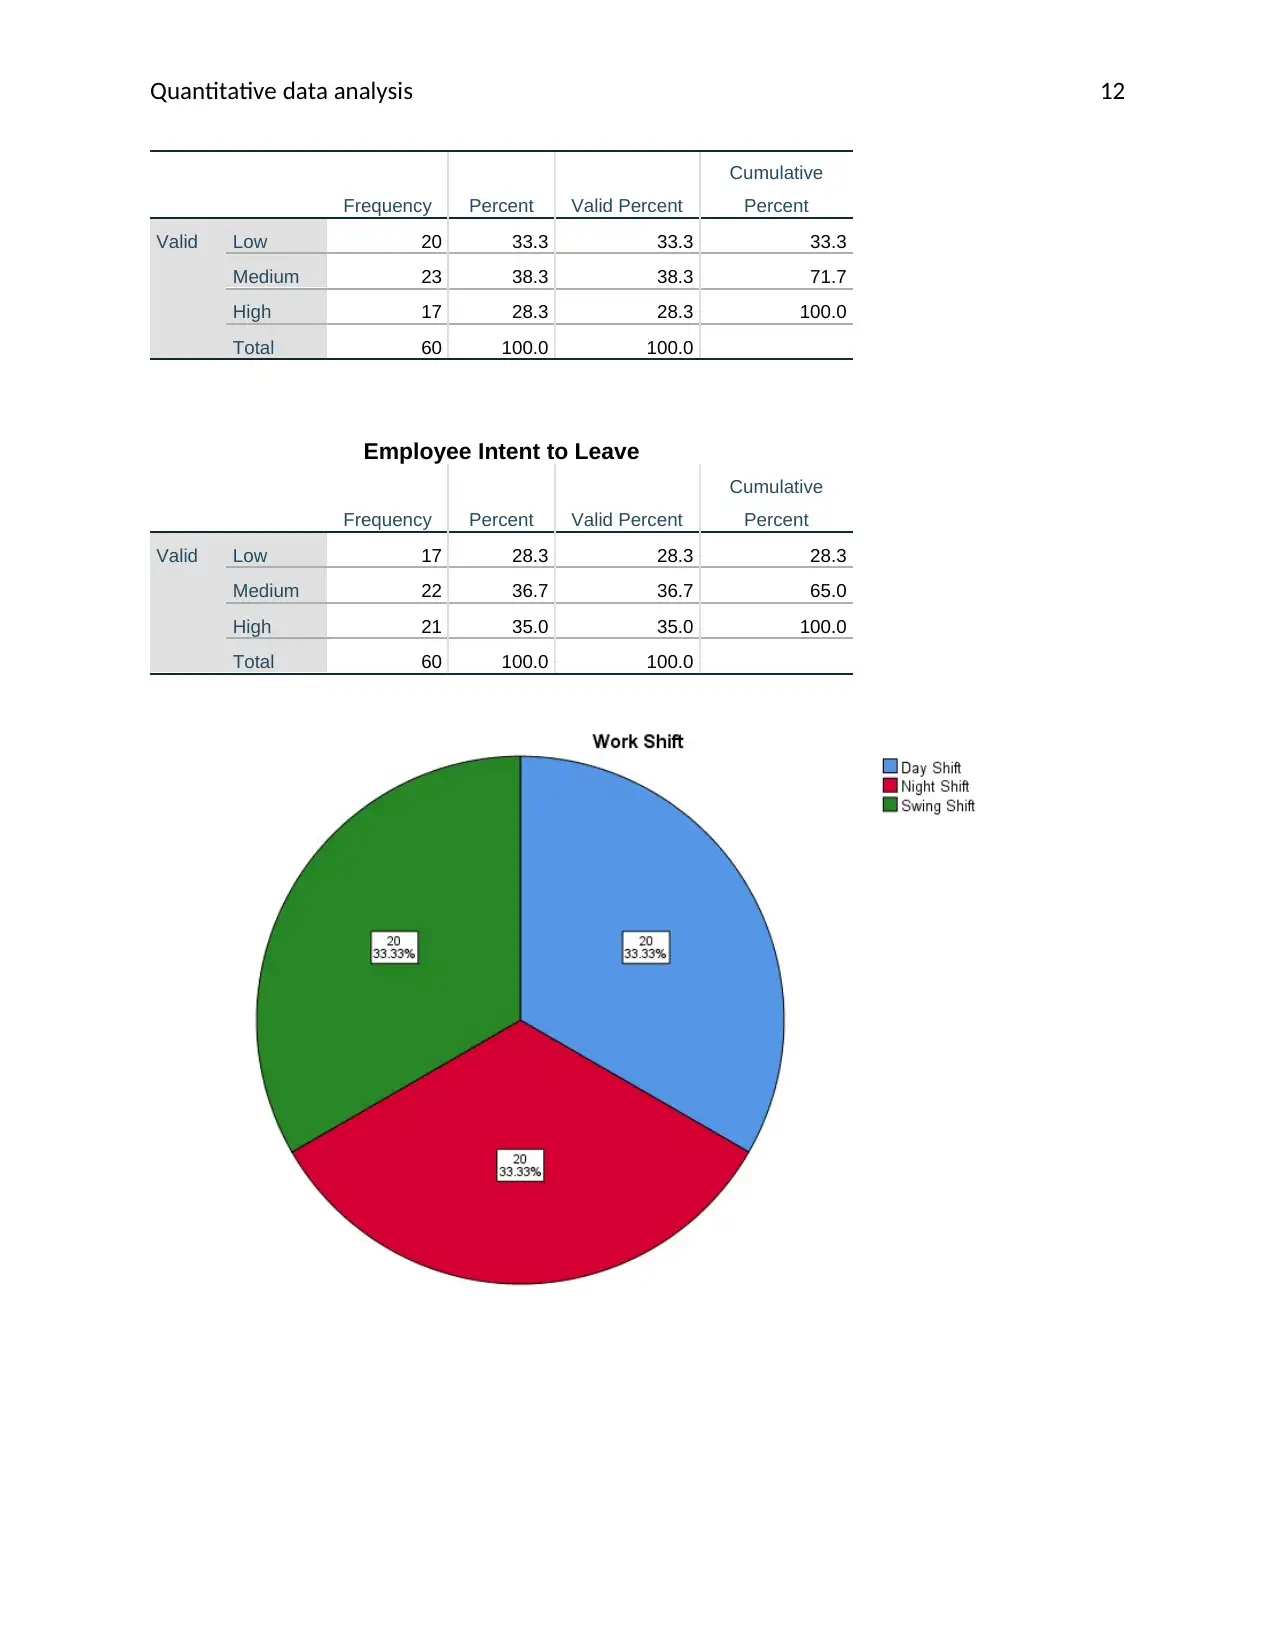
This assignment focuses on quantitative data analysis, addressing the implications of scales of measurement in research. The solution provides a detailed analysis of employee data, including burnout levels, job satisfaction, work shifts, gender, stress levels, and intention to leave. Descriptive statistics, such as means, standard deviations, frequencies, and percentages, are presented using APA-formatted tables and figures (histograms and pie charts). The analysis incorporates SPSS output to support the findings and includes relevant citations. The assignment covers the four scales of measurement: nominal, ordinal, interval, and ratio, and their impact on statistical methods. The research question explores the descriptive statistics of various variables, offering insights into employee characteristics and attitudes. The document includes the SPSS output for the analysis.
tabler-icon-diamond-filled.svg

Contribute Materials

Your contribution can guide someone’s learning journey. Share your documents today.
Document Page
Running head: Quantitative data analysis 1
Quantitative data analysis
Name1
Course2
Institution3
Lecturer4
Date5
1 The name of the student
2 The course title
3 The institution
4 The name of the Lecturer
5 The date of submission
tabler-icon-diamond-filled.svg

Secure Best Marks with AI Grader

Need help grading? Try our AI Grader for instant feedback on your assignments.
Document Page
Quantitative data analysis 2
Scale of Measurement
When conducting data analysis, one should consider some aspects. One of the aspects that
should be considered is the research question, and the most important aspect is the scale of
measurements. They are four scale measurement types of data. They include Nominal, ordinal,
Interval and Ratio. Scale measurement defines the nature of the data assigned to the given
variable. Nominal scales assigns numbers into objects. They label the names. The ordinal scale
assigns values to the objects in a meaning order. It is frequently used to assign values in
questionnaire. Interval is numeric values which are ordered in equal intervals. Example, one can
decide to categories age of people in a level of 10, i.e. 10-20, 20-30, etc. Ratio scales involves
continuous data (Brown, 2011).
The scale of measurement determines the descriptive and inferential statistics that should be
conducted. When conducting descriptive statistics of nominal, ordinal and interval data, we
mainly focus on the frequency distribution and representation of the data in bar chart, and We
can also determine the mode of all of them. Ratio scale is superior since one can extract a lot of
information from it. One can develop both measures of central tendency (i.e. the mean, the
median, and the mode) and the measure of dispersion (i.e. range, standard deviation, and
variance). One can also obtain the distribution of the data using skewness and charts
(histogram and box plot) (Holcomb, 2016). We use linear regression on the ratio scale data.
When using nominal, ordinal and interval data, we can either use Multinomial logistic
regression or Ordinal logistic regression. These different types of regression are conducted in
different unique ways and the results and interpreted differently. Therefore, there is a need to
consider the scale of measurement for data preparation, data entry and when conducting the
data analysis
Research question
What are the means, standard deviations, frequencies, and percentages of Week 2 Assignment?
Presentation of Findings
This research question focuses on descriptive statistics. This means that the descriptive statistics
will be conducted on the data provided on the employees satisfaction6. This will include the
measure of central tendency and dispersion, frequency distribution and the visualizations of the
data using pie charts. We will use the APA format to format the tables obtained from the
analysis7.
6 The title of the data
7 The tables and figures from your SPSS output will need to be copied and pasted in the appropriate location.
Document Page
Quantitative data analysis 3
Descriptive Statistics8
The descriptive statistics were conducted for both the quantitative data (Employee Burnout Level
and Job Satisfaction Index) and qualitative data (Work shift, Employee Gender, Employee Stress
Level, and Employee Intent to Leave). Table 1 will show the standard deviation and the mean of
the employee burnout level and the job satisfaction level. Figure 1 a and b will show the
histogram of the distribution of the employee burnout level and the job satisfaction level. Table 2
will show the standard deviation and the mean of the Work shift, Employee Gender, Employee
Stress Level and Employee Intent to Leave. Figure 2 a, b, c and d will show the pie chart of
Work shift, Employee Gender, Employee Stress Level and Employee Intent to Leave.
Table 19
Means (M) and Standard Deviations (SD) for Study
Quantitative Variables (N = 60)
Variable10 M SD
Employee Burnout Level 4.65 2.75
Job Satisfaction Index 6.42 2.58
The mean and standard deviation of the employee burnout level was obtained to be (M = 4.65,
SD = 2.75) while the mean and the standard deviation of the job satisfaction was obtained to be
(M = 6.42, SD = 2.58)
Figure 1 a: Histogram of the employee burnout level
8 The descriptive Statistics for both the qualitative and quantitative data will be conducted
9 The output obtained from the SPSS was copied and pasted in Excel, formatted in the appropriate APA format. The
table displaying the mean and standard deviation of the two variables
10 This columns displays the variable names which have been aligned in rows
Document Page
Quantitative data analysis 4
Figure 1 b: Histogram of the Job satisfaction Index
Table 211
Means (M) and Standard Deviations (SD) for Study
11 Displays the frequency distribution of the qualitative data (nominal scale, ordinal scale)
tabler-icon-diamond-filled.svg

Secure Best Marks with AI Grader

Need help grading? Try our AI Grader for instant feedback on your assignments.
Document Page
Quantitative data analysis 5
Quantitative Variables (N = 60)
Variable Frequency Percent
Work
Shift
Day Shift 20 33.3
Night Shift 20 33.3
Swing Shift 20 33.3
Total 60 100
Employee Gender
Female 44 73.3
Male 16 26.7
Total 60 100
Employee Stress Level
Low 20 33.3
Medium 23 38.3
High 17 28.3
Total 60 100
Employee Intent to Leave
Low 17 28.3
Medium 22 36.7
High 21 35.0
Total 60 100
Fig 2 a: Pie chart of the Work Shift12
12 Shows the pie chart of the work shift in both frequency and percentages
Document Page
Quantitative data analysis 6
The pie chart shows that the employees were divided equally into shifts, i.e. 33.3 % each.
Fig 2 b: Pie chart of employee gender13
13 Shows the pie chart of the employees gender in both frequency and percentages
Document Page
Quantitative data analysis 7
The pie chart below shows that 44 (73.33 %) of the employees were female, while 16 (26.67 %)
of the employees were male.
Fig 2 c: Pie chart of employee stress level14
The pie chart above shows that 23 (38.33 %) had a medium stress level. 20 (33.33 %) of the
employees had low-stress level while 17 (28.33 %) of the employees had a high-stress level.
Fig 2 d: Pie chart of employee intention to leave15
14 Shows the pie chart of the employees stress level in both frequency and percentages
15 Shows the pie chart of the employees intention to leave( in both frequency and percentages)
tabler-icon-diamond-filled.svg

Paraphrase This Document

Need a fresh take? Get an instant paraphrase of this document with our AI Paraphraser
Document Page
Quantitative data analysis 8
The pie chart above shows that 22 (36.67 %) of the employees had a medium intention of
leaving the work. 17 (28.33 %) of the employees had a low intention of leaving the work, while
21 (35 %) of the employees had a high intention of leaving the work.
Document Page
Quantitative data analysis 9
Reference
Brown, J. D. (2011). Likert items and scales of measurement. Statistics, 15(1), 10-14. Available
at: http://hosted.jalt.org/test/bro_34.htm
Holcomb, Z. C. (2016). Fundamentals of descriptive statistics. Routledge. Available at:
https://www.researchgate.net/publication/235432508_Foundations_of_Descriptive_and_I
nferential_Statistics_version_4
Document Page
Quantitative data analysis 10
Appendix-SPSS output
Statistics
Employee
Burnout Level
Job Satisfaction
Index
N Valid 60 60
Missing 0 0
Mean 4.65 6.42
Median 4.50 7.00
Mode 2 6
Std. Deviation 2.755 2.580
Variance 7.587 6.654
Skewness .183 -.584
Std. Error of Skewness .309 .309
Kurtosis -1.075 -.281
Std. Error of Kurtosis .608 .608
Range 10 10
Percentiles 25 2.00 5.00
50 4.50 7.00
75 7.00 8.00
tabler-icon-diamond-filled.svg

Secure Best Marks with AI Grader

Need help grading? Try our AI Grader for instant feedback on your assignments.
Document Page
Quantitative data analysis 11
Work Shift
Frequency Percent Valid Percent
Cumulative
Percent
Valid Day Shift 20 33.3 33.3 33.3
Night Shift 20 33.3 33.3 66.7
Swing Shift 20 33.3 33.3 100.0
Total 60 100.0 100.0
Employee Gender
Frequency Percent Valid Percent
Cumulative
Percent
Valid Female 44 73.3 73.3 73.3
Male 16 26.7 26.7 100.0
Total 60 100.0 100.0
Employee Streess Level
Document Page
Quantitative data analysis 12
Frequency Percent Valid Percent
Cumulative
Percent
Valid Low 20 33.3 33.3 33.3
Medium 23 38.3 38.3 71.7
High 17 28.3 28.3 100.0
Total 60 100.0 100.0
Employee Intent to Leave
Frequency Percent Valid Percent
Cumulative
Percent
Valid Low 17 28.3 28.3 28.3
Medium 22 36.7 36.7 65.0
High 21 35.0 35.0 100.0
Total 60 100.0 100.0
Document Page
Quantitative data analysis 13
tabler-icon-diamond-filled.svg

Paraphrase This Document

Need a fresh take? Get an instant paraphrase of this document with our AI Paraphraser
Document Page
Quantitative data analysis 14
chevron_up_icon
1 out of 14
circle_padding
hide_on_mobile
zoom_out_icon
logo.png

Your All-in-One AI-Powered Toolkit for Academic Success.

Available 24*7 on WhatsApp / Email

[object Object]