Quantitative Techniques for Decision Making: A Report
VerifiedAdded on 2021/02/21
|13
|2630
|44
Report
AI Summary
This report delves into quantitative techniques used for effective decision-making in business contexts. It begins by outlining quantitative modelling concepts, differentiating between decision-making under certainty, uncertainty, and risk, and then explores tools such as decision trees and decision tables. The report discusses classical decision theory and the logical process of modelling complex decision problems, emphasizing the importance of these techniques for sound management decisions. Practical applications are illustrated with real-world examples, including investment scenarios solved using Excel. The report concludes by summarizing the various tools and methodologies discussed, providing a comprehensive overview of quantitative techniques for decision-making.

DECISION MAKING
Paraphrase This Document
Need a fresh take? Get an instant paraphrase of this document with our AI Paraphraser
TABLE OF CONTENTS
INTRODUCTION...........................................................................................................................1
TASK...............................................................................................................................................1
1. Quantitative modelling concepts for solving problems and decision making.........................1
Classical decision theory.............................................................................................................2
Logical process of modelling complex decision problems..........................................................3
Apply techniques to real-world problems....................................................................................4
Solution of problem by using excel.............................................................................................8
CONCLSUION................................................................................................................................9
REFERENCES..............................................................................................................................10
INTRODUCTION
Quantitative techniques are useful for management in order to make sound and quality
decisions. These are logical judgements that aid in analysing resources and consequence of each
action (Cascetta and et.al., 2015). Finally, best interest solution is implemented to resolve the
problems. Present report will discuss difference between decision making under certainty,
uncertainty and risk. It will evaluate the various tools such as decision tree, table, etc. In addition
to this, assignment will give practical examples to solve real world problems by using different
quantitative tools.
TASK
1. Quantitative modelling concepts for solving problems and decision making
It is very important for the manager that to understand the various issues of business unit
and take decision accordingly so that such problems can be resolved on time. Quantitative
techniques are used by managers in order to take quality decisions (Liu, 2019). Different
situations in which decisions need to make by managers are as below described:
Decision making in certain conditions
It is the state in which decision makers have good knowledge about future incidents on
some elements. Top management has alternative solutions and know the possible outcome
associated with each alternative solution (A Decision Table Example, 2018).
Decision making under risk
It is another situation in which manages have no perfect information about future
happenings and risk that might going to take place. They have incomplete information but have
lack of idea about probabilities of outcome (Paltayian and et.al., 2017).
Decision making under uncertainty
It is difficult to predict future incidents; decision makers cannot have information about
all conditions. In such condition managers have to make assumptions in order to make correct
decisions (A Decision Table Example, 2018).
These quantitative modelling tools are explained as below:
Decision making under risk: Decision trees method
It is the tool which highlights the overall picture of decision taken by management and
make the manager capable to draw the alternative decision path graphs. It is generally used when
company is suffering from marketing, investment, pricing issues (Suzuki, 2016). Whenever
1
⊘ This is a preview!⊘
Do you want full access?
Subscribe today to unlock all pages.
Trusted by 1+ million students worldwide
entity is facing any kind of risk then enterprise can take support of decision trees quantitative
modelling concept.
It is the graphical representation of judgement taken by higher authority, it analyses the
future condition and determine possible alternative ways through which such kinds of risk can be
avoided (A Decision Table Example, 2018).
Decision making under uncertainty: Maximax criterion
It is the state in which higher authorities of business are well aware with the actual nature
of uncertainty but have lack of information hence probability of occurrence cannot be
determined properly (Ramos-Quintana and et.al., 2018). This state is called as decision making
under uncertainty. For example, if company is planning to open a new branch then it has to face
many troubles such as competition, technological changes, demand shifting etc. All these are
uncertain conditions where managers have to consider all these uncertain aspects and have to
take correct decision so that desired outcome can be obtained.
Maximax criterion is the method in which management emphases more on maximum
payoff. Decision making always ensure to take such decision in which maximum payoff for each
action can be attained. Regret criterion is another quantitative method which can also be used in
such kind of uncertain situations (Govindan and et.al., 2015).
Decision making under certainty: Cause and effect relationship method and decision table
It is the condition in which decision maker has all the information that what kind of
certainty can be occurred and what ae essential alternatives. Cause and effect relationship
method can use for this thy of issue and manager can take decision accordingly. For example, if
firm plans to install a new piece of equipment then employer knows that what kinds of situations
might occur hence individual can analyses the best way through which such issues can be
resolved easily (A Decision Table Example, 2018).
Decision table is considered as most effective tool which is used by management to test
any action and managing requirements. It is helpful tool which helps in determining or detecting
combination of conditions that may give positive results. By this way actual requirement of
business become so clear (Pınarbaşı and et.al., 2017).
Classical decision theory
Classical approach explains that way how a decision of management can help in
achieving desired outcome. Managers have to make stable goal and have to take actions which
2
Paraphrase This Document
Need a fresh take? Get an instant paraphrase of this document with our AI Paraphraser
has specific rationale. Such theory is generally applied in the condition where decisions are
taken in certainty conditions (Rose and et.al., 2016). As in such certainty states decision makers
have great knowledge about problems and they have many alternative solutions to resolve that
problem. It works on four basic assumptions:
Problem is clearly defined and decision maker has made clear goal.
Environment is very certain and decision makers have power to avoid or eliminate any
kind of uncertain situations.
It believes that decision makers have all information and they can evaluate the alternative
ways effectively or can rank it objectively.
Such kind of theory can be applied in close system situations where environment is constant.
It cannot be applied in the real life situations (Cascetta and et.al., 2015). Decision makers have to
emphases on available alternatives. It ensures that their judgement can help in effective utility
from the taken decision. After that management has to rank each alternative way and have to
prioritise them so that desired outcome can be obtained. Managers take such decision which has
best interest or can give specific results to business unit
Logical process of modelling complex decision problems
Logical process or model is used to resolve complex problems. Management takes
evidence based judgements that helps in developing understanding about available resources and
issues that might occur by implementing any action. By this way managers can take accurate
decisions that may support in getting desired results (Liu, 2019). It is based on various
components:
Input: Decisions are taken on the bases of input available in situation such as financial,
human resource etc.
Activities: It shows the actions which are taken to resolve any issue or problem.
Output: When activity is implemented then immediate results get by managers are known
as output (A Decision Table Example, 2018).
Outcomes: It is also known as indicators which shows how situations are getting changed
after implementing particular judgement.
Impact: It emphases on long term results (Ramos-Quintana and et.al., 2018).
Advantage of using this logical modelling is to make effective planning and make
accurate assumptions. This is the tool which helps in intending actual relationship between
3
cause and effects. If any complex problem is faced by business, then it can take support of
logical modelling tool because by this way managers can make effective utilisation of
resources and can measure the outcome significantly. EBDM activities can be managed
and evaluated easily by using this technique. But logical modelling process is unable to
identify future states that might occur in such condition management may get failed to
evaluate the resources and output in easy manner (Govindan and et.al., 2015). It is not
static model, as things can get changed in the future hence it is difficult to measure
resources and determine their utility.
Logical method is beneficial in defining the problem in effective manner and
taking such judgements which has best interest. Giving rating or ranking to each alternative
option is beneficial in opting the correct option and getting desired results. Furth more, this
tools are helpful in resolving complex issues by breaking any task into sub-parts (Pınarbaşı
and et.al., 2017). But logical modelling method is time taking process and sometimes
managers takes longer duration to take final decision as individual has to evaluate each
situation. In such condition sometimes results get diluted and fail to give expected results.
It does not consider cause effect relationship and past information hence chances of getting
uncertain problems is high.
Apply techniques to real-world problems
Decision tree
It is the most appropriate technique which helps in making right decisions in uncertain
situations (Rose and et.al., 2016). Application of this tool is illustrated as below:
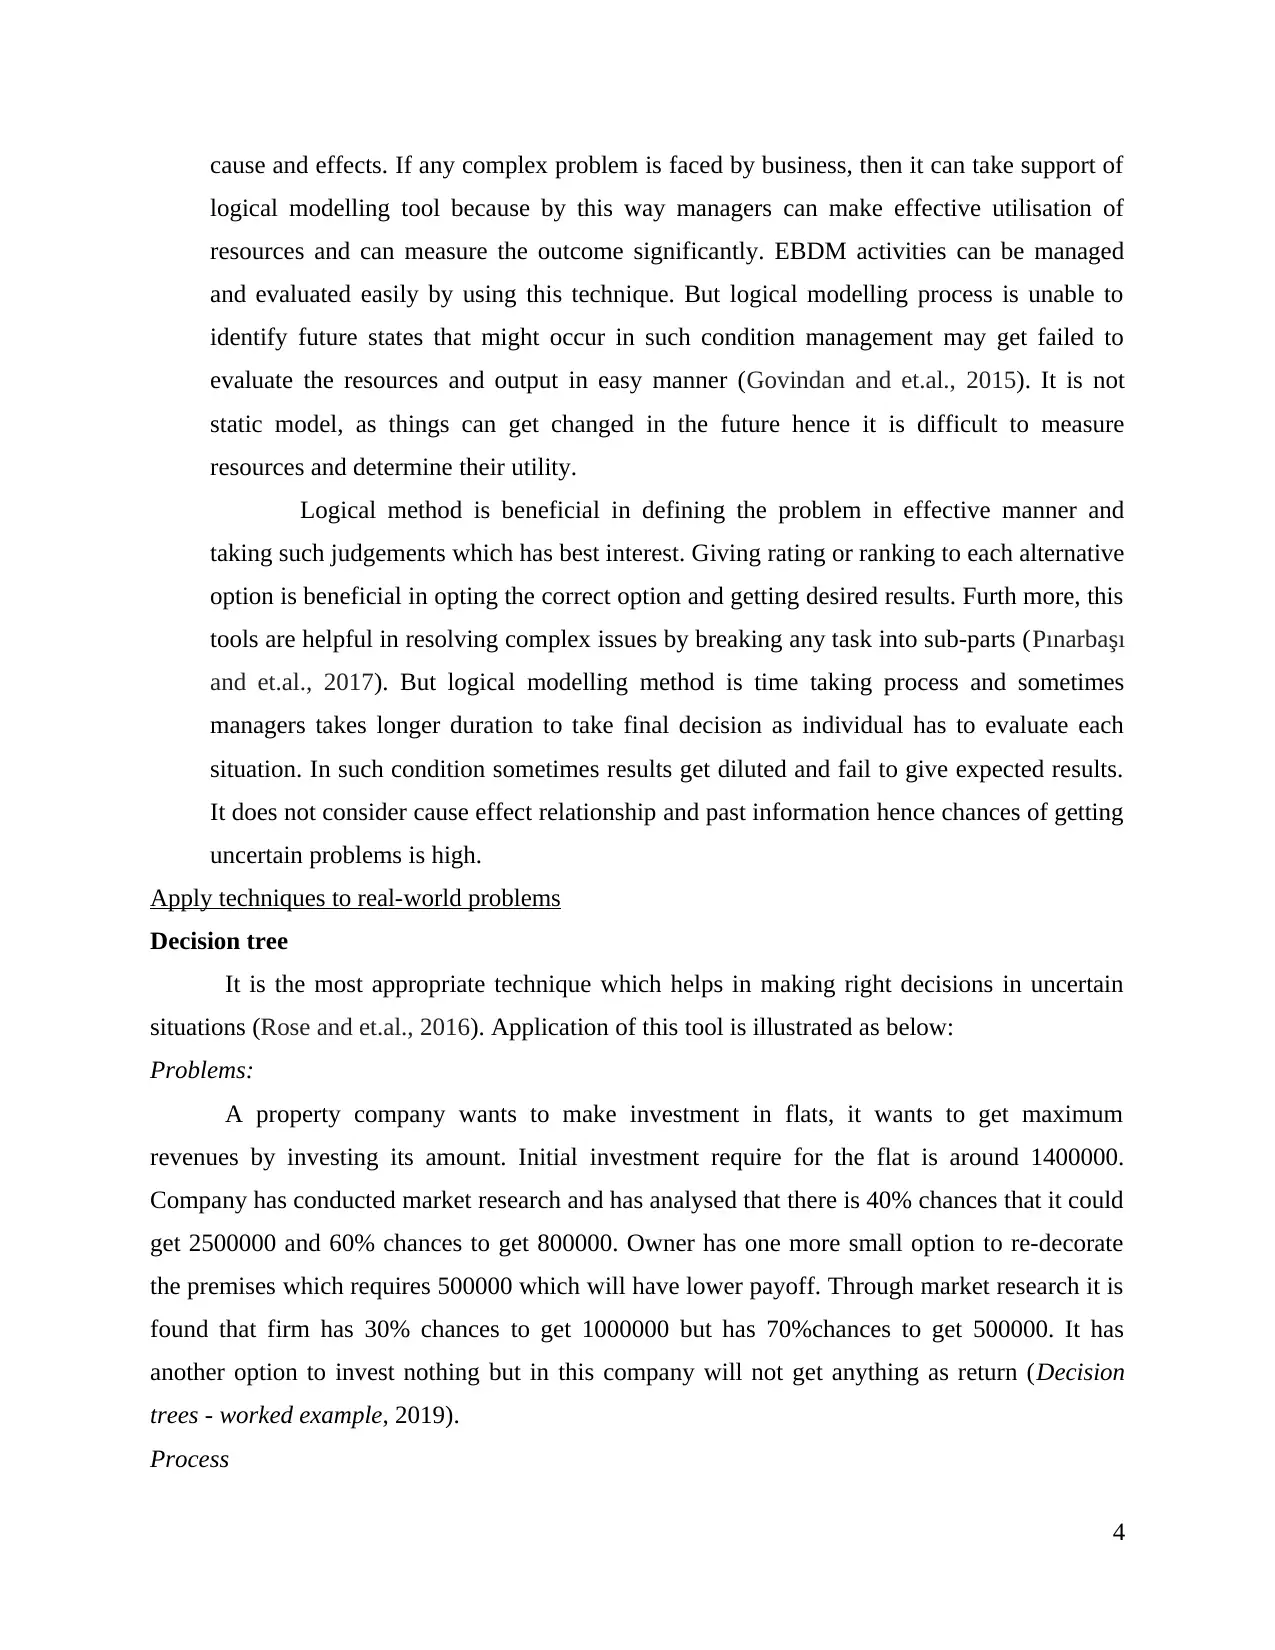
Problems:
A property company wants to make investment in flats, it wants to get maximum
revenues by investing its amount. Initial investment require for the flat is around 1400000.
Company has conducted market research and has analysed that there is 40% chances that it could
get 2500000 and 60% chances to get 800000. Owner has one more small option to re-decorate
the premises which requires 500000 which will have lower payoff. Through market research it is
found that firm has 30% chances to get 1000000 but has 70%chances to get 500000. It has
another option to invest nothing but in this company will not get anything as return (Decision
trees - worked example, 2019).
Process
4
logical modelling tool because by this way managers can make effective utilisation of
resources and can measure the outcome significantly. EBDM activities can be managed
and evaluated easily by using this technique. But logical modelling process is unable to
identify future states that might occur in such condition management may get failed to
evaluate the resources and output in easy manner (Govindan and et.al., 2015). It is not
static model, as things can get changed in the future hence it is difficult to measure
resources and determine their utility.
Logical method is beneficial in defining the problem in effective manner and
taking such judgements which has best interest. Giving rating or ranking to each alternative
option is beneficial in opting the correct option and getting desired results. Furth more, this
tools are helpful in resolving complex issues by breaking any task into sub-parts (Pınarbaşı
and et.al., 2017). But logical modelling method is time taking process and sometimes
managers takes longer duration to take final decision as individual has to evaluate each
situation. In such condition sometimes results get diluted and fail to give expected results.
It does not consider cause effect relationship and past information hence chances of getting
uncertain problems is high.
Apply techniques to real-world problems
Decision tree
It is the most appropriate technique which helps in making right decisions in uncertain
situations (Rose and et.al., 2016). Application of this tool is illustrated as below:
Problems:
A property company wants to make investment in flats, it wants to get maximum
revenues by investing its amount. Initial investment require for the flat is around 1400000.
Company has conducted market research and has analysed that there is 40% chances that it could
get 2500000 and 60% chances to get 800000. Owner has one more small option to re-decorate
the premises which requires 500000 which will have lower payoff. Through market research it is
found that firm has 30% chances to get 1000000 but has 70%chances to get 500000. It has
another option to invest nothing but in this company will not get anything as return (Decision
trees - worked example, 2019).
Process
4
⊘ This is a preview!⊘
Do you want full access?
Subscribe today to unlock all pages.
Trusted by 1+ million students worldwide
There are various options for the property company with possibleoutcome.It is illustreated as
When calculationis done and probability of various options are measured then it is found that
5
When calculationis done and probability of various options are measured then it is found that
5
Paraphrase This Document
Need a fresh take? Get an instant paraphrase of this document with our AI Paraphraser
Hence it can be interpreted that company can get highest benfit in second option by
investing into small scale project. As in this company can recover its invested amount soon.
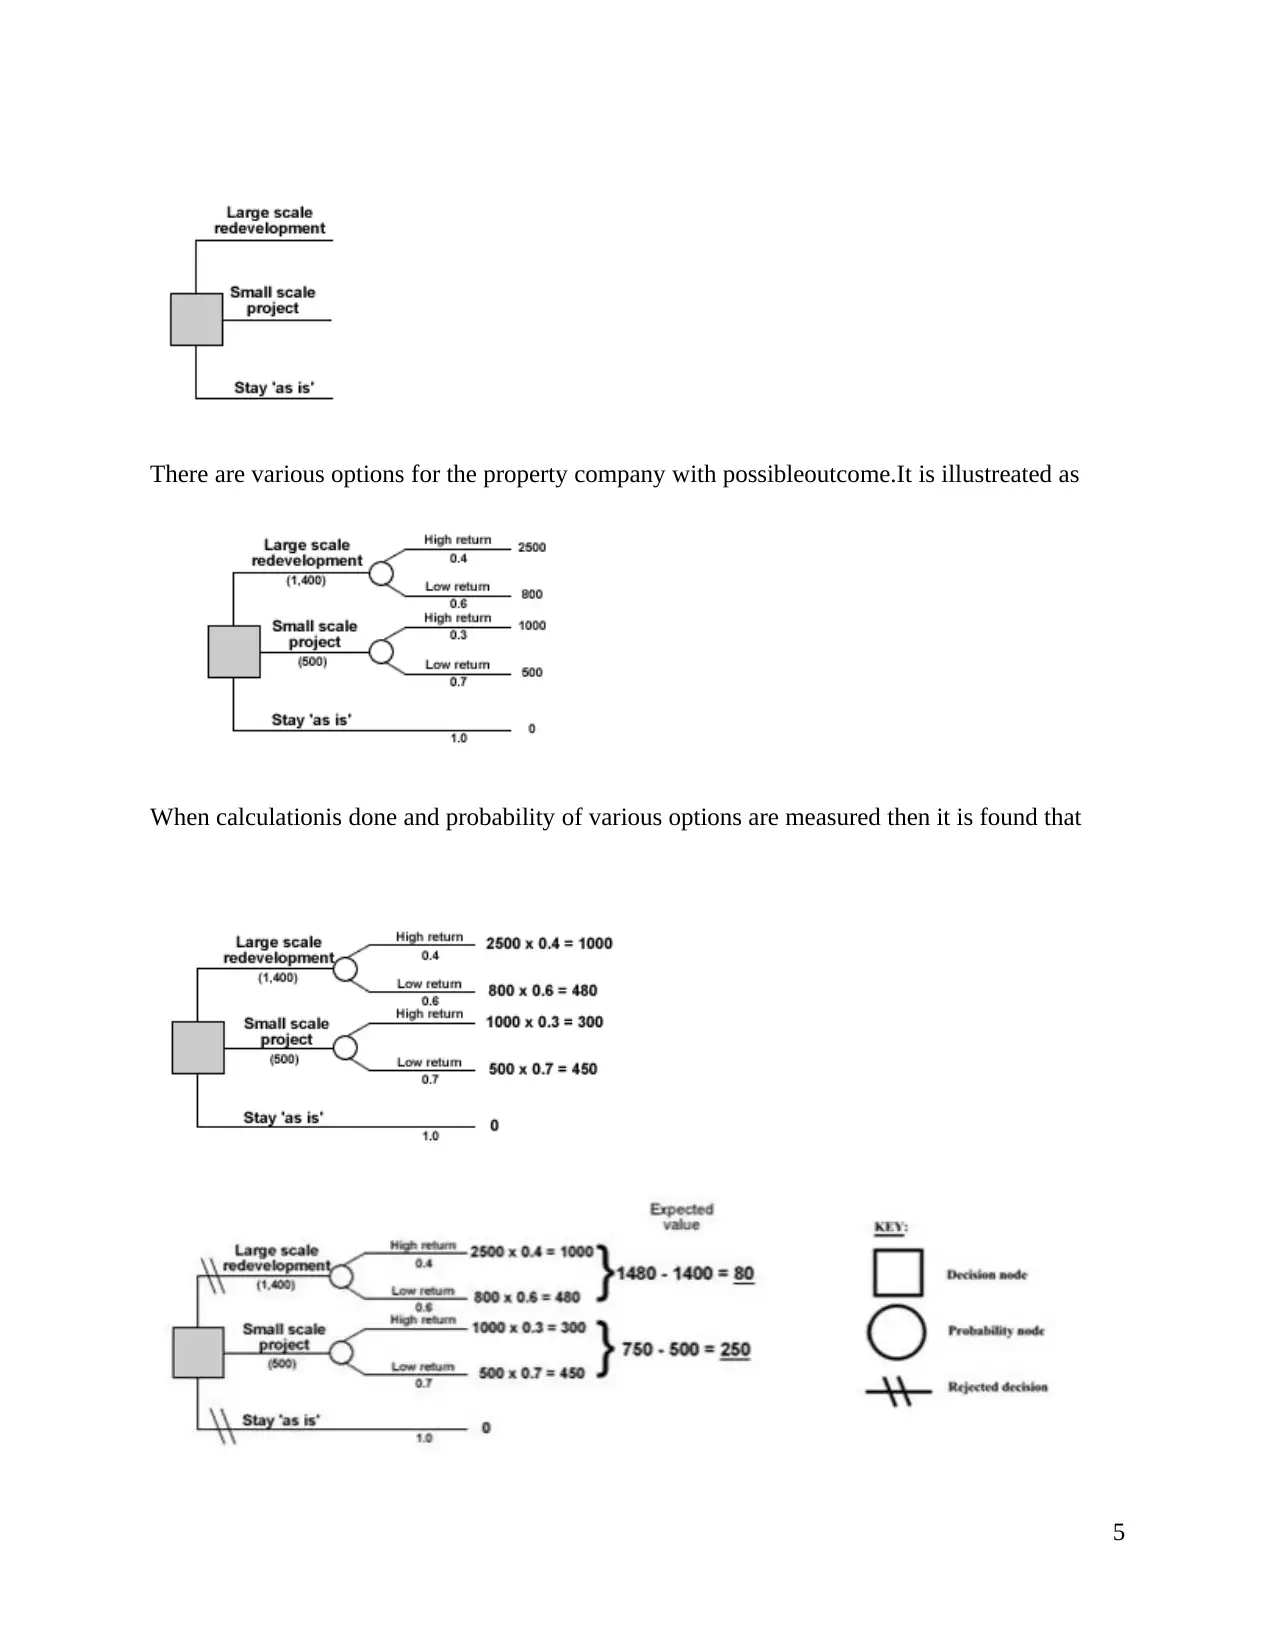
Decsion table
It is the tchnique which is used in companies to test the behaviour of system if differnet
input combinations are there.In this process decision maker capute the combinations of both in
tabular format (Suzuki, 2016). This is alsoknown as cause effect table where cause and effects
relationship is measured in software testing.
Problem
Orgasniton wants to maintain mailing list of consumers. The main reason behind
maintaining this mailing list is to send them detail about products. It is realised that few people re
regular consumers and few are just potential buyers. This is the easiest way to analsyes what
consumers want and sending themdetails accordingly but it is very difficult tomeasure what kind
of products differnet consumers want.Hence decsion table is prepared by using three major
conditons:
C1: order is placed through fall catalog
C2: order is placed Christmas catlog
C3: order is placed through sepecialty catalog
Process
6
investing into small scale project. As in this company can recover its invested amount soon.
Decsion table
It is the tchnique which is used in companies to test the behaviour of system if differnet
input combinations are there.In this process decision maker capute the combinations of both in
tabular format (Suzuki, 2016). This is alsoknown as cause effect table where cause and effects
relationship is measured in software testing.
Problem
Orgasniton wants to maintain mailing list of consumers. The main reason behind
maintaining this mailing list is to send them detail about products. It is realised that few people re
regular consumers and few are just potential buyers. This is the easiest way to analsyes what
consumers want and sending themdetails accordingly but it is very difficult tomeasure what kind
of products differnet consumers want.Hence decsion table is prepared by using three major
conditons:
C1: order is placed through fall catalog
C2: order is placed Christmas catlog
C3: order is placed through sepecialty catalog
Process
6
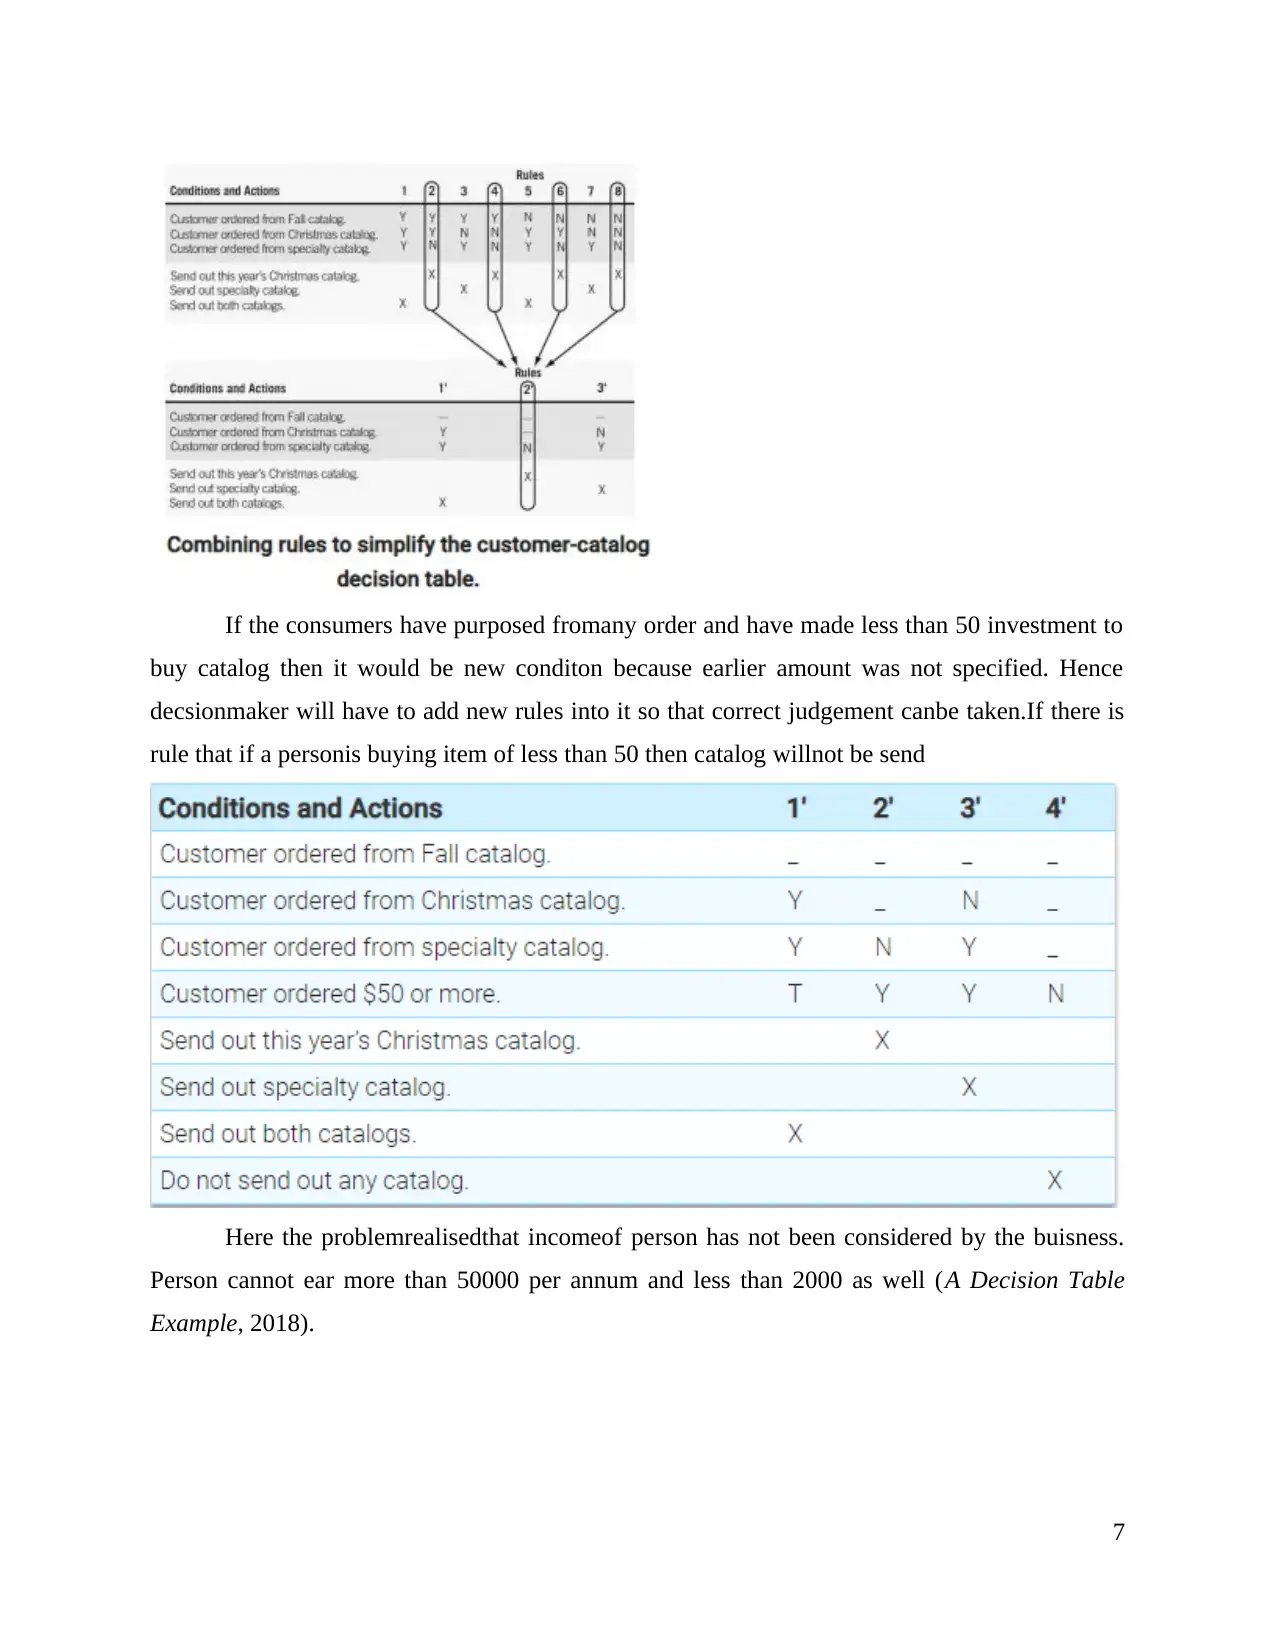
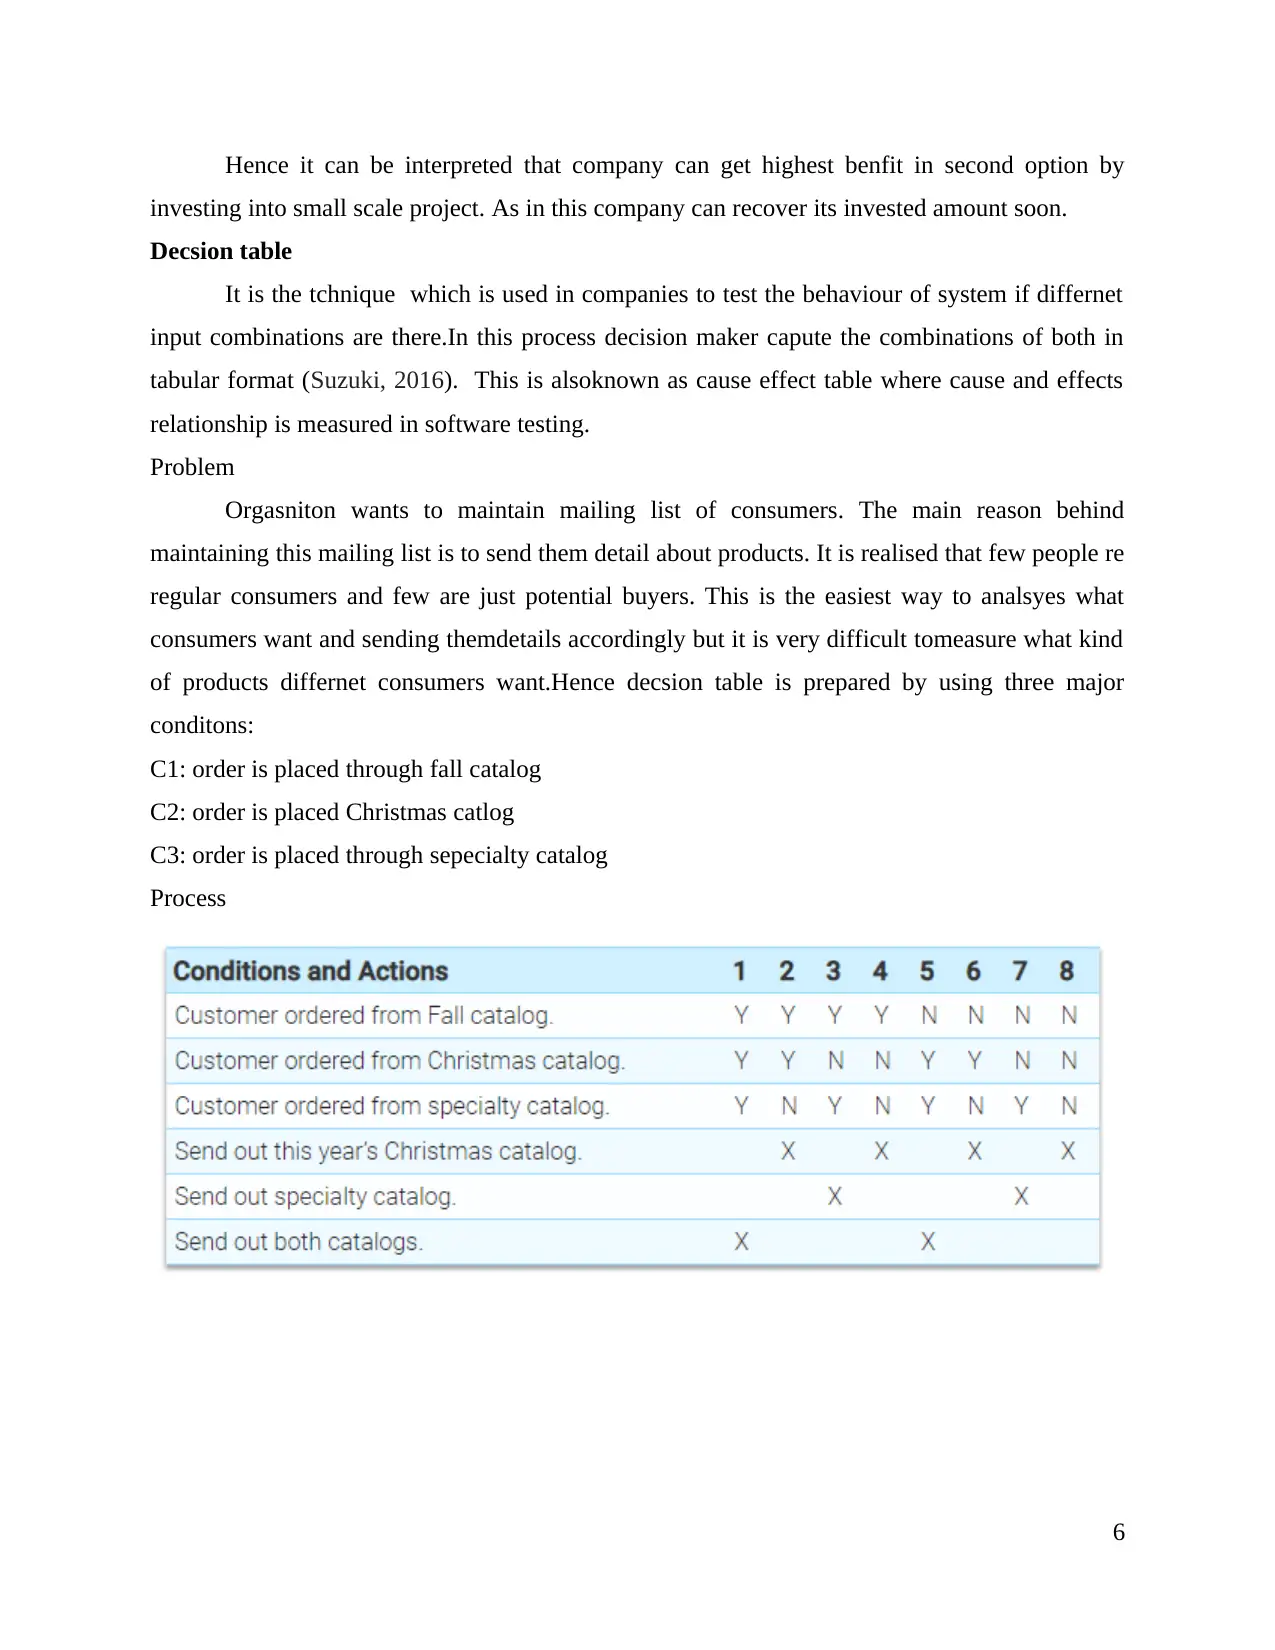
If the consumers have purposed fromany order and have made less than 50 investment to
buy catalog then it would be new conditon because earlier amount was not specified. Hence
decsionmaker will have to add new rules into it so that correct judgement canbe taken.If there is
rule that if a personis buying item of less than 50 then catalog willnot be send
Here the problemrealisedthat incomeof person has not been considered by the buisness.
Person cannot ear more than 50000 per annum and less than 2000 as well (A Decision Table
Example, 2018).
7
⊘ This is a preview!⊘
Do you want full access?
Subscribe today to unlock all pages.
Trusted by 1+ million students worldwide
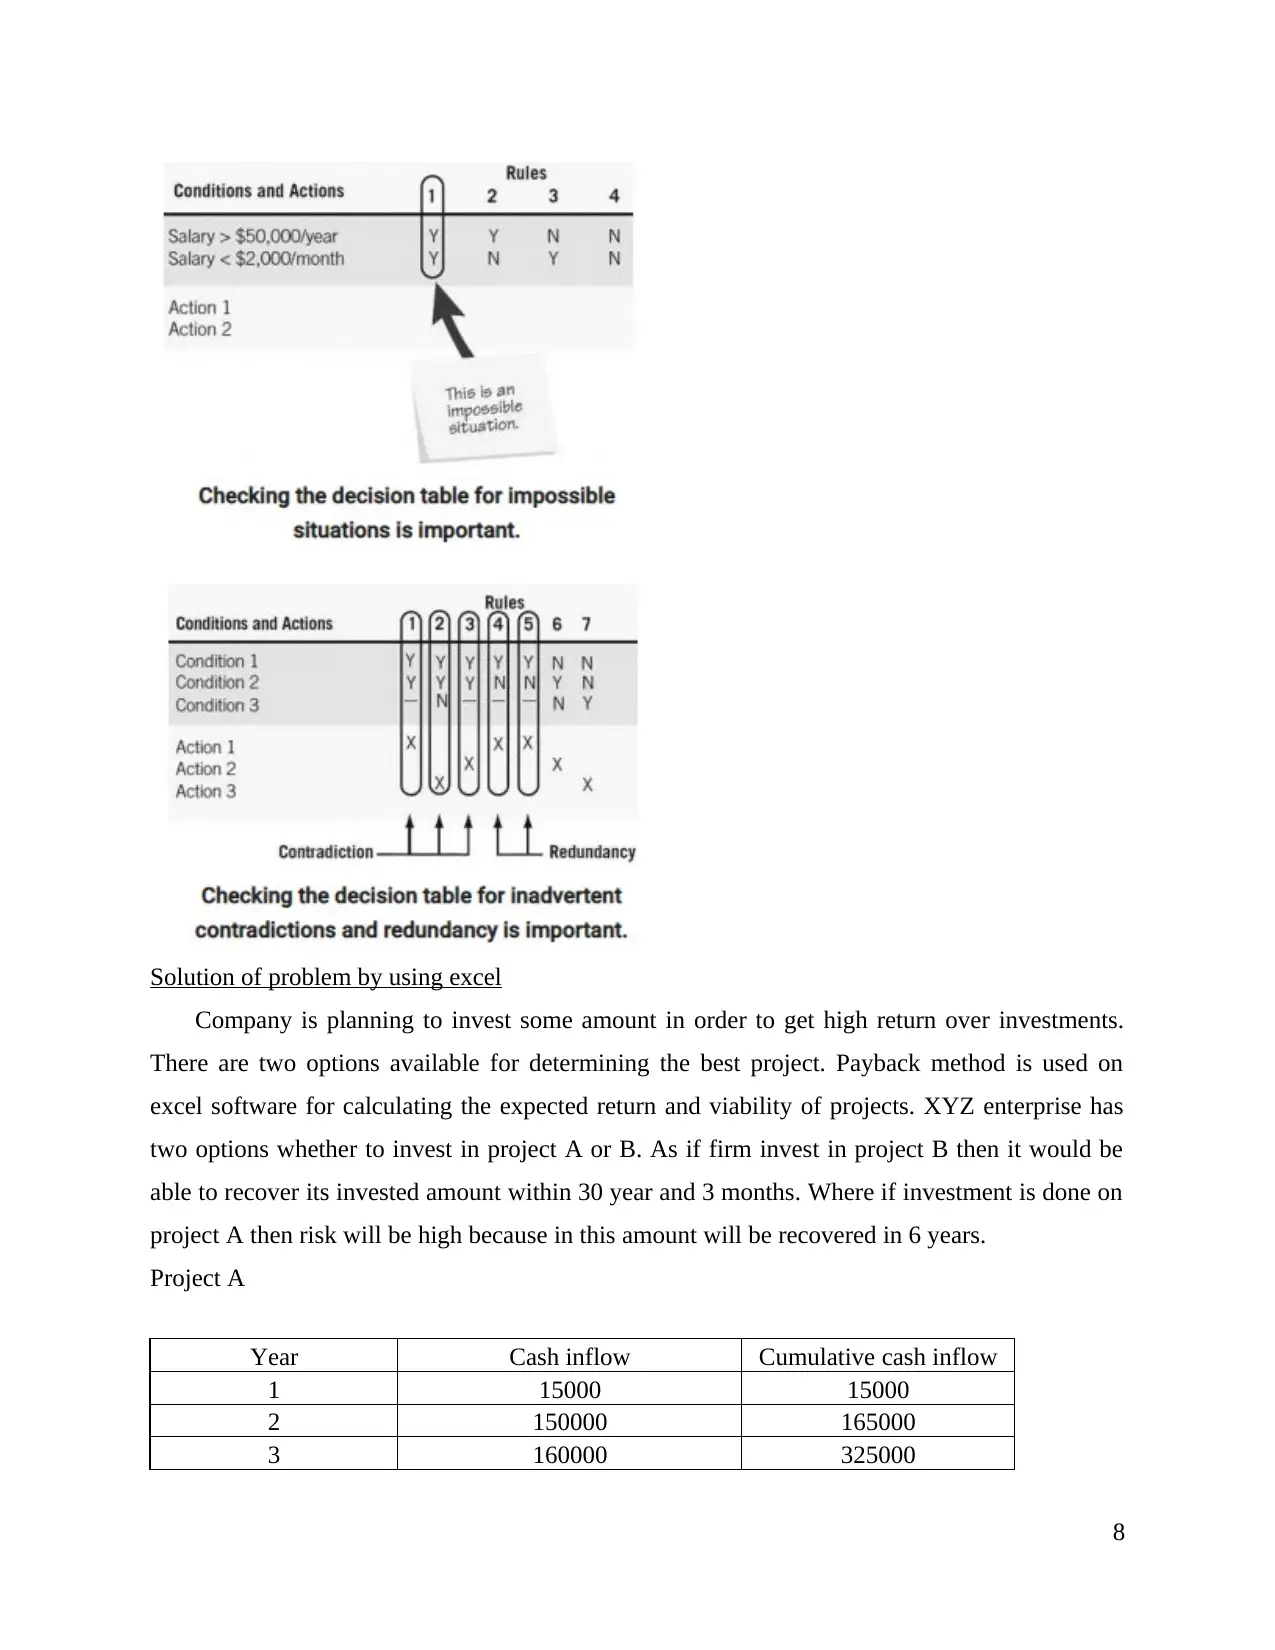
Solution of problem by using excel
Company is planning to invest some amount in order to get high return over investments.
There are two options available for determining the best project. Payback method is used on
excel software for calculating the expected return and viability of projects. XYZ enterprise has
two options whether to invest in project A or B. As if firm invest in project B then it would be
able to recover its invested amount within 30 year and 3 months. Where if investment is done on
project A then risk will be high because in this amount will be recovered in 6 years.
Project A
Year Cash inflow Cumulative cash inflow
1 15000 15000
2 150000 165000
3 160000 325000
8
Paraphrase This Document
Need a fresh take? Get an instant paraphrase of this document with our AI Paraphraser
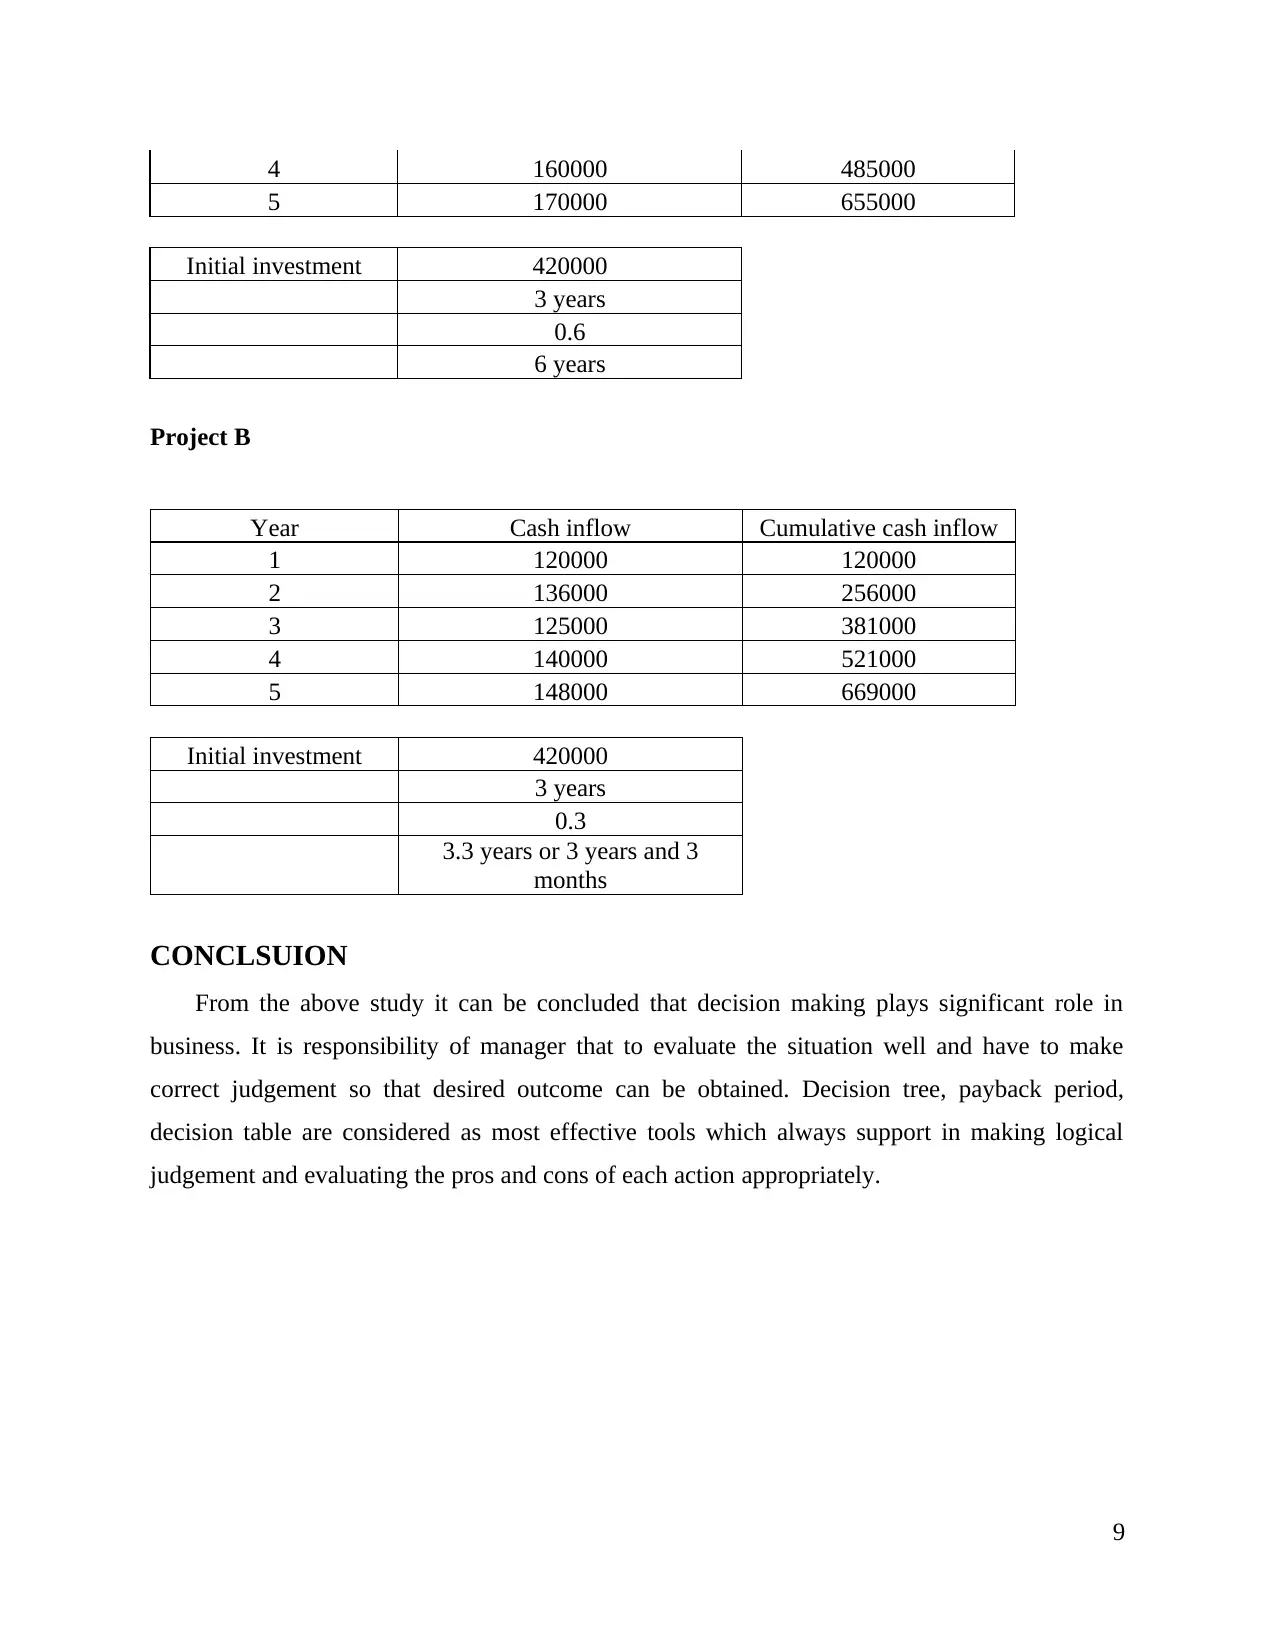
4 160000 485000
5 170000 655000
Initial investment 420000
3 years
0.6
6 years
Project B
Year Cash inflow Cumulative cash inflow
1 120000 120000
2 136000 256000
3 125000 381000
4 140000 521000
5 148000 669000
Initial investment 420000
3 years
0.3
3.3 years or 3 years and 3
months
CONCLSUION
From the above study it can be concluded that decision making plays significant role in
business. It is responsibility of manager that to evaluate the situation well and have to make
correct judgement so that desired outcome can be obtained. Decision tree, payback period,
decision table are considered as most effective tools which always support in making logical
judgement and evaluating the pros and cons of each action appropriately.
9
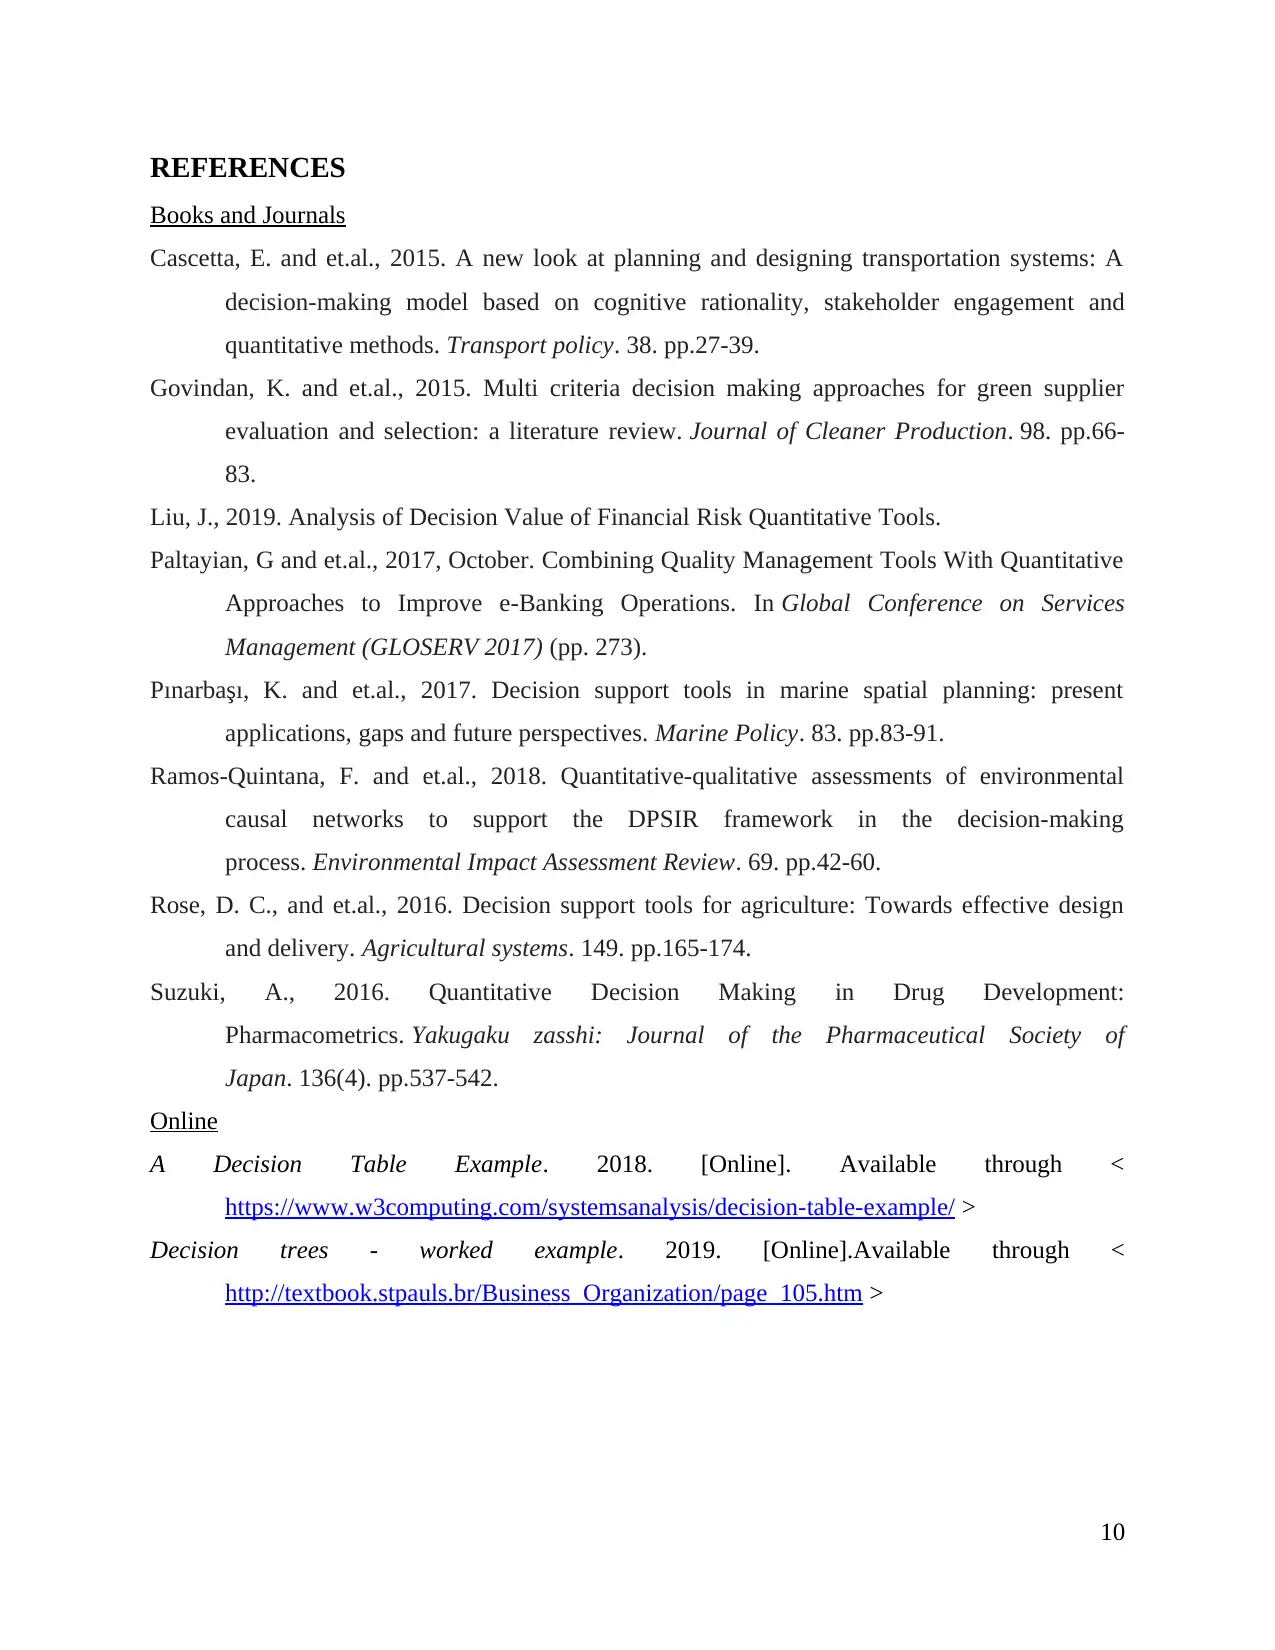
REFERENCES
Books and Journals
Cascetta, E. and et.al., 2015. A new look at planning and designing transportation systems: A
decision-making model based on cognitive rationality, stakeholder engagement and
quantitative methods. Transport policy. 38. pp.27-39.
Govindan, K. and et.al., 2015. Multi criteria decision making approaches for green supplier
evaluation and selection: a literature review. Journal of Cleaner Production. 98. pp.66-
83.
Liu, J., 2019. Analysis of Decision Value of Financial Risk Quantitative Tools.
Paltayian, G and et.al., 2017, October. Combining Quality Management Tools With Quantitative
Approaches to Improve e-Banking Οperations. In Global Conference on Services
Management (GLOSERV 2017) (pp. 273).
Pınarbaşı, K. and et.al., 2017. Decision support tools in marine spatial planning: present
applications, gaps and future perspectives. Marine Policy. 83. pp.83-91.
Ramos-Quintana, F. and et.al., 2018. Quantitative-qualitative assessments of environmental
causal networks to support the DPSIR framework in the decision-making
process. Environmental Impact Assessment Review. 69. pp.42-60.
Rose, D. C., and et.al., 2016. Decision support tools for agriculture: Towards effective design
and delivery. Agricultural systems. 149. pp.165-174.
Suzuki, A., 2016. Quantitative Decision Making in Drug Development:
Pharmacometrics. Yakugaku zasshi: Journal of the Pharmaceutical Society of
Japan. 136(4). pp.537-542.
Online
A Decision Table Example. 2018. [Online]. Available through <
https://www.w3computing.com/systemsanalysis/decision-table-example/ >
Decision trees - worked example. 2019. [Online].Available through <
http://textbook.stpauls.br/Business_Organization/page_105.htm >
10
⊘ This is a preview!⊘
Do you want full access?
Subscribe today to unlock all pages.
Trusted by 1+ million students worldwide
1 out of 13
Related Documents


Your All-in-One AI-Powered Toolkit for Academic Success.
+13062052269
info@desklib.com
Available 24*7 on WhatsApp / Email
![[object Object]](/_next/static/media/star-bottom.7253800d.svg)
Unlock your academic potential
Copyright © 2020–2026 A2Z Services. All Rights Reserved. Developed and managed by ZUCOL.