Quantitative Analysis: Democracy and Economic Growth (SOCIOLOGY)
VerifiedAdded on 2022/11/29
|30
|4179
|371
Report
AI Summary
This report investigates the relationship between democracy and economic growth, exploring the question of whether higher economic development leads to more democracy. The study utilizes the QoG standard dataset, employing linear regression analysis and other statistical methods to examine the influence of democracy on economic strength. The author considers various control variables, including education, social cohesion, ethnic fractionalization, and trade openness, to determine their impact on economic growth. The report discusses the limitations of the data, such as the potential for discrepancies in GDP statistics and the challenges in measuring democracy accurately. The analysis includes descriptive statistics, bivariate correlation analysis, and hypothesis testing to determine the impact of the independent variables on the dependent variable of economic output. The findings indicate a positive correlation between economic output and democracy, social cohesion, education, and trade openness, while ethnic fractionalization shows a negative correlation. The report concludes with a summary of the findings, emphasizing the statistically significant relationships between the variables.
Democracy and Economic Growth 1
DOES HIGHER ECONOMY DEVELOPMENT LEAD TO MORE DEMOCRACY?
By (Name)
The Name of the Class (Course)
Professor (Tutor)
The Name of the School (University)
The City and State where it is located
The Date
DOES HIGHER ECONOMY DEVELOPMENT LEAD TO MORE DEMOCRACY?
By (Name)
The Name of the Class (Course)
Professor (Tutor)
The Name of the School (University)
The City and State where it is located
The Date
Paraphrase This Document
Need a fresh take? Get an instant paraphrase of this document with our AI Paraphraser
Democracy and Economic Growth 2
Does higher economy development lead to more democracy?
The motivation of the study
The aim of the research is to explain the determinant of economic strength of countries.
Democracy has always been associated with economic growth whereby the former is
considered as the predicting or independent variable. However, there are other arguments
which tell different narration than this. It also argued that democracy paralyzes the growth of
economy since democracy is characterized with taxation, accountability and transparency
which in turn lead to stagnation of development. With such in mind, this research will try to
examine what kind of effect does democracy has on economic growth. However, since there
are other factors or variables which are also thought to have an effect on democracy, this
study will consider some other variables as control variables. Such variable include
education, social cohesion, ethnic fractionalization, trade openness. The research will study,
the bivariate correlation between the variables and therefore examine the influence of
democracy on economic strength of a countries in data with the help of linear regression
analysis and other statistical methods.
Data used QoG
The QoG standard data is one of the largest dataset. It contains over 100 data sources with
more than 2000 variables. The QoG is updated constantly and I have used my study the last
version of 2019. It contains both cross-sectional data and time series meaning that QoG
dataset contain information of countries since 1946 which is very good if a researcher is
interested in countries as unit of the analysis. However, one should be more careful if this
dataset is considered to be useful because there may some countries in dataset which do not
exist now as well as other countries which had existed before but now because of the either
Democracy and Economic Growth 3
reunification or secession of some countries. The dataset is constantly updated and therefore
can be considered as authentic and useable for research purposes.
Limitation
The GDP statistics will not provide the transparency of the real production of the studied
country. Each variable a country distributes income differently and this can affect the
reliability or validity of the GDP statistics. Other limitation with the measurement of
economic growth of government is the idea that egalitarian states spend much money on
social services and health other social amenities where other liberal states do not spend such
huge money in such services. Such discrepancies may cause some misleading information of
countries’ economic development. Other problems with using GDP per capita as a parameter
to measure the economic performance is the fact that many countries carry out money
laundering which makes even harder to know how much assets has a given country has.
Other limitation with the measurement democracy in dataset is the value of the democracy is
based on index from 0 till 10 whereby 0 corresponds to absence of democracy while 10 is
highest value of democracy. There could be many other factors that can affect the level of
democracy of a country which had not been included in the operationalization process.
However, I will come to this point later in assignment.
Theory
When we talk about the correlation between democracy and economic growth, we are
referring to change overtime; therefore, it suitable to use historical institution as the
theoretical framework for this study. Thus, both cross national and time series data could be
used in order to analyze the relationship between democracy and economic performance of
countries. Historical institutions is theory that can be caused when one is interested in the
causality or causal mechanism which can play a role in the reach of social studies
⊘ This is a preview!⊘
Do you want full access?
Subscribe today to unlock all pages.
Trusted by 1+ million students worldwide
Democracy and Economic Growth 4
Defining the variables
There is different level of measures which are used in statistics when we try to study different
values. Depending the values or scales in which variables can attain we use different level of
measurements such ordinal, nominal, interval and ratio. Similarly, it is used other terms such
dichotomous, discrete and continuous variables. In my case, the variables are in scale level
which means that the difference of the values of the variables can be arranged in an orderly
and continuous manner. If a variable has a nominal scale value it means that variable cannot
be arranged orderly rather it can be classified as into different categories. If variable is ordinal
is the opposite to nominal since it be arranged into different grades to with an orderly
manner whereby 1 is less value than 2 or 9 has higher value than 2. Furthermore, interval
variables can be arranged in orderly manner whereby the difference between has meaning.
The Dependent variable
Economic development (bti_ep)
Taking the GDP per capita as variable is deemed more suitable than other variables which
measure the same in the data used. Economic strength or economic development show same
correlation towards democracy and other independent variables. With that reason I have used
the variable economic output strength.
To operationalize economic development it used also the QoG dataset 2013 whereby the
GDP per capita is chosen. The reason is that the GDP per capita is of the most instrument
used to measure the economic development or performance. For the sake of accuracy, this
paper uses the Geary-Khamis dollar or as it is called the international dollar. The Geary-
Khamis is a hypothetical unit (GK$) which has the purchasing power as US dollar. (QoG:
2013). The GK$ is a recognized currency which used in studies and other economic contexts.
The Independent variables
Paraphrase This Document
Need a fresh take? Get an instant paraphrase of this document with our AI Paraphraser
Democracy and Economic Growth 5
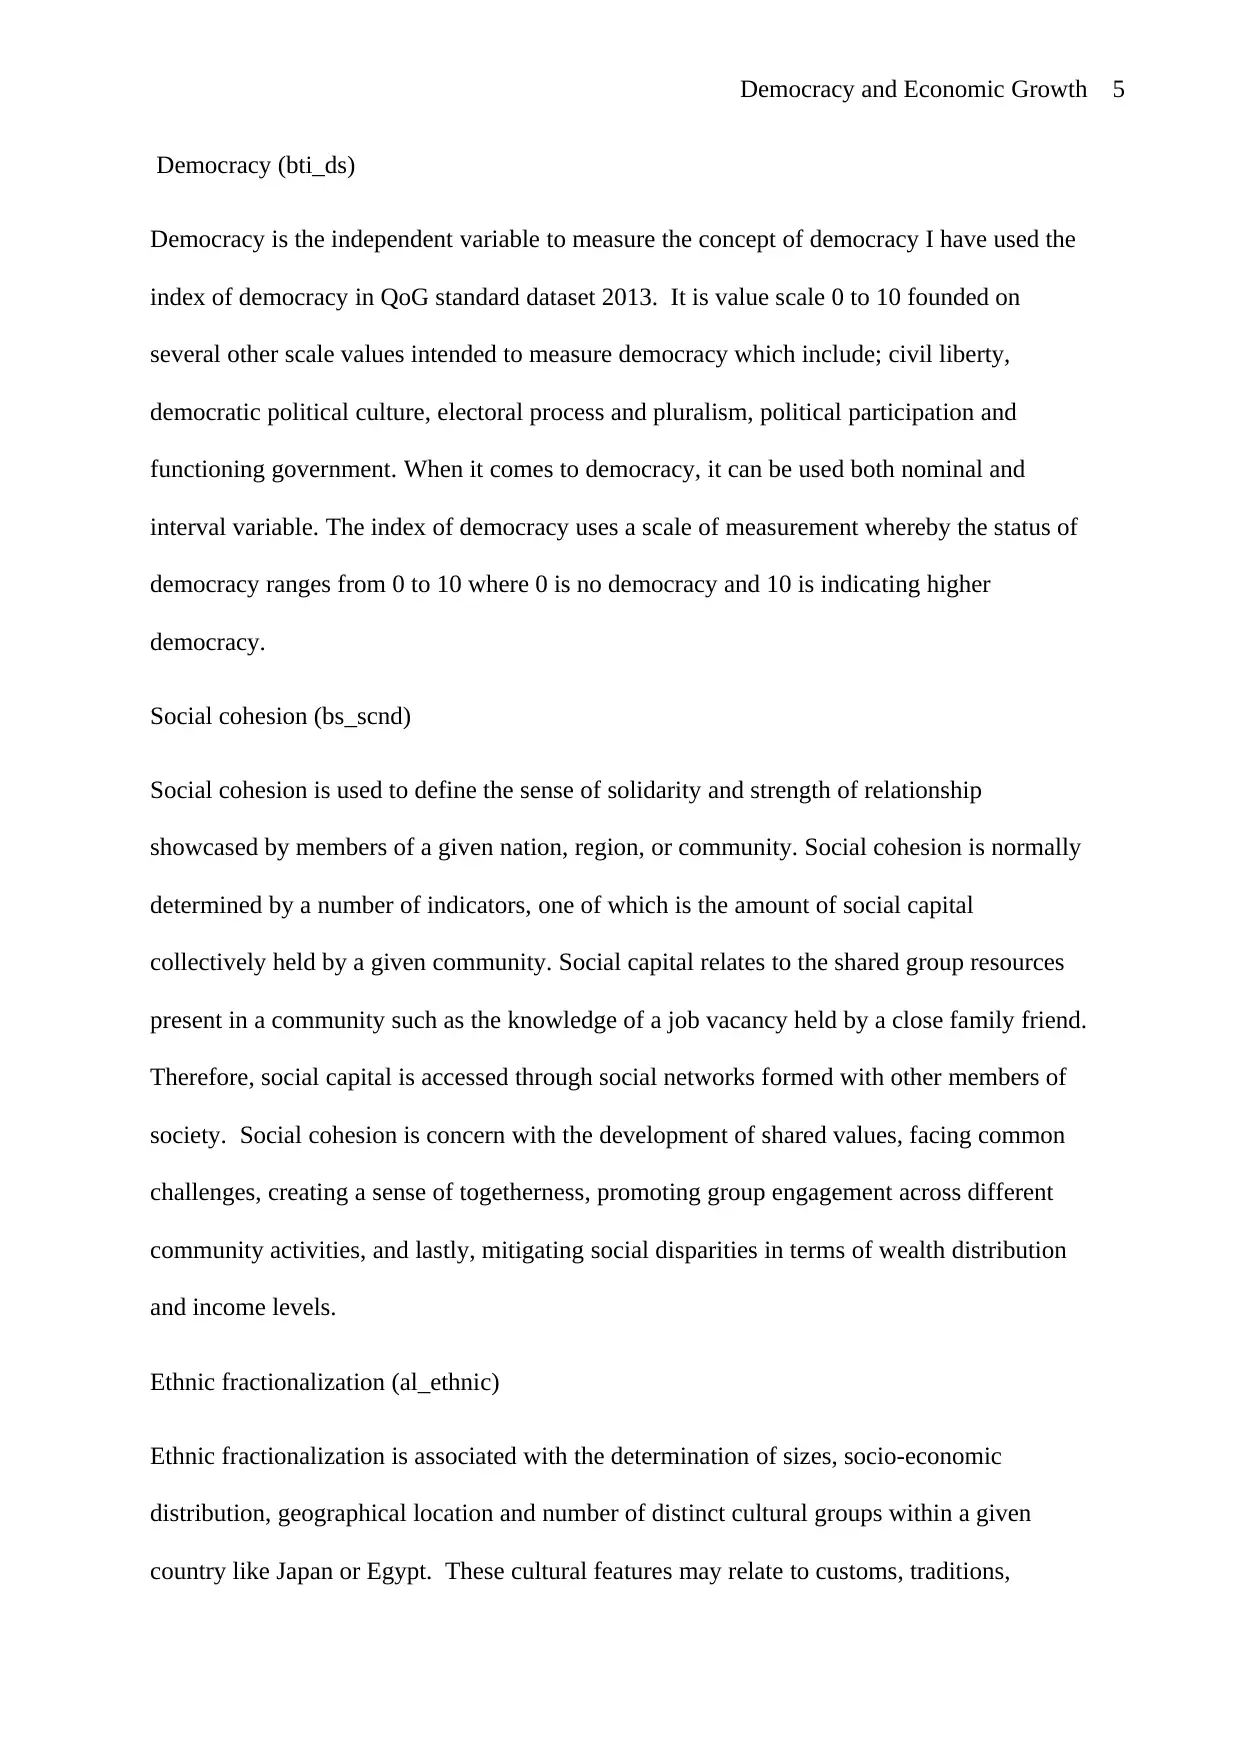
Democracy (bti_ds)
Democracy is the independent variable to measure the concept of democracy I have used the
index of democracy in QoG standard dataset 2013. It is value scale 0 to 10 founded on
several other scale values intended to measure democracy which include; civil liberty,
democratic political culture, electoral process and pluralism, political participation and
functioning government. When it comes to democracy, it can be used both nominal and
interval variable. The index of democracy uses a scale of measurement whereby the status of
democracy ranges from 0 to 10 where 0 is no democracy and 10 is indicating higher
democracy.
Social cohesion (bs_scnd)
Social cohesion is used to define the sense of solidarity and strength of relationship
showcased by members of a given nation, region, or community. Social cohesion is normally
determined by a number of indicators, one of which is the amount of social capital
collectively held by a given community. Social capital relates to the shared group resources
present in a community such as the knowledge of a job vacancy held by a close family friend.
Therefore, social capital is accessed through social networks formed with other members of
society. Social cohesion is concern with the development of shared values, facing common
challenges, creating a sense of togetherness, promoting group engagement across different
community activities, and lastly, mitigating social disparities in terms of wealth distribution
and income levels.
Ethnic fractionalization (al_ethnic)
Ethnic fractionalization is associated with the determination of sizes, socio-economic
distribution, geographical location and number of distinct cultural groups within a given
country like Japan or Egypt. These cultural features may relate to customs, traditions,
Democracy and Economic Growth 6
ethnicity, religion, language, and language. In most cases these features are used in the
monopolization of power, and social exclusion.
Trade openness (ipi_tradeopen)
Trade openness is used to define the inward or outward orientation of a particular economy.
Outward orientation is used to refer to economies that seize trading opportunities with other
countries; while, inward orientation defines countries avoid or fail to take advantage of
trading opportunities with other countries/economies. Good examples of trade policies that
are directly linked to the establishment of either outward or inward orientation are scale
economies, market competitiveness, technologies, infrastructure, import-export regulations,
and trade barriers.
Education (iiag_edu)
We are not just dealing with the convectional interpretation of education which is the
acquisition of knowledge and skills through a series of teaching, self-learning, or
apprenticeship. We are also dealing with the assessment of quality education which focuses
on the proper cognitive development of learners as they progress through the education
system.
H1. Economic growth takes place in democratic countries
H2. The GDP per capita is higher in democratic countries
H3. Social cohesion is important for economic growth
H4. Education is import for economic growth
H5. Higher ethnic fractionalization affects economy negatively
H6: Trade openness leads to economic growth
⊘ This is a preview!⊘
Do you want full access?
Subscribe today to unlock all pages.
Trusted by 1+ million students worldwide
Democracy and Economic Growth 7
Descriptive statistics Democracy and Economic Output Strength
When conducting a descriptive statistic to see frequency table about economic output and
democracy, it shows a mean of 5.6 whereby the standard deviation is 2.806 which is relative
good since it is not larger than the mean. The mean score of 5.6 indicate that majority of the
countries in the study have a good level of democracy. The standard deviation indicates that
the democracy status for majority of the countries is
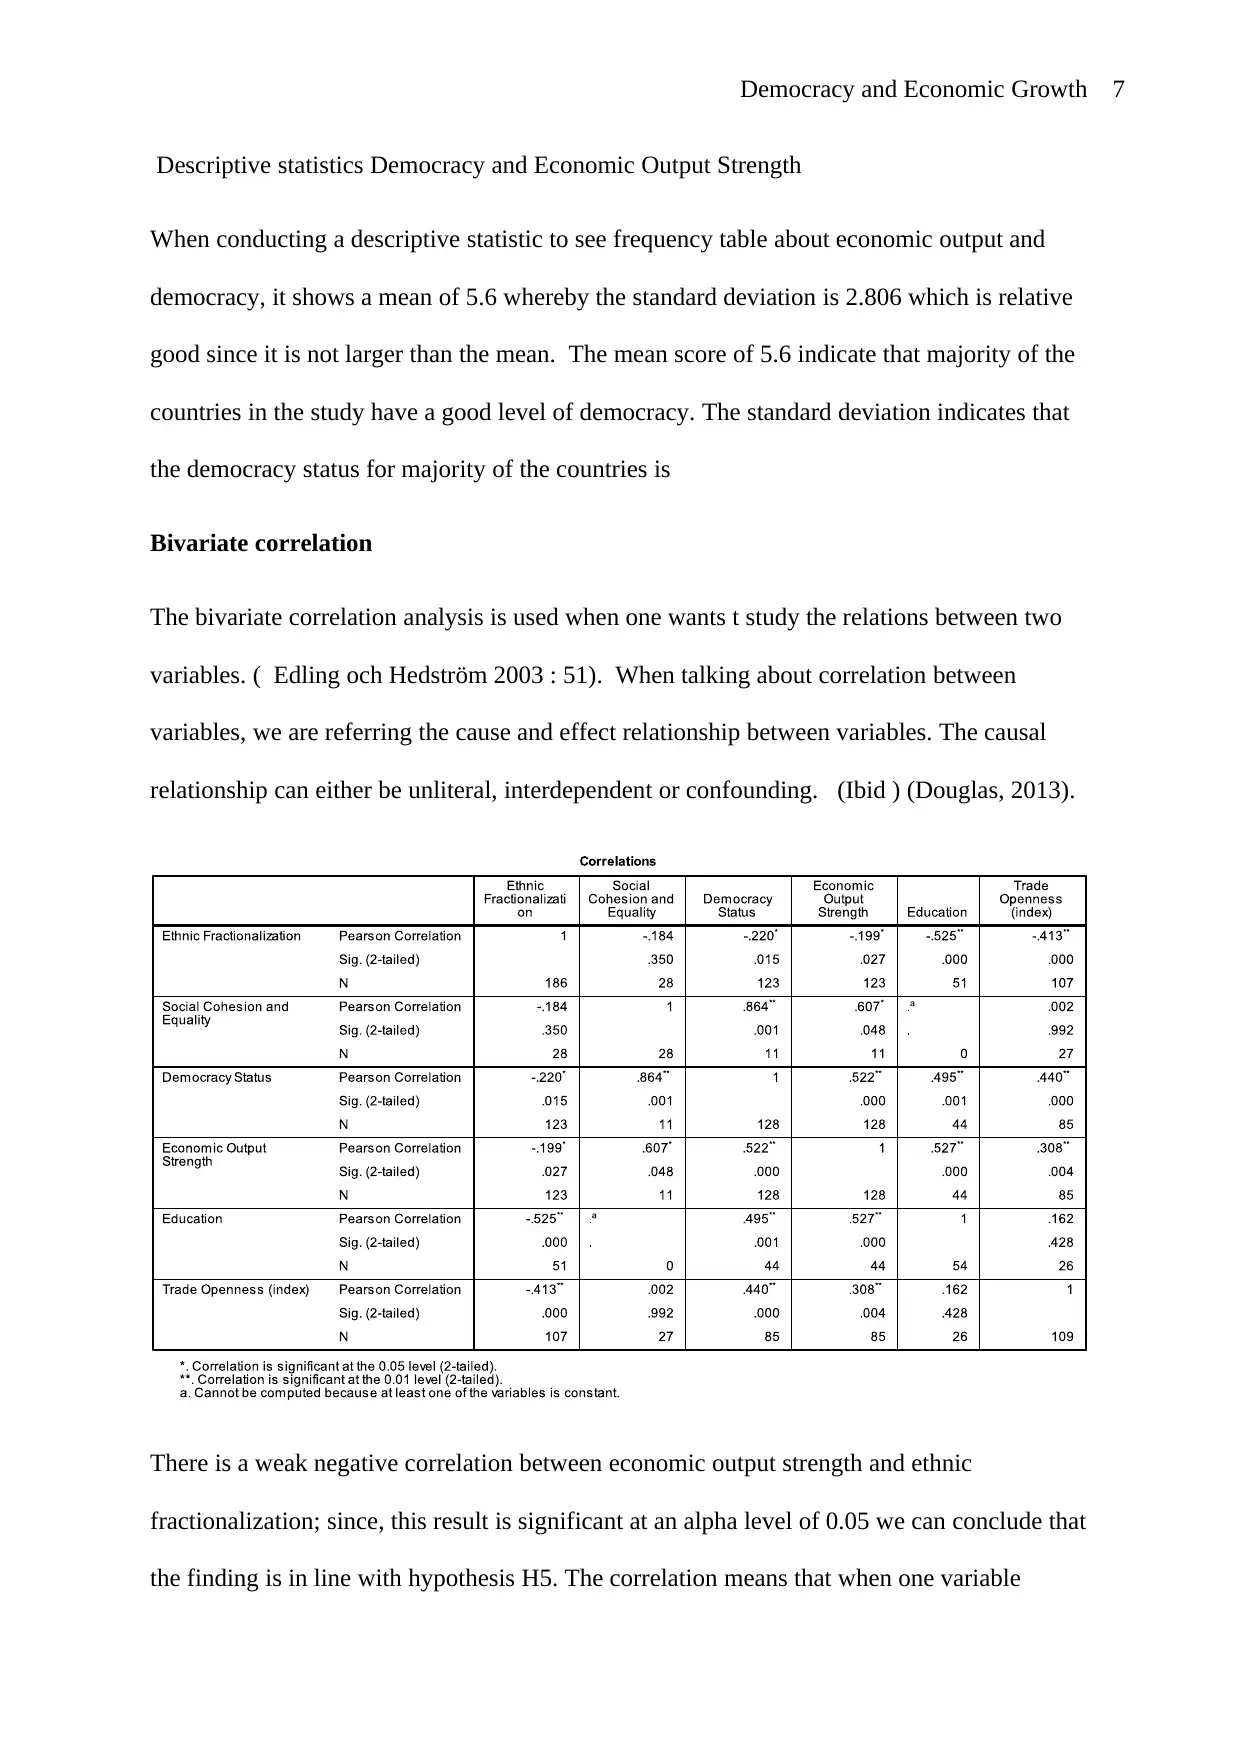
Bivariate correlation
The bivariate correlation analysis is used when one wants t study the relations between two
variables. ( Edling och Hedström 2003 : 51). When talking about correlation between
variables, we are referring the cause and effect relationship between variables. The causal
relationship can either be unliteral, interdependent or confounding. (Ibid ) (Douglas, 2013).
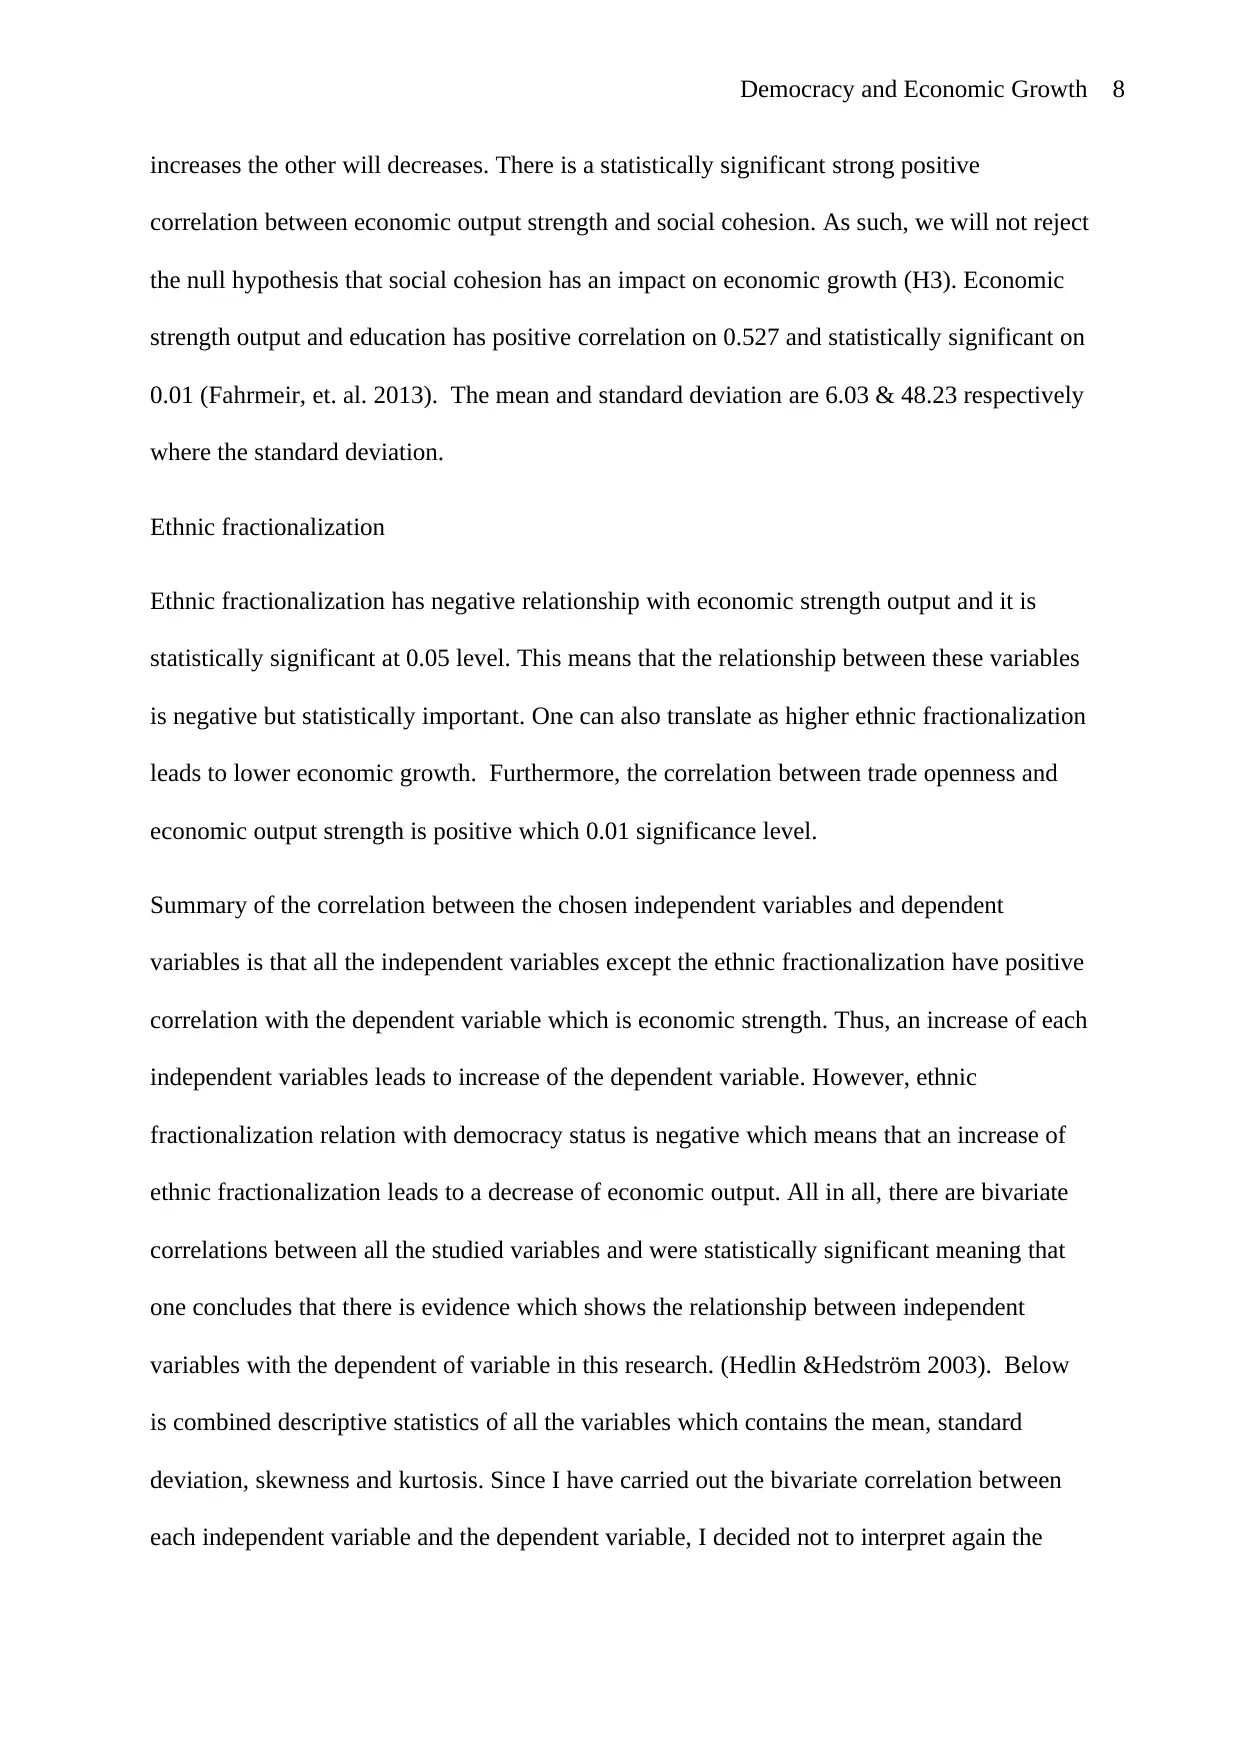
There is a weak negative correlation between economic output strength and ethnic
fractionalization; since, this result is significant at an alpha level of 0.05 we can conclude that
the finding is in line with hypothesis H5. The correlation means that when one variable
Descriptive statistics Democracy and Economic Output Strength
When conducting a descriptive statistic to see frequency table about economic output and
democracy, it shows a mean of 5.6 whereby the standard deviation is 2.806 which is relative
good since it is not larger than the mean. The mean score of 5.6 indicate that majority of the
countries in the study have a good level of democracy. The standard deviation indicates that
the democracy status for majority of the countries is
Bivariate correlation
The bivariate correlation analysis is used when one wants t study the relations between two
variables. ( Edling och Hedström 2003 : 51). When talking about correlation between
variables, we are referring the cause and effect relationship between variables. The causal
relationship can either be unliteral, interdependent or confounding. (Ibid ) (Douglas, 2013).
There is a weak negative correlation between economic output strength and ethnic
fractionalization; since, this result is significant at an alpha level of 0.05 we can conclude that
the finding is in line with hypothesis H5. The correlation means that when one variable
Paraphrase This Document
Need a fresh take? Get an instant paraphrase of this document with our AI Paraphraser
Democracy and Economic Growth 8
increases the other will decreases. There is a statistically significant strong positive
correlation between economic output strength and social cohesion. As such, we will not reject
the null hypothesis that social cohesion has an impact on economic growth (H3). Economic
strength output and education has positive correlation on 0.527 and statistically significant on
0.01 (Fahrmeir, et. al. 2013). The mean and standard deviation are 6.03 & 48.23 respectively
where the standard deviation.
Ethnic fractionalization
Ethnic fractionalization has negative relationship with economic strength output and it is
statistically significant at 0.05 level. This means that the relationship between these variables
is negative but statistically important. One can also translate as higher ethnic fractionalization
leads to lower economic growth. Furthermore, the correlation between trade openness and
economic output strength is positive which 0.01 significance level.
Summary of the correlation between the chosen independent variables and dependent
variables is that all the independent variables except the ethnic fractionalization have positive
correlation with the dependent variable which is economic strength. Thus, an increase of each
independent variables leads to increase of the dependent variable. However, ethnic
fractionalization relation with democracy status is negative which means that an increase of
ethnic fractionalization leads to a decrease of economic output. All in all, there are bivariate
correlations between all the studied variables and were statistically significant meaning that
one concludes that there is evidence which shows the relationship between independent
variables with the dependent of variable in this research. (Hedlin &Hedström 2003). Below
is combined descriptive statistics of all the variables which contains the mean, standard
deviation, skewness and kurtosis. Since I have carried out the bivariate correlation between
each independent variable and the dependent variable, I decided not to interpret again the
Democracy and Economic Growth 9
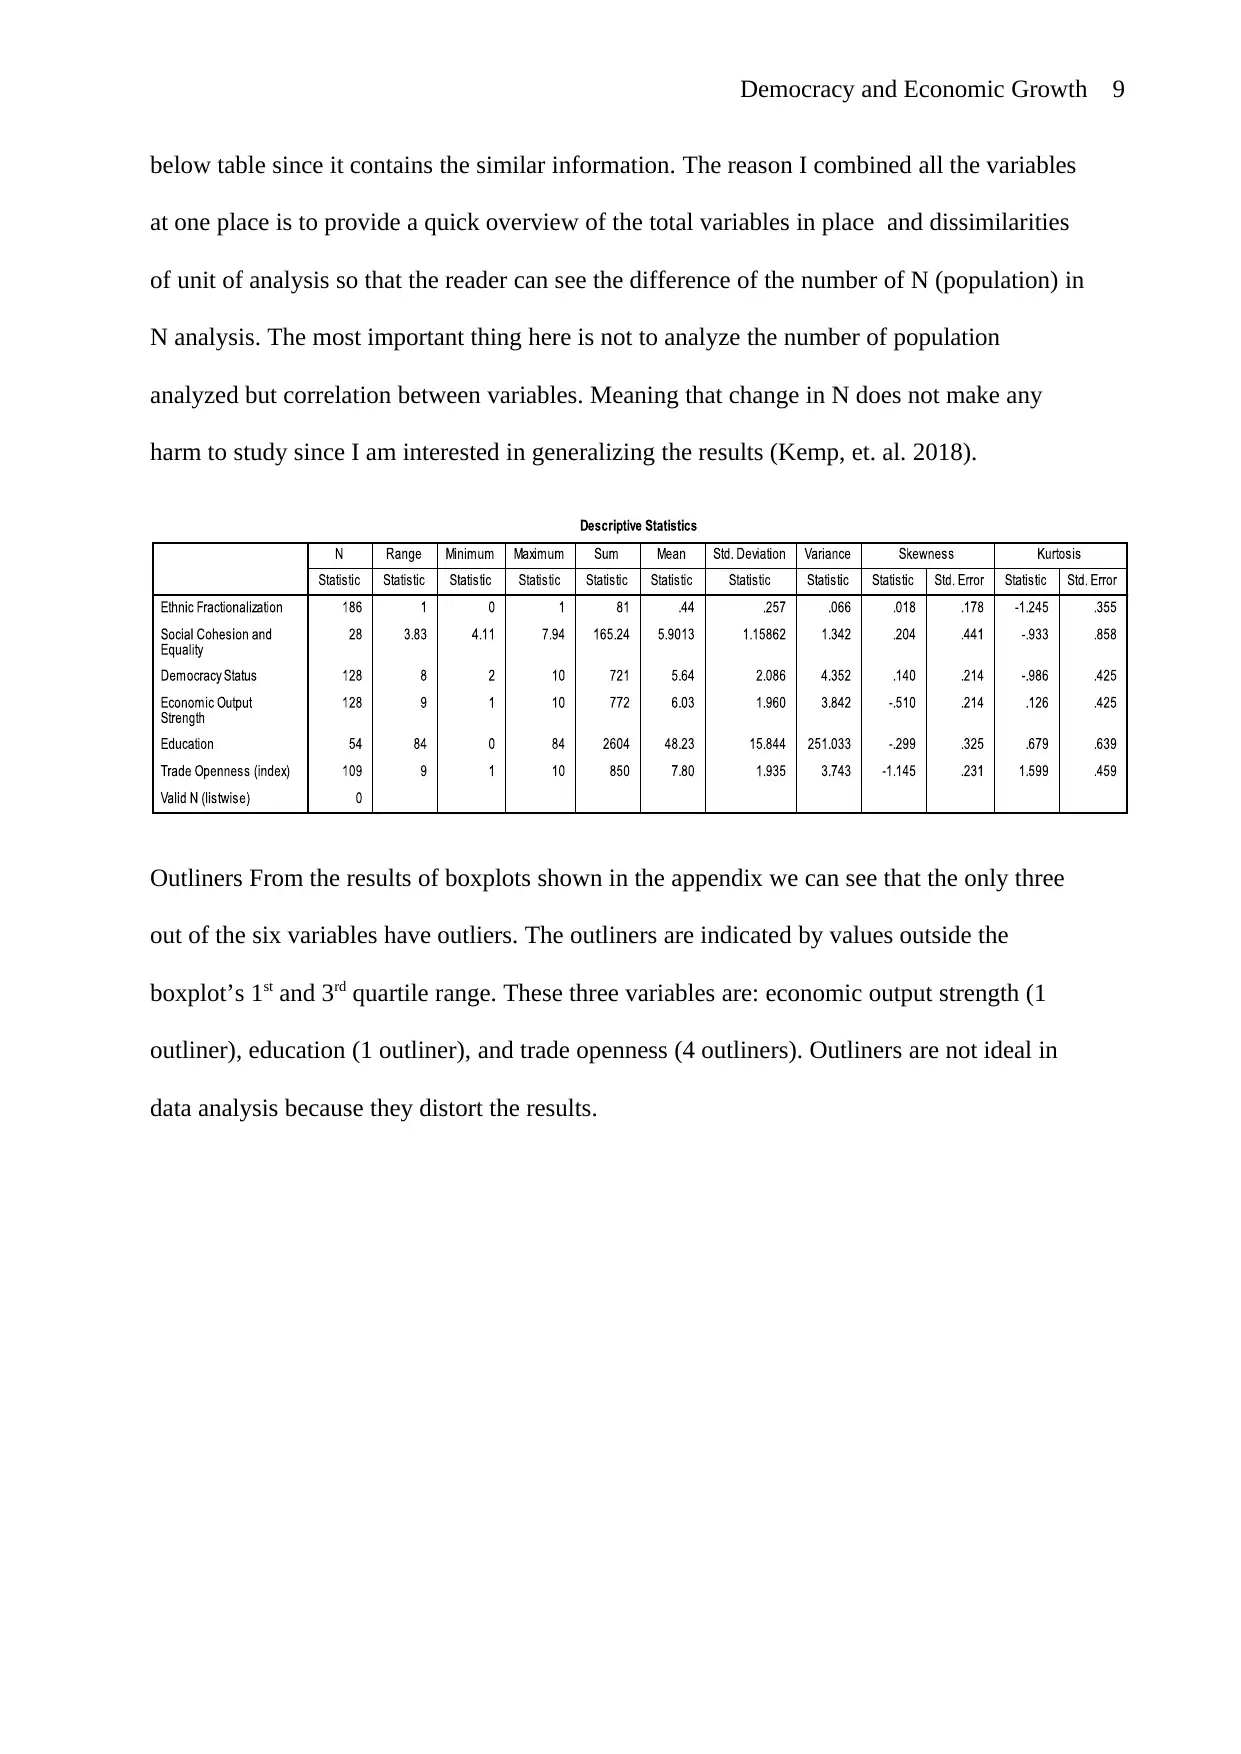
below table since it contains the similar information. The reason I combined all the variables
at one place is to provide a quick overview of the total variables in place and dissimilarities
of unit of analysis so that the reader can see the difference of the number of N (population) in
N analysis. The most important thing here is not to analyze the number of population
analyzed but correlation between variables. Meaning that change in N does not make any
harm to study since I am interested in generalizing the results (Kemp, et. al. 2018).
Outliners From the results of boxplots shown in the appendix we can see that the only three
out of the six variables have outliers. The outliners are indicated by values outside the
boxplot’s 1st and 3rd quartile range. These three variables are: economic output strength (1
outliner), education (1 outliner), and trade openness (4 outliners). Outliners are not ideal in
data analysis because they distort the results.
⊘ This is a preview!⊘
Do you want full access?
Subscribe today to unlock all pages.
Trusted by 1+ million students worldwide
Democracy and Economic Growth 10
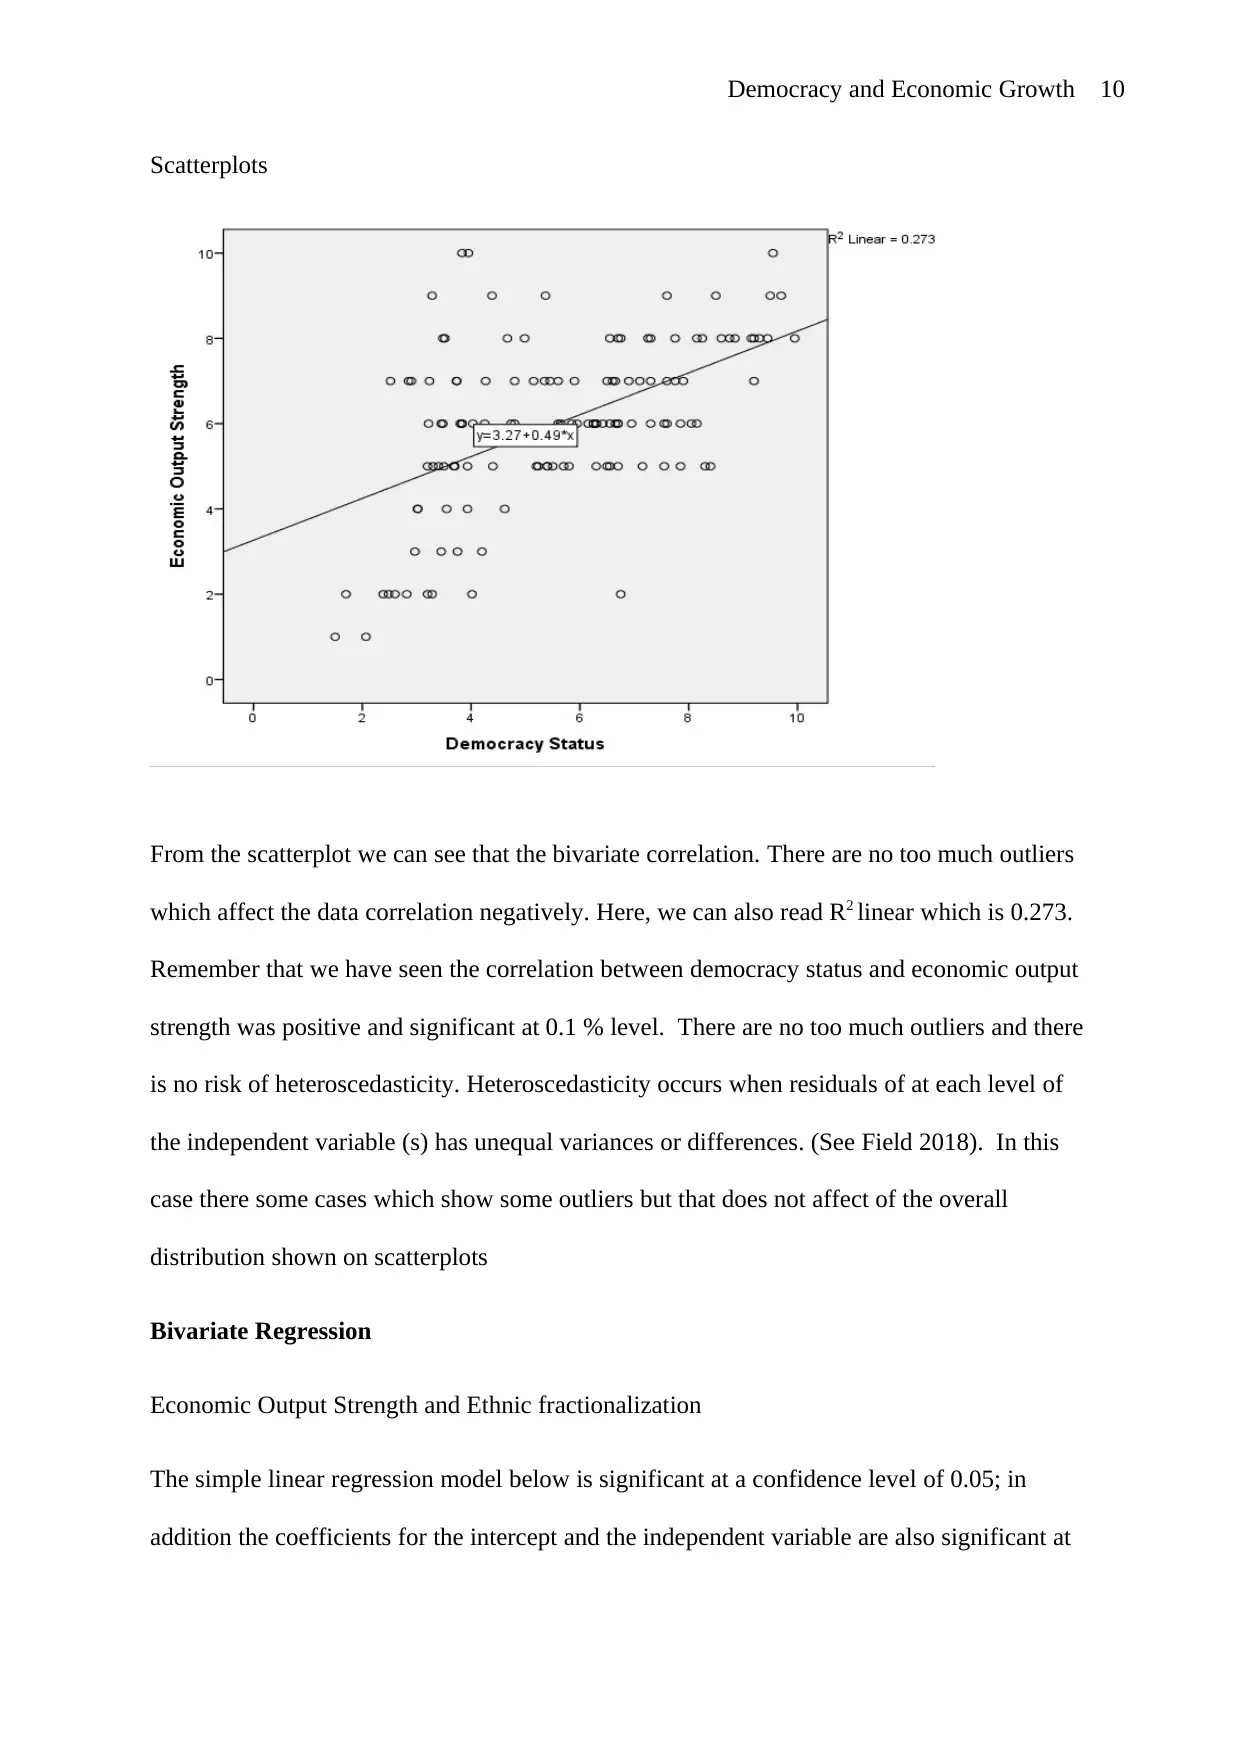
Scatterplots
From the scatterplot we can see that the bivariate correlation. There are no too much outliers
which affect the data correlation negatively. Here, we can also read R2 linear which is 0.273.
Remember that we have seen the correlation between democracy status and economic output
strength was positive and significant at 0.1 % level. There are no too much outliers and there
is no risk of heteroscedasticity. Heteroscedasticity occurs when residuals of at each level of
the independent variable (s) has unequal variances or differences. (See Field 2018). In this
case there some cases which show some outliers but that does not affect of the overall
distribution shown on scatterplots
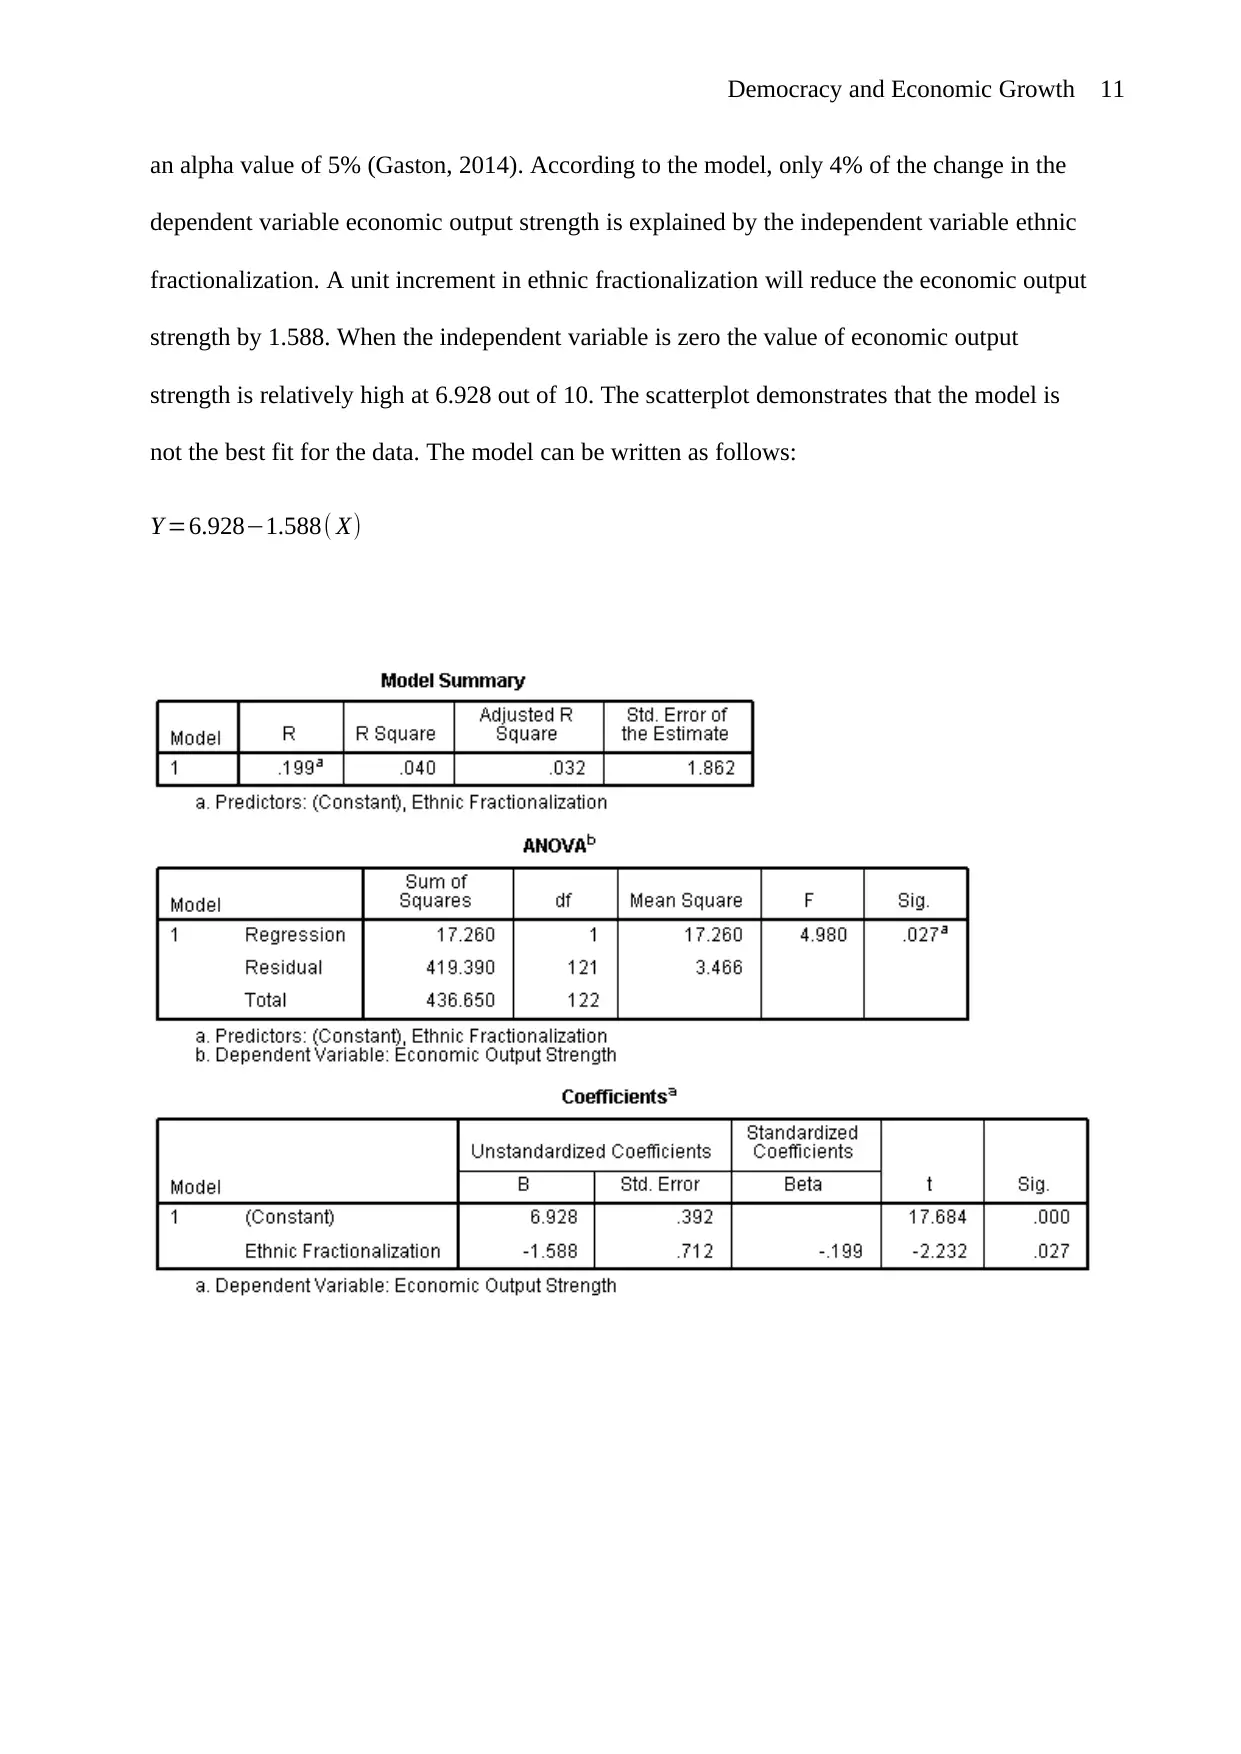
Bivariate Regression
Economic Output Strength and Ethnic fractionalization
The simple linear regression model below is significant at a confidence level of 0.05; in
addition the coefficients for the intercept and the independent variable are also significant at
Scatterplots
From the scatterplot we can see that the bivariate correlation. There are no too much outliers
which affect the data correlation negatively. Here, we can also read R2 linear which is 0.273.
Remember that we have seen the correlation between democracy status and economic output
strength was positive and significant at 0.1 % level. There are no too much outliers and there
is no risk of heteroscedasticity. Heteroscedasticity occurs when residuals of at each level of
the independent variable (s) has unequal variances or differences. (See Field 2018). In this
case there some cases which show some outliers but that does not affect of the overall
distribution shown on scatterplots
Bivariate Regression
Economic Output Strength and Ethnic fractionalization
The simple linear regression model below is significant at a confidence level of 0.05; in
addition the coefficients for the intercept and the independent variable are also significant at
Paraphrase This Document
Need a fresh take? Get an instant paraphrase of this document with our AI Paraphraser
Democracy and Economic Growth 11
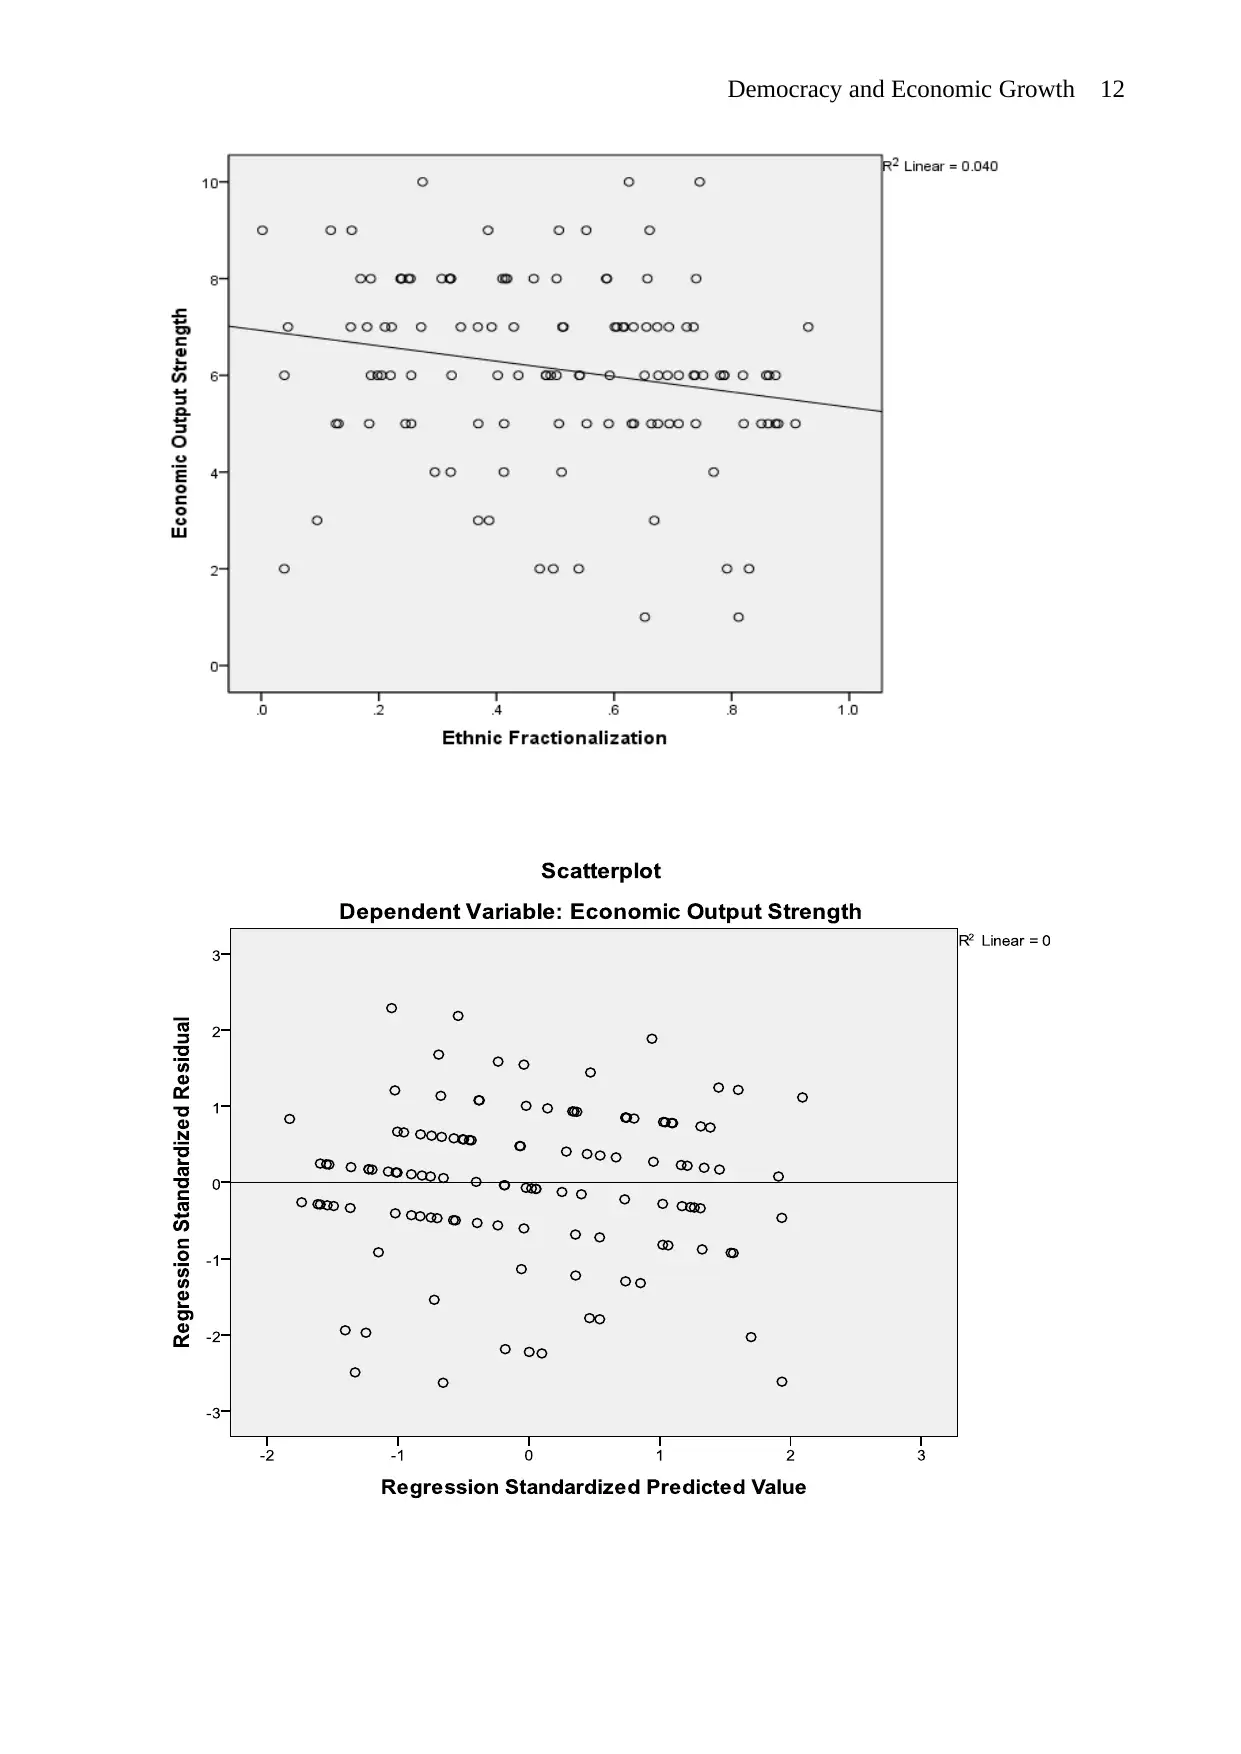
an alpha value of 5% (Gaston, 2014). According to the model, only 4% of the change in the
dependent variable economic output strength is explained by the independent variable ethnic
fractionalization. A unit increment in ethnic fractionalization will reduce the economic output
strength by 1.588. When the independent variable is zero the value of economic output
strength is relatively high at 6.928 out of 10. The scatterplot demonstrates that the model is
not the best fit for the data. The model can be written as follows:
Y =6.928−1.588( X)
Democracy and Economic Growth 12
⊘ This is a preview!⊘
Do you want full access?
Subscribe today to unlock all pages.
Trusted by 1+ million students worldwide
1 out of 30
Related Documents


Your All-in-One AI-Powered Toolkit for Academic Success.
+13062052269
info@desklib.com
Available 24*7 on WhatsApp / Email
![[object Object]](/_next/static/media/star-bottom.7253800d.svg)
Unlock your academic potential
Copyright © 2020–2026 A2Z Services. All Rights Reserved. Developed and managed by ZUCOL.