International Economics: Quantitative Easing Impact on China
VerifiedAdded on 2023/06/13
|21
|4735
|277
Report
AI Summary
This report analyzes the impact of quantitative easing (QE) on China's economy, focusing on the dismay expressed by the Chinese government due to the overweight US dollar position in their foreign currency reserves. It uses the forex market model to explain how QE affects China's undervalued exchange rate, considering the demand and supply of currency, interest rates, and the role of quantitative easing. The report examines the global financial crisis and the US quantitative easing policies, detailing the Chinese practice of devalued currency and the impact of QE between 2008 and 2013 on trade and US dollar-backed securities. Furthermore, it explores currency devaluation, fiscal stimulus, and monetary policy as tools for economic stimulation, providing diagrams and graphs to illustrate key economic indicators and trends.
qwertyuiopasdfghjklzxcvbnmqwertyui
opasdfghjklzxcvbnmqwertyuiopasdfgh
jklzxcvbnmqwertyuiopasdfghjklzxcvb
nmqwertyuiopasdfghjklzxcvbnmqwer
tyuiopasdfghjklzxcvbnmqwertyuiopas
dfghjklzxcvbnmqwertyuiopasdfghjklzx
cvbnmqwertyuiopasdfghjklzxcvbnmq
wertyuiopasdfghjklzxcvbnmqwertyuio
pasdfghjklzxcvbnmqwertyuiopasdfghj
klzxcvbnmqwertyuiopasdfghjklzxcvbn
mqwertyuiopasdfghjklzxcvbnmqwerty
uiopasdfghjklzxcvbnmqwertyuiopasdf
ghjklzxcvbnmqwertyuiopasdfghjklzxc
vbnmqwertyuiopasdfghjklzxcvbnmrty
uiopasdfghjklzxcvbnmqwertyuiopasdf
ghjklzxcvbnmqwertyuiopasdfghjklzxc
[Type the document title]
[Type the document subtitle]
[Pick the date]
aqua
Paraphrase This Document
Need a fresh take? Get an instant paraphrase of this document with our AI Paraphraser
Contents
Question 1...................................................................................................................................................4
1.1 Foreign Exchange Rate.......................................................................................................................4
1.1.1 Demand Side of a currency.........................................................................................................6
1.1.2 The Supply side of Currency........................................................................................................6
1.2 Foreign Exchange, Supply of Currency and Interest Rates.................................................................6
1.2.1 Foreign Exchange Markets and Interest Rates: The Role of Quantitative Easing........................7
1.3 The Global Financial Crisis and the US Quantitative Easing...............................................................8
1.4 Quantitative Easing by Federal Reserve Bank of USA: The Impact on China.....................................8
1.4.1 Background: The Chinese Practice of Devalued Currency...........................................................8
1.4.2 Quantitative Easing between 2008 and 2013.............................................................................9
1.4.3 Trade...........................................................................................................................................9
1.4.4 US Dollar and Dollar Backed Securities Portfolio of China........................................................11
Question2..................................................................................................................................................13
2. Currency Devaluation........................................................................................................................14
2.2 Fiscal Stimulus.................................................................................................................................15
2.3 Monetary Policy...............................................................................................................................16
References.................................................................................................................................................18
Graph 1 Real GDP of USA dropped sharply due to the Global Financial Crisis.............................................8
Graph 2 US Imports from China since 1985.................................................................................................9
Graph 3 Dollar Index Weighted For Trade.................................................................................................10
Graph 4 Short Term Interest Rates for USA...............................................................................................11
Graph 5 Long Term Interest Rates of USA.................................................................................................12
Graph 6 REER for US Dollar . Source (The World Bank, 2018)...................................................................15
Graph 7 Budget Deficit of USA since 2007.................................................................................................16
Figure 1 Supply and Demand Model of Currency and it's Price in the Forex Market..................................4
Figure 2 Increased Supply due to lower Interest Rates (Samuelson & Nordhaus, 2006).............................6
Figure 3 Aggregate Demand Shifts Rightward due to expansion...............................................................14
Figure 4 The Impact of Lower Interest Rate on Investment and GDP.......................................................17
⊘ This is a preview!⊘
Do you want full access?
Subscribe today to unlock all pages.
Trusted by 1+ million students worldwide
Question 1
1.1 Foreign Exchange Rate
Like Most markets, the Foreign exchange market rates differ from week to
week and month to month. This is due to the fact that, hypothetically,
Foreign Exchange rates are determined by supply and demand (assuming
there is no government intervention).(Samuelson & Nordhaus, 2006)
The Foreign exchange Market is the worldwide market in which different
currencies are traded and foreign exchange rates are determined.
(Cherunilam, 2005)
Foreign currencies are traded , in the retail level in many banks and firms
specializing in the business. Organized markets or exchanges in prominent
cities like New York, Tokyo, London trade billions of dollars each day.
(Samuelson & Nordhaus, 2006)
A typical supply demand curve can be used to illustrate how markets
determine the price of foreign currencies.(Cherunilam, 2005)
In the figure given below, the supply and demand for US Dollars that arise in
dealing with the currencies of other countries. In the given example, the
Yuan, which is the most basic unit of Remnibi is used to illustrate the supply
and demand.(Samuelson & Nordhaus, 2006)
Paraphrase This Document
Need a fresh take? Get an instant paraphrase of this document with our AI Paraphraser
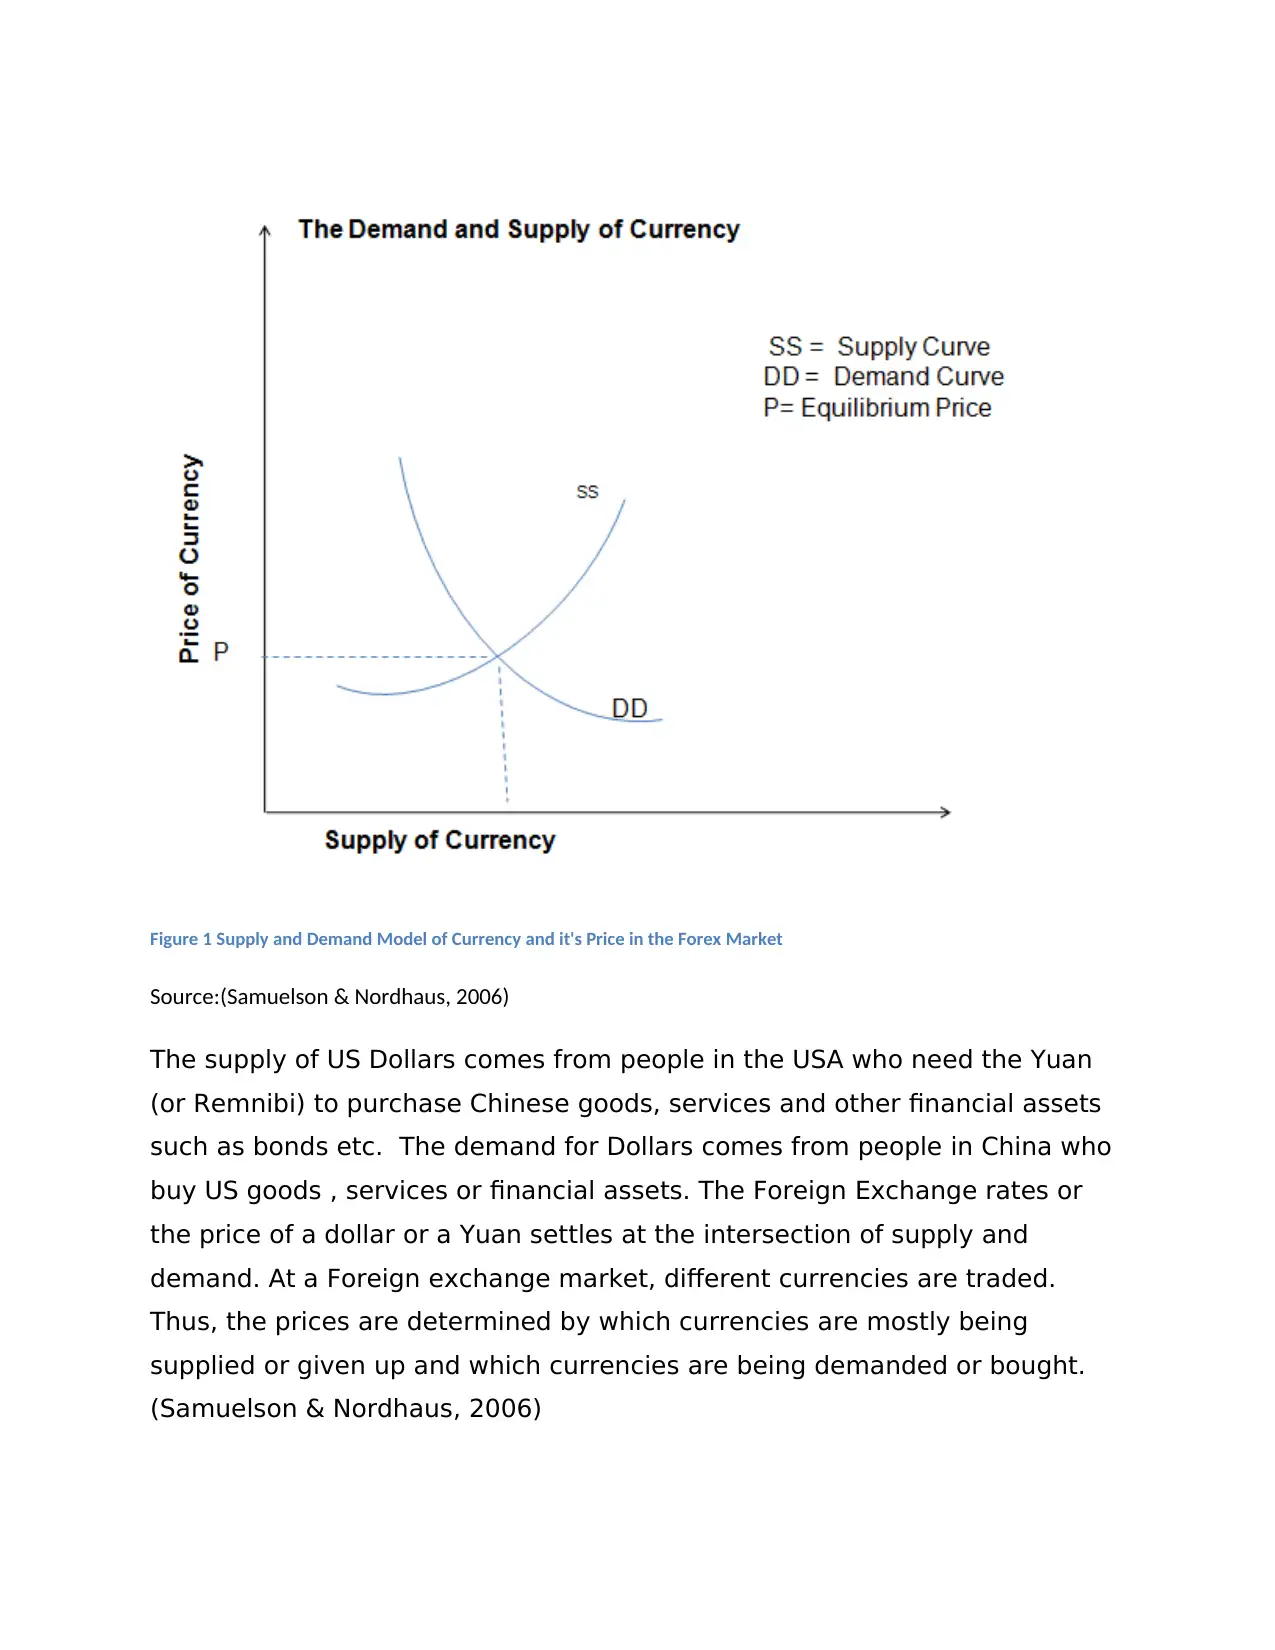
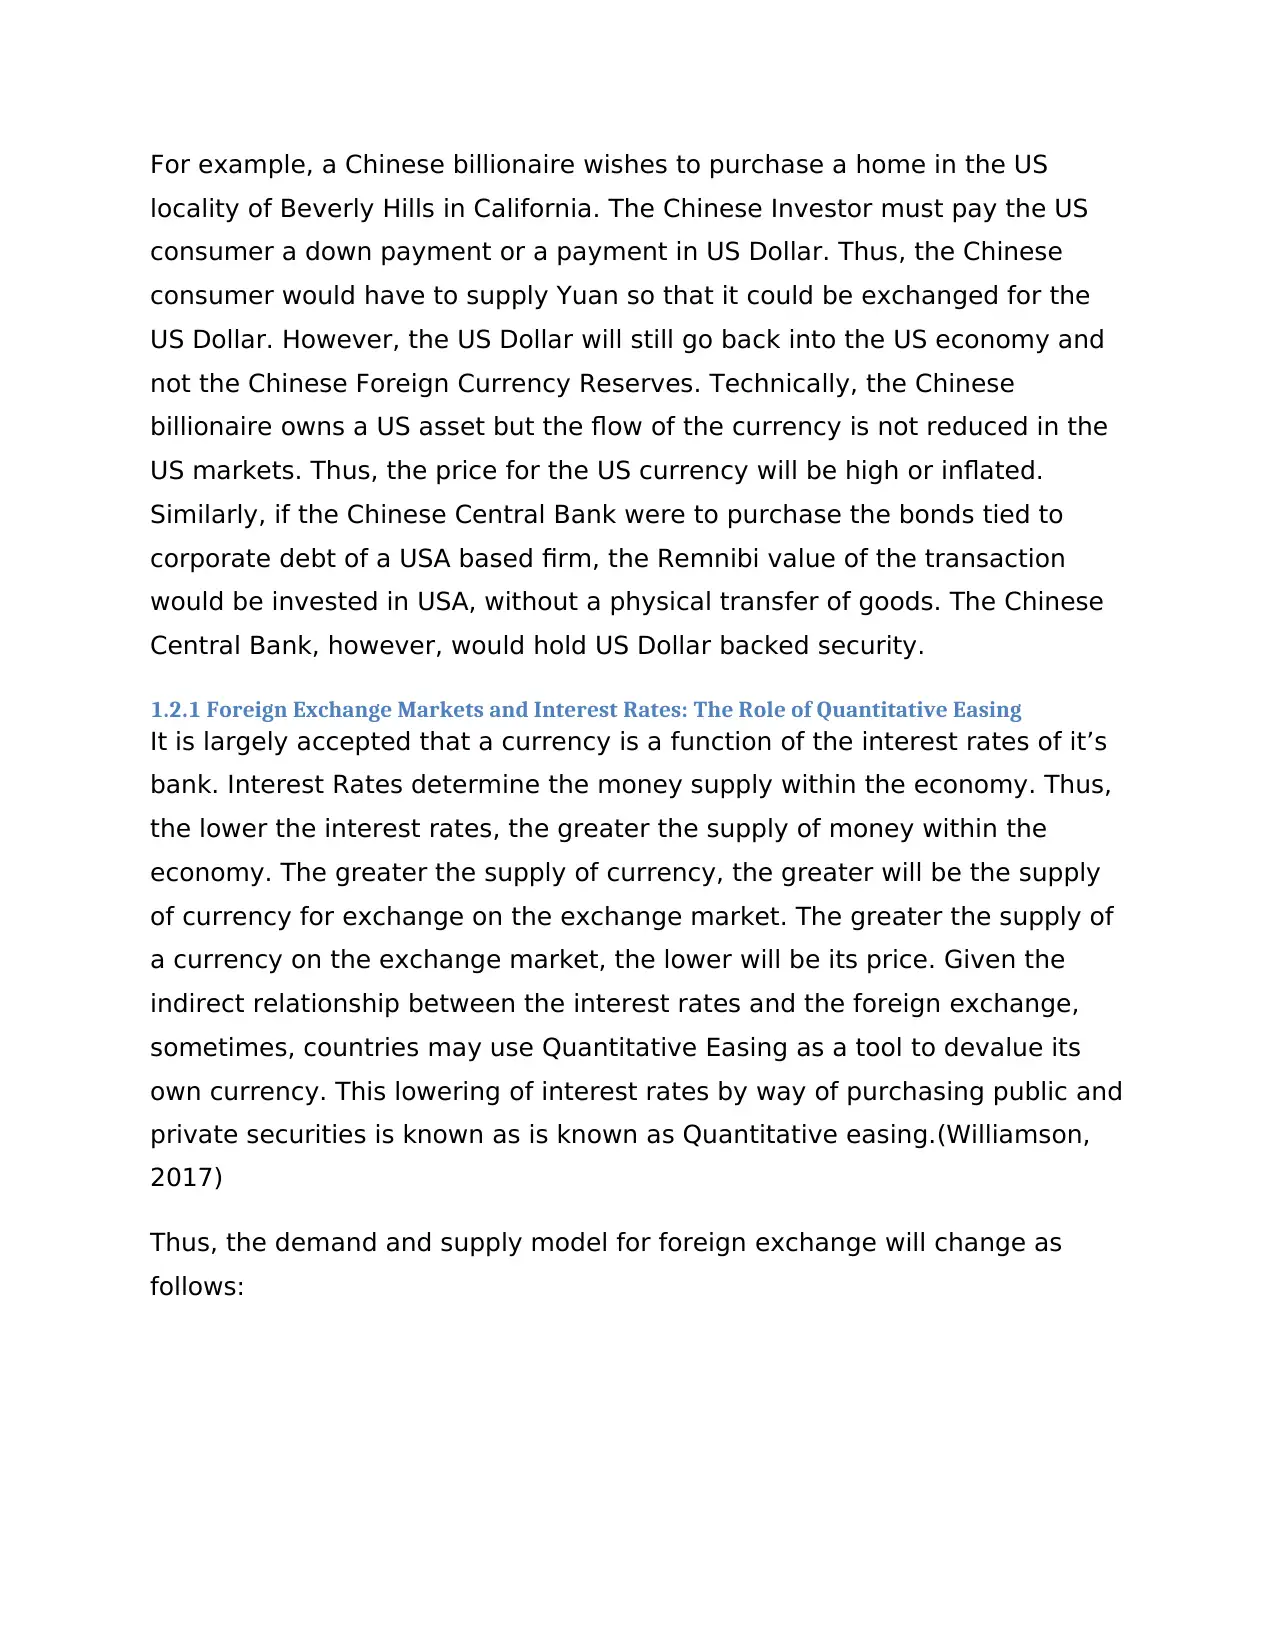
Figure 1 Supply and Demand Model of Currency and it's Price in the Forex Market
Source:(Samuelson & Nordhaus, 2006)
The supply of US Dollars comes from people in the USA who need the Yuan
(or Remnibi) to purchase Chinese goods, services and other financial assets
such as bonds etc. The demand for Dollars comes from people in China who
buy US goods , services or financial assets. The Foreign Exchange rates or
the price of a dollar or a Yuan settles at the intersection of supply and
demand. At a Foreign exchange market, different currencies are traded.
Thus, the prices are determined by which currencies are mostly being
supplied or given up and which currencies are being demanded or bought.
(Samuelson & Nordhaus, 2006)
In the diagram above , the Foreign Exchange Rate it at price “p” which
corresponds the equilibrium between supply and demand of the US Dollar in
the international currency markets.
1.1.1 Demand Side of a currency
The demand of the US Dollar to the market originates when the foreign
consumers need the US dollar to buy goods. However, it is not just
consumers but also, banks, investors etc. demand the US currency.
Additional demand for US Dollars also, arises when China based investors
(including Central Bank) which to purchase financial assets in USA etc. The
demand curve for a currency slopes downwards and this indicates that as
the US Dollar falls (and the Yuan becomes) more expensive, the residents of
China will want to buy more of US goods, services and Assets.(Samuelson &
Nordhaus, 2006) .
1.1.2 The Supply side of Currency
The supply of the US Dollar has been represented in the upward sloping SS
curve. The supply of the US dollar to a foreign exchange market originates
when Americans need to buy Yuan (or any foreign currency to purchase any
good).(Samuelson & Nordhaus, 2006)
It is important here to understand that, in reality, the supply of currency is
not a bilateral exchange. (Samuelson & Nordhaus, 2006) Samsung is a brand
from South Korea and may produce goods in China. In order to service orders
purchased in the USA, the Chinese unit of Samsung may either accept US
Dollars or Yuan or the South Korean Won. Samsung may prefer to hold US
Dollars for a variety of reasons.
1.2 Foreign Exchange, Supply of Currency and Interest Rates
The simple, demand and supply excludes one aspect though. It is, not
necessary that the amount of Dollars bought by a Chinese consumer will go
into the Foreign Exchange Reserves of China. (Samuelson & Nordhaus, 2006)
⊘ This is a preview!⊘
Do you want full access?
Subscribe today to unlock all pages.
Trusted by 1+ million students worldwide
For example, a Chinese billionaire wishes to purchase a home in the US
locality of Beverly Hills in California. The Chinese Investor must pay the US
consumer a down payment or a payment in US Dollar. Thus, the Chinese
consumer would have to supply Yuan so that it could be exchanged for the
US Dollar. However, the US Dollar will still go back into the US economy and
not the Chinese Foreign Currency Reserves. Technically, the Chinese
billionaire owns a US asset but the flow of the currency is not reduced in the
US markets. Thus, the price for the US currency will be high or inflated.
Similarly, if the Chinese Central Bank were to purchase the bonds tied to
corporate debt of a USA based firm, the Remnibi value of the transaction
would be invested in USA, without a physical transfer of goods. The Chinese
Central Bank, however, would hold US Dollar backed security.
1.2.1 Foreign Exchange Markets and Interest Rates: The Role of Quantitative Easing
It is largely accepted that a currency is a function of the interest rates of it’s
bank. Interest Rates determine the money supply within the economy. Thus,
the lower the interest rates, the greater the supply of money within the
economy. The greater the supply of currency, the greater will be the supply
of currency for exchange on the exchange market. The greater the supply of
a currency on the exchange market, the lower will be its price. Given the
indirect relationship between the interest rates and the foreign exchange,
sometimes, countries may use Quantitative Easing as a tool to devalue its
own currency. This lowering of interest rates by way of purchasing public and
private securities is known as is known as Quantitative easing.(Williamson,
2017)
Thus, the demand and supply model for foreign exchange will change as
follows:
Paraphrase This Document
Need a fresh take? Get an instant paraphrase of this document with our AI Paraphraser
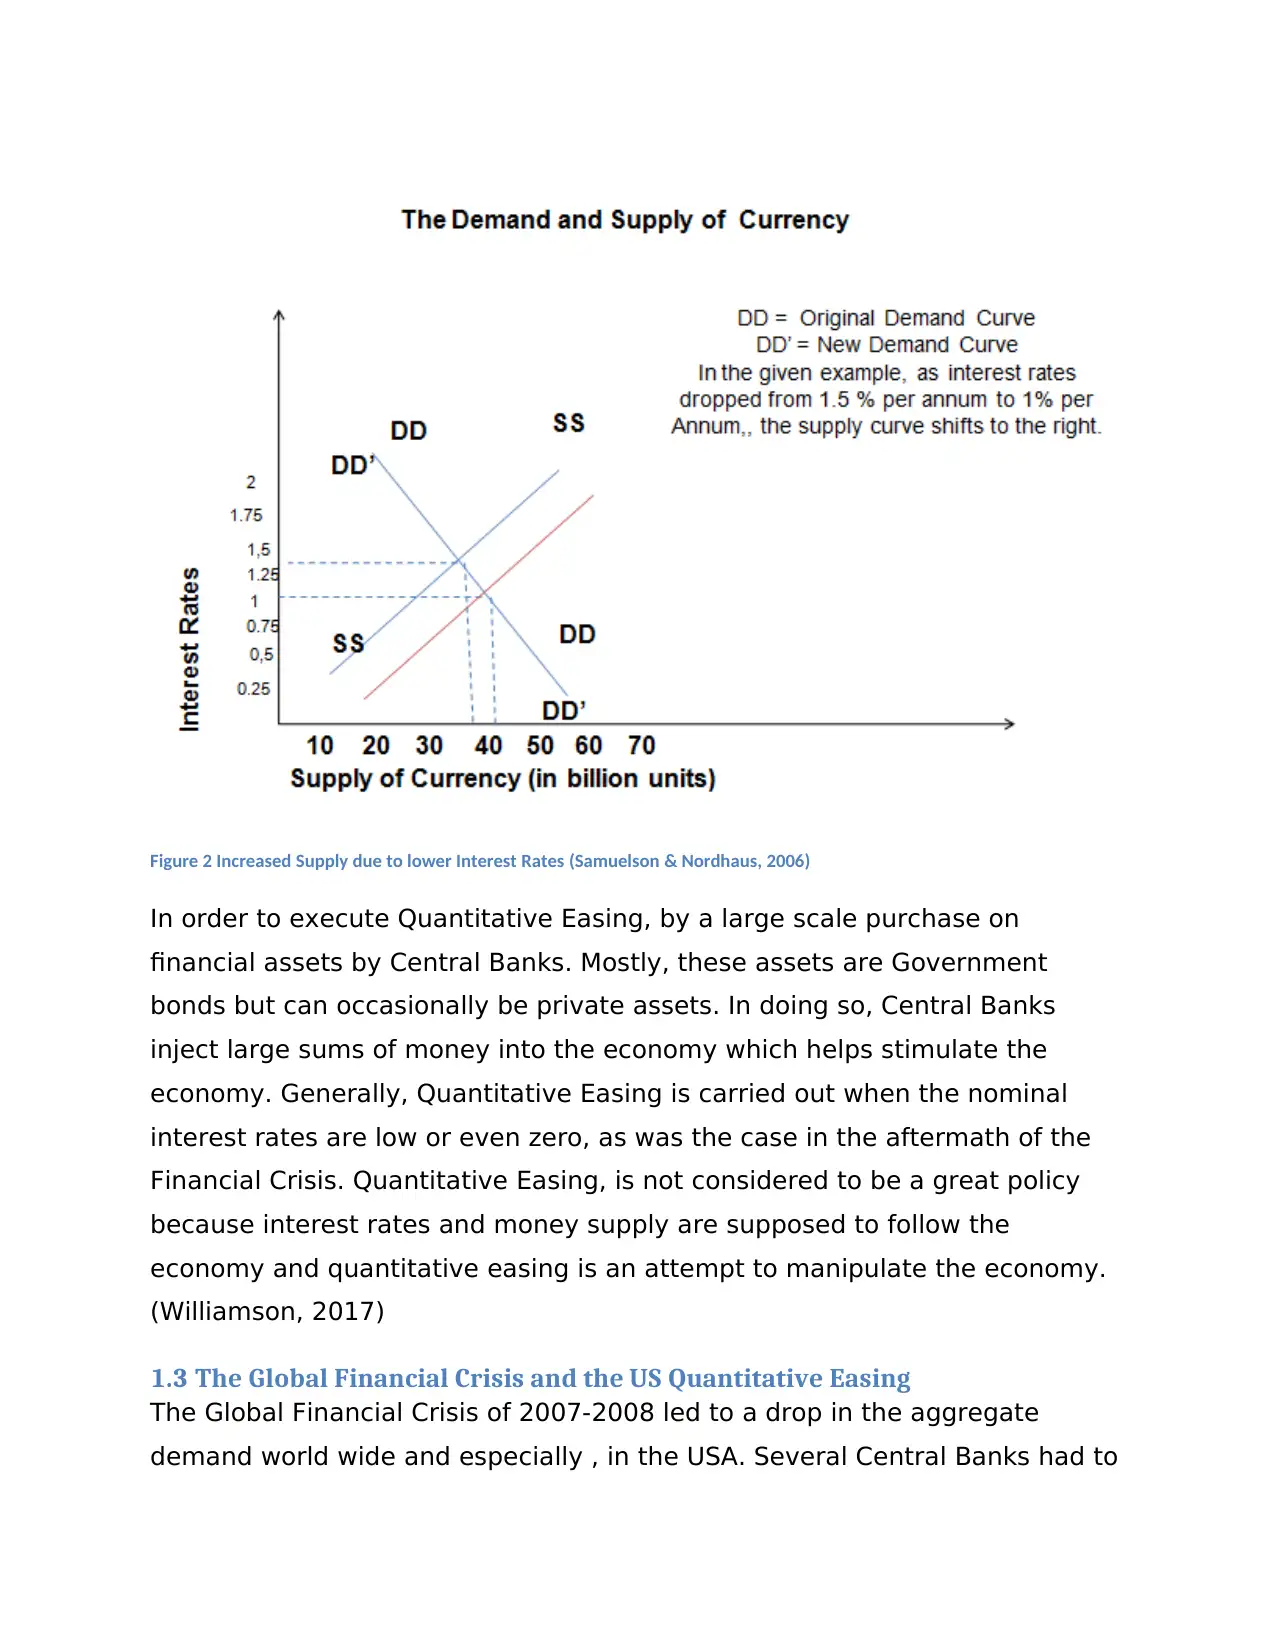
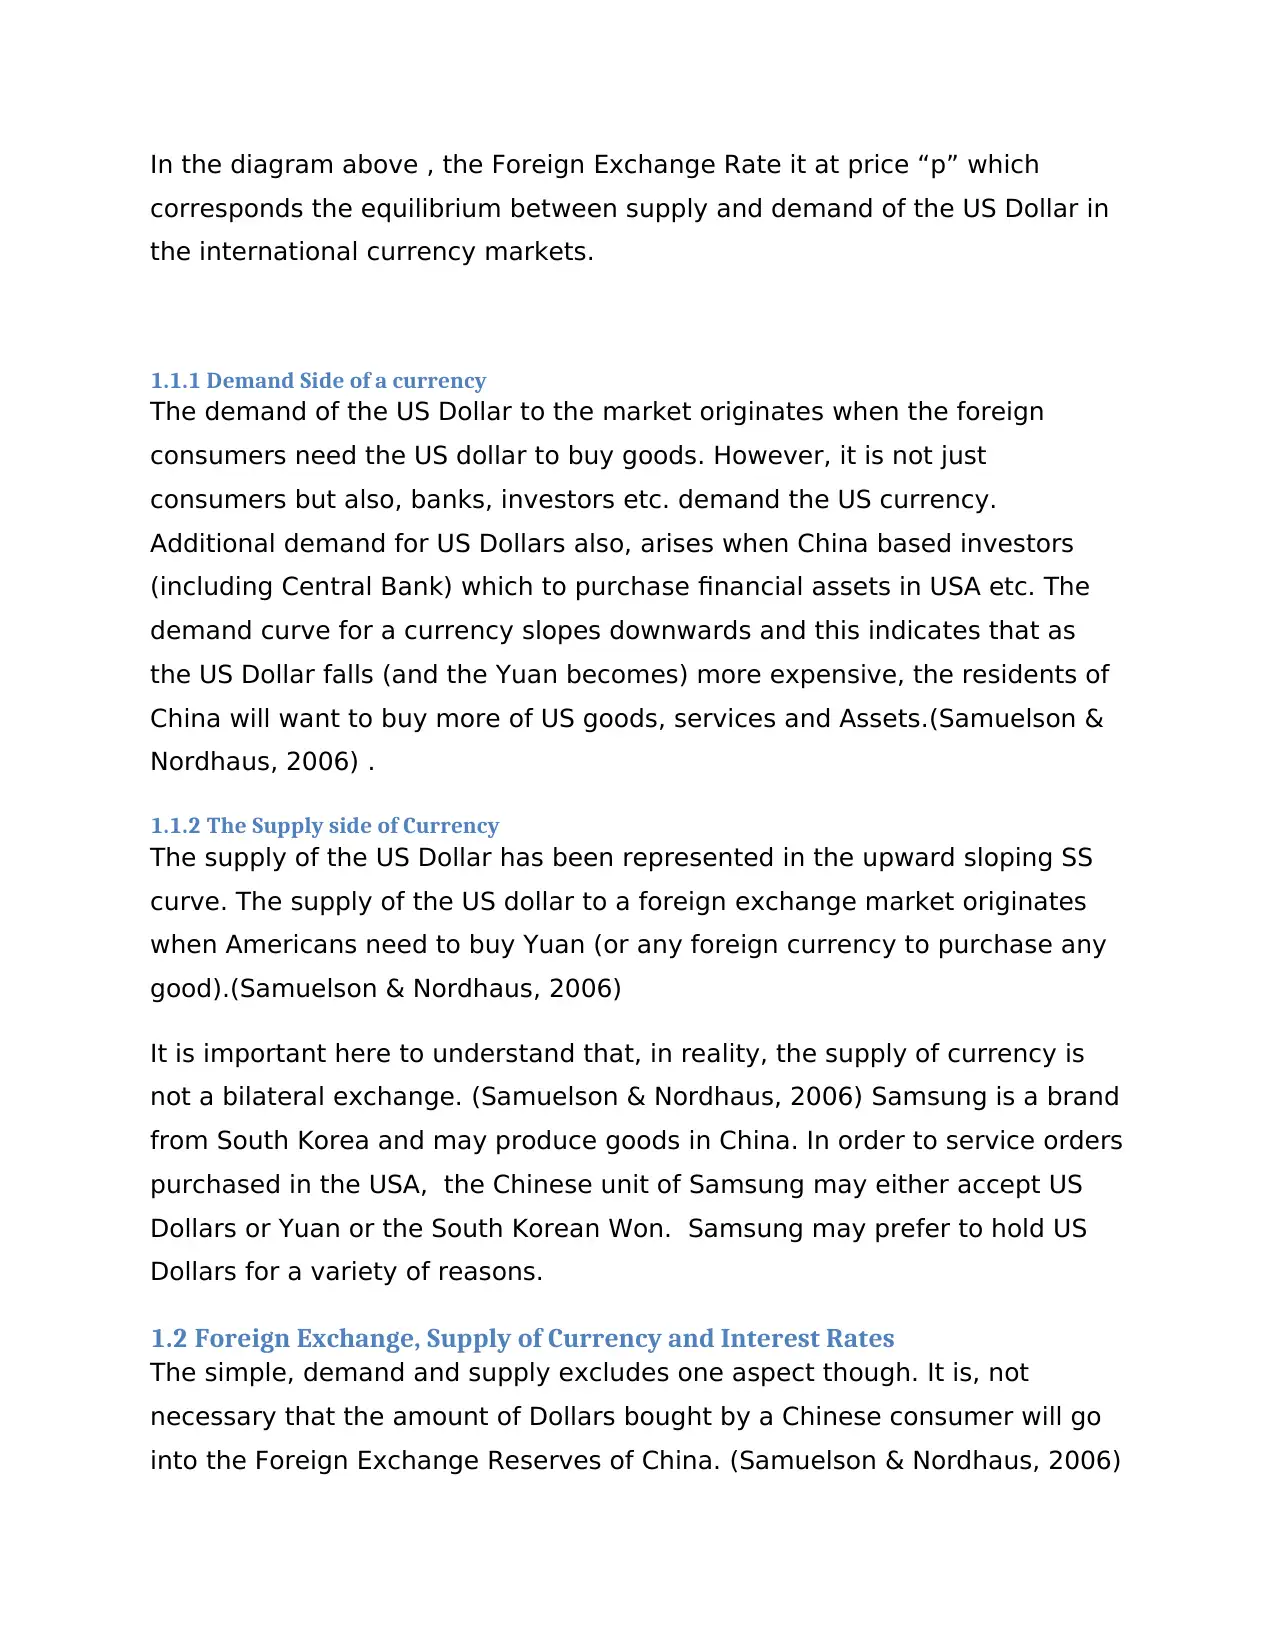
Figure 2 Increased Supply due to lower Interest Rates (Samuelson & Nordhaus, 2006)
In order to execute Quantitative Easing, by a large scale purchase on
financial assets by Central Banks. Mostly, these assets are Government
bonds but can occasionally be private assets. In doing so, Central Banks
inject large sums of money into the economy which helps stimulate the
economy. Generally, Quantitative Easing is carried out when the nominal
interest rates are low or even zero, as was the case in the aftermath of the
Financial Crisis. Quantitative Easing, is not considered to be a great policy
because interest rates and money supply are supposed to follow the
economy and quantitative easing is an attempt to manipulate the economy.
(Williamson, 2017)
1.3 The Global Financial Crisis and the US Quantitative Easing
The Global Financial Crisis of 2007-2008 led to a drop in the aggregate
demand world wide and especially , in the USA. Several Central Banks had to
keep interest rates near Zero. This led to the narrowing margins between the
Long Term and Short Term Interest Rates. (Williamson, 2017)
There are several reasons that lead Central Bankers to adopt Quantitative
easing but one of the reasons is that the process of Quantitative Easing
converts Long Term Bonds in Short Term Reserves while flushing out the
short term reserves into the economy. (Williamson, 2017) This presents risks
within the banking system. With cash reserves gone, there is a serious risks
that banks would be able to lend money for mortgage backed securities. In
the absence of enough credit, business’s going concern would be affected.
The ability to pay loans back would be affected by such a move.(Knowledge
At Wharton, 2011) Moreover, banks themselves were at risk, as the cash
reserves would dry up. The bank’s ability to pay its depositors would be
affected. Additionally, when cash reserves run low, consumer confidence
may run low and depositor’s may make a run towards banks.
1.4 Quantitative Easing by Federal Reserve Bank of USA: The Impact on China
1.4.1 Background: The Chinese Practice of Devalued Currency
China had a practice of interventions in the rate of its currency by keeping it
devalued, in order to ensure that the it’s exports remained low priced. China
usually, pursued this policy by buying large sums of foreign currency. Around
2009, China had held a substantial amount of US securities . The US Dollar
was overweight in the portfolio of the Central Bank of China. (Evans-
Pritchard, 2009)
1.4.2 Quantitative Easing between 2008 and 2013
In November 2008, The US announced the launch of, what came to be known
as Quantitative Easing 1. By September 2012, the US Federal Reserve Bank
launched a third round of easing , which was its largest round. During this
⊘ This is a preview!⊘
Do you want full access?
Subscribe today to unlock all pages.
Trusted by 1+ million students worldwide
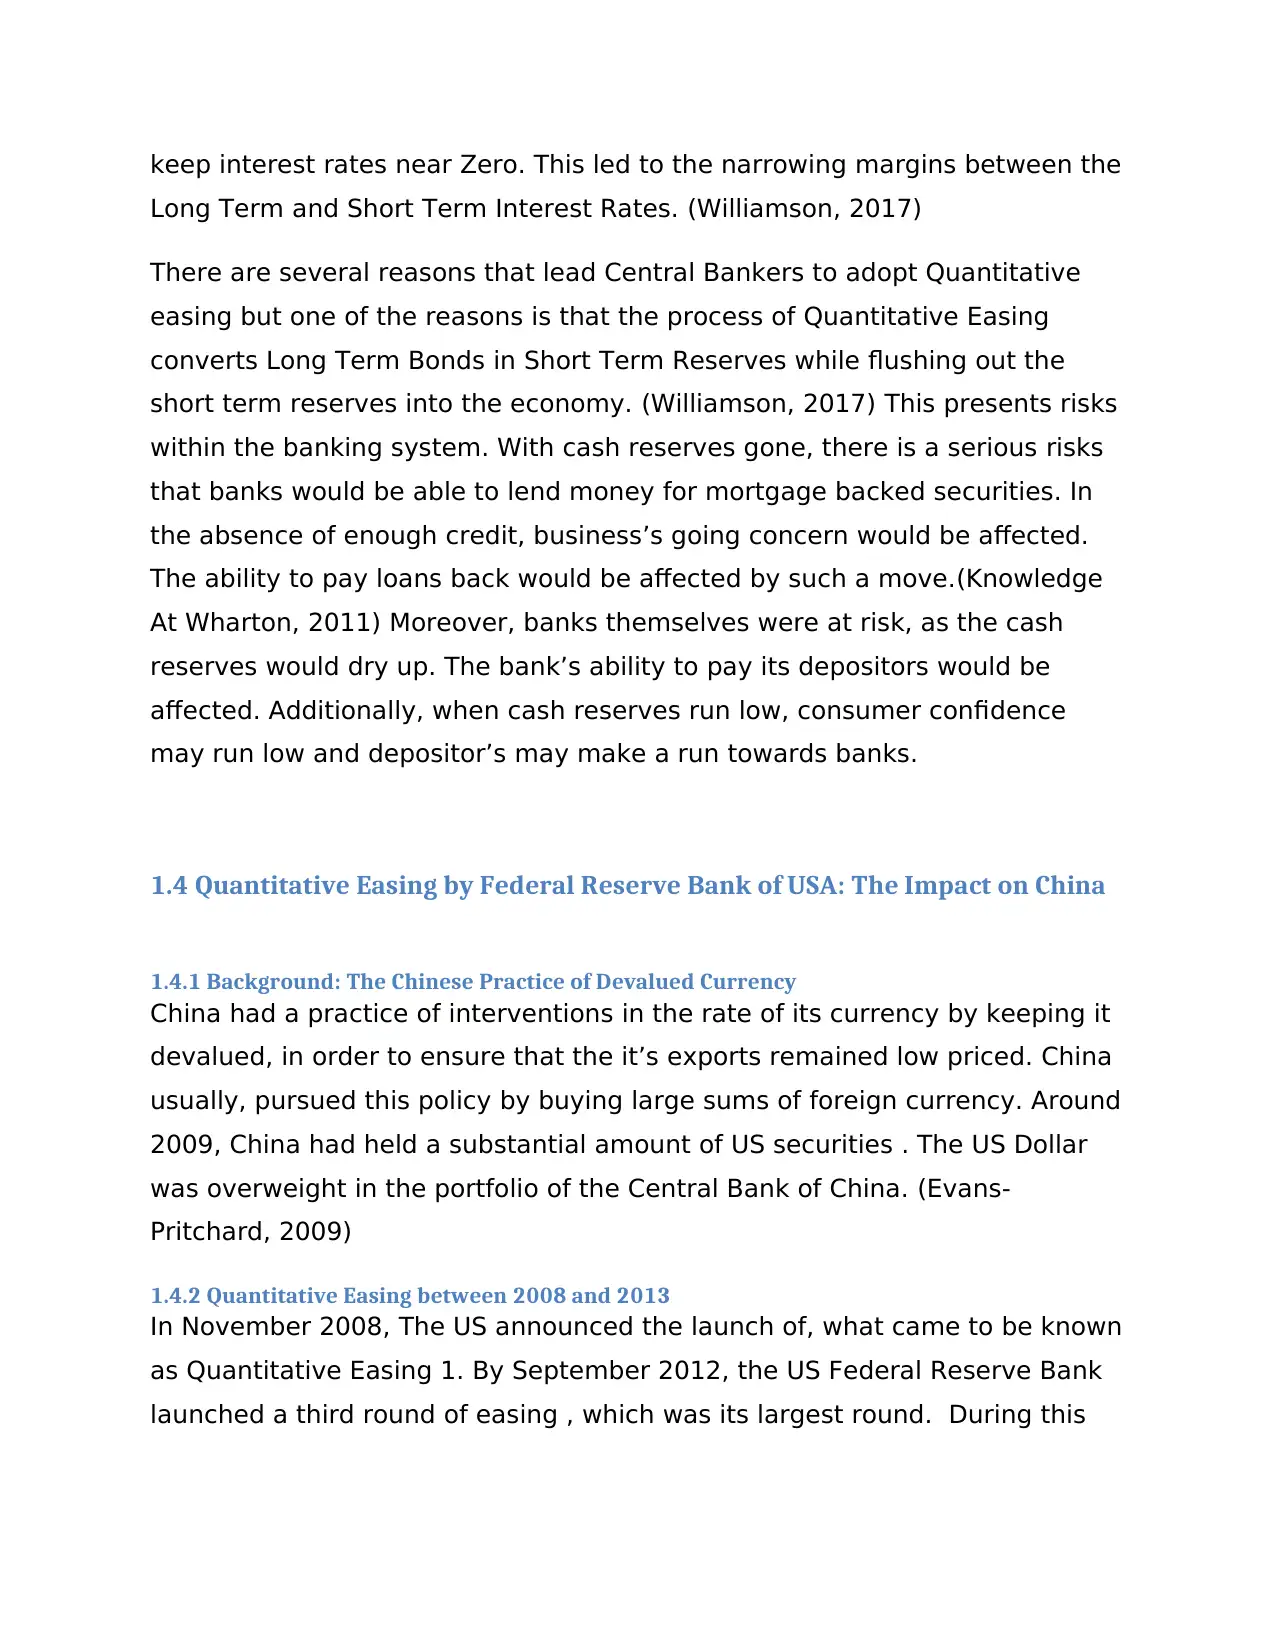
round, over 85 Billion Dollars were to be purchased per month. . (Williamson,
2017)
1985
1988
1991
1994
1997
2000
2003
2006
2009
2012
2015
-4
-3
-2
-1
0
1
2
3
4
5
6
Real GDP Growth Rate USA
Real GDP Growth Rate USA
Graph 1 Real GDP of USA dropped sharply due to the Global Financial Crisis
As seen in the graph above, the Real Gross Domestic Product of USA began
went into negative i.e USA went into a recession between 2007 and 2009.
The Federal Reserve Bank of USA, wanted to keep the inflation rates high, in
order to stimulate economy. Injection of funds into the economy was a
solution that seemed to have worked since the USA was out of recession and
at a healthy growth rate of 3 % per annum, according to this graph. USA
wanted to keep this cycle of inflation high and ensure that the economy does
not slip back into a recession. Hence, the Quantitative Easing sustained.
1.4.3 Trade
China and USA are trade partners and USA is one of the biggest importers of
Chinese goods. A cheaper Dollar would mean that Chinese imports would
become expensive. In the After math of the Global Financial Crisis, the
aggregate demand of goods and services all over the world was lowered.
This would further drag down the demand for Chinese goods.(Knowledge At
Wharton, 2011)
Paraphrase This Document
Need a fresh take? Get an instant paraphrase of this document with our AI Paraphraser
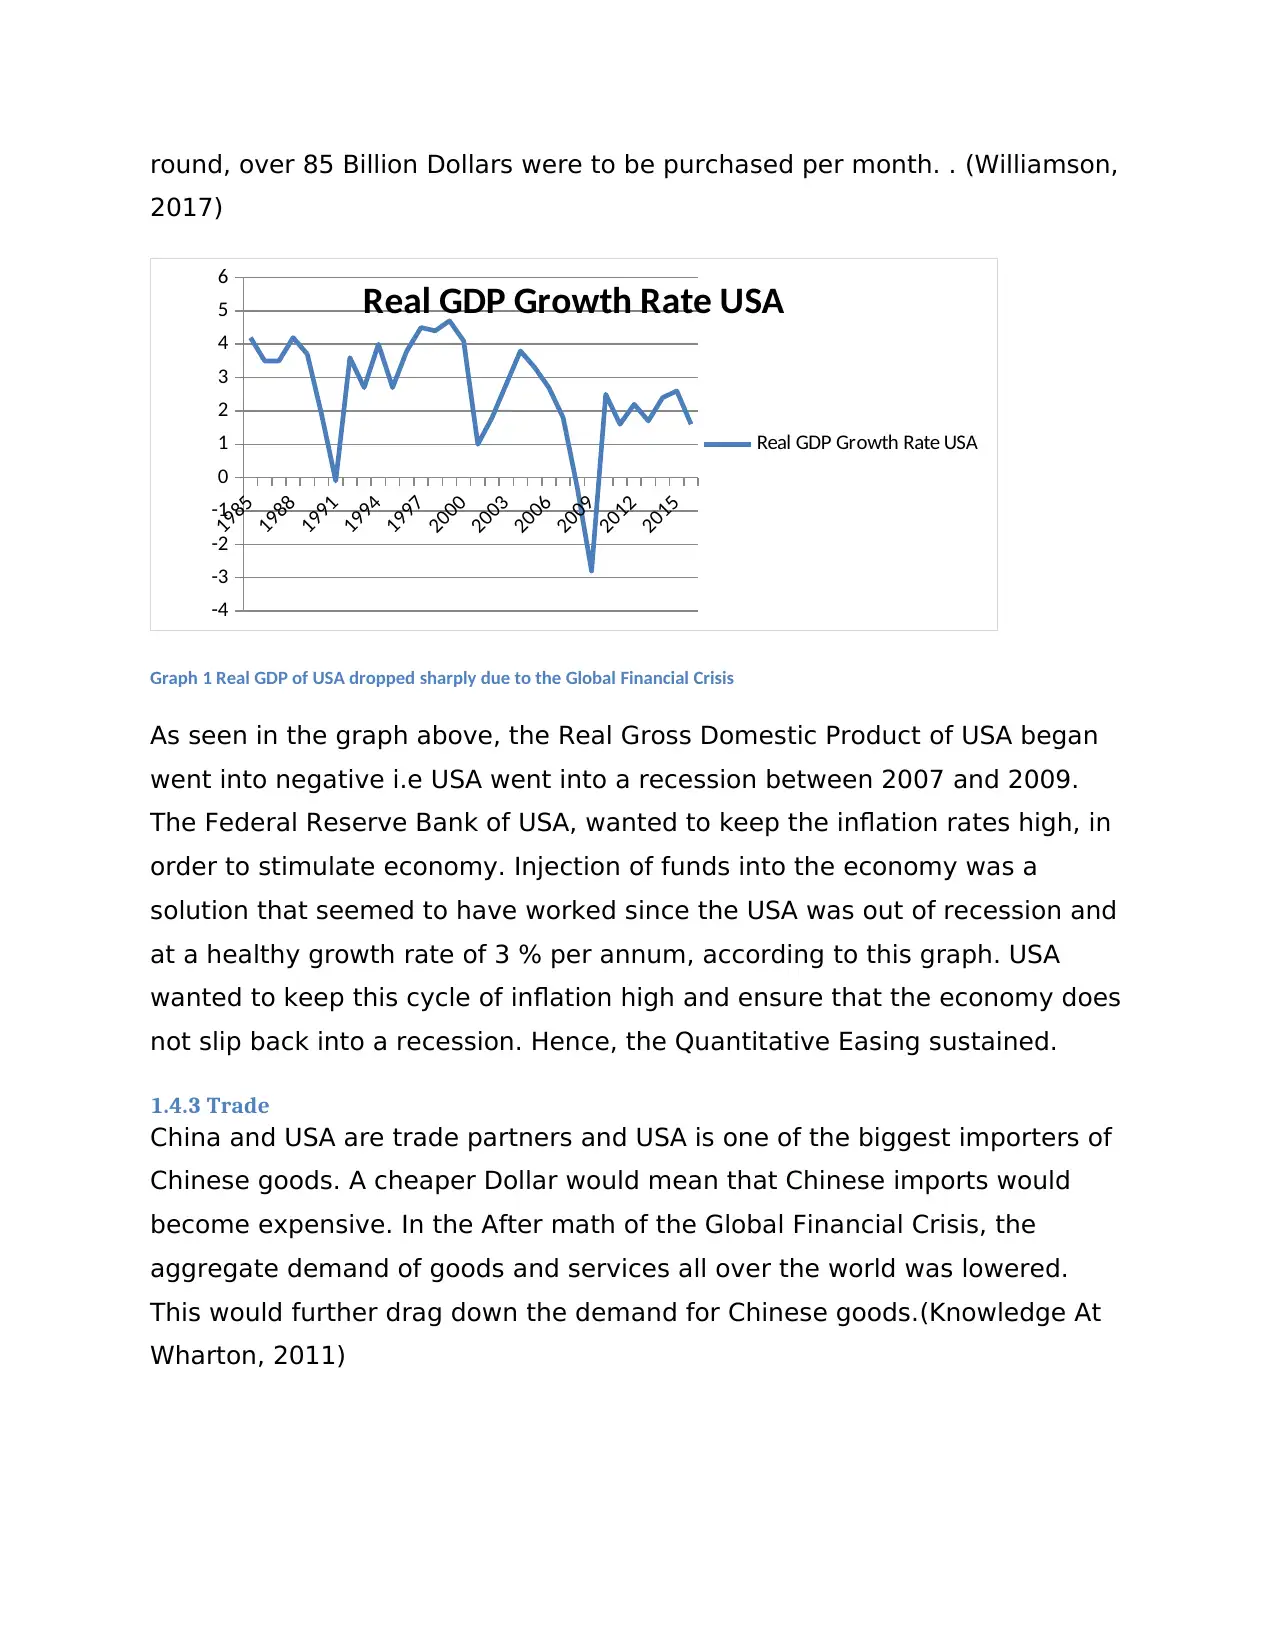
Graph 2 US Imports from China since 1985.
Source: (Board of Governors of the Federal Reserve System, 2018)
1990-01-01
1993-01-01
1996-01-01
1999-01-01
2002-01-01
2005-01-01
2008-01-01
2011-01-01
0.0000
20.0000
40.0000
60.0000
80.0000
100.0000
120.0000
140.0000
160.0000
Trade Weighted U.S. Dollar Index
Trade Weighted Dollar
Index
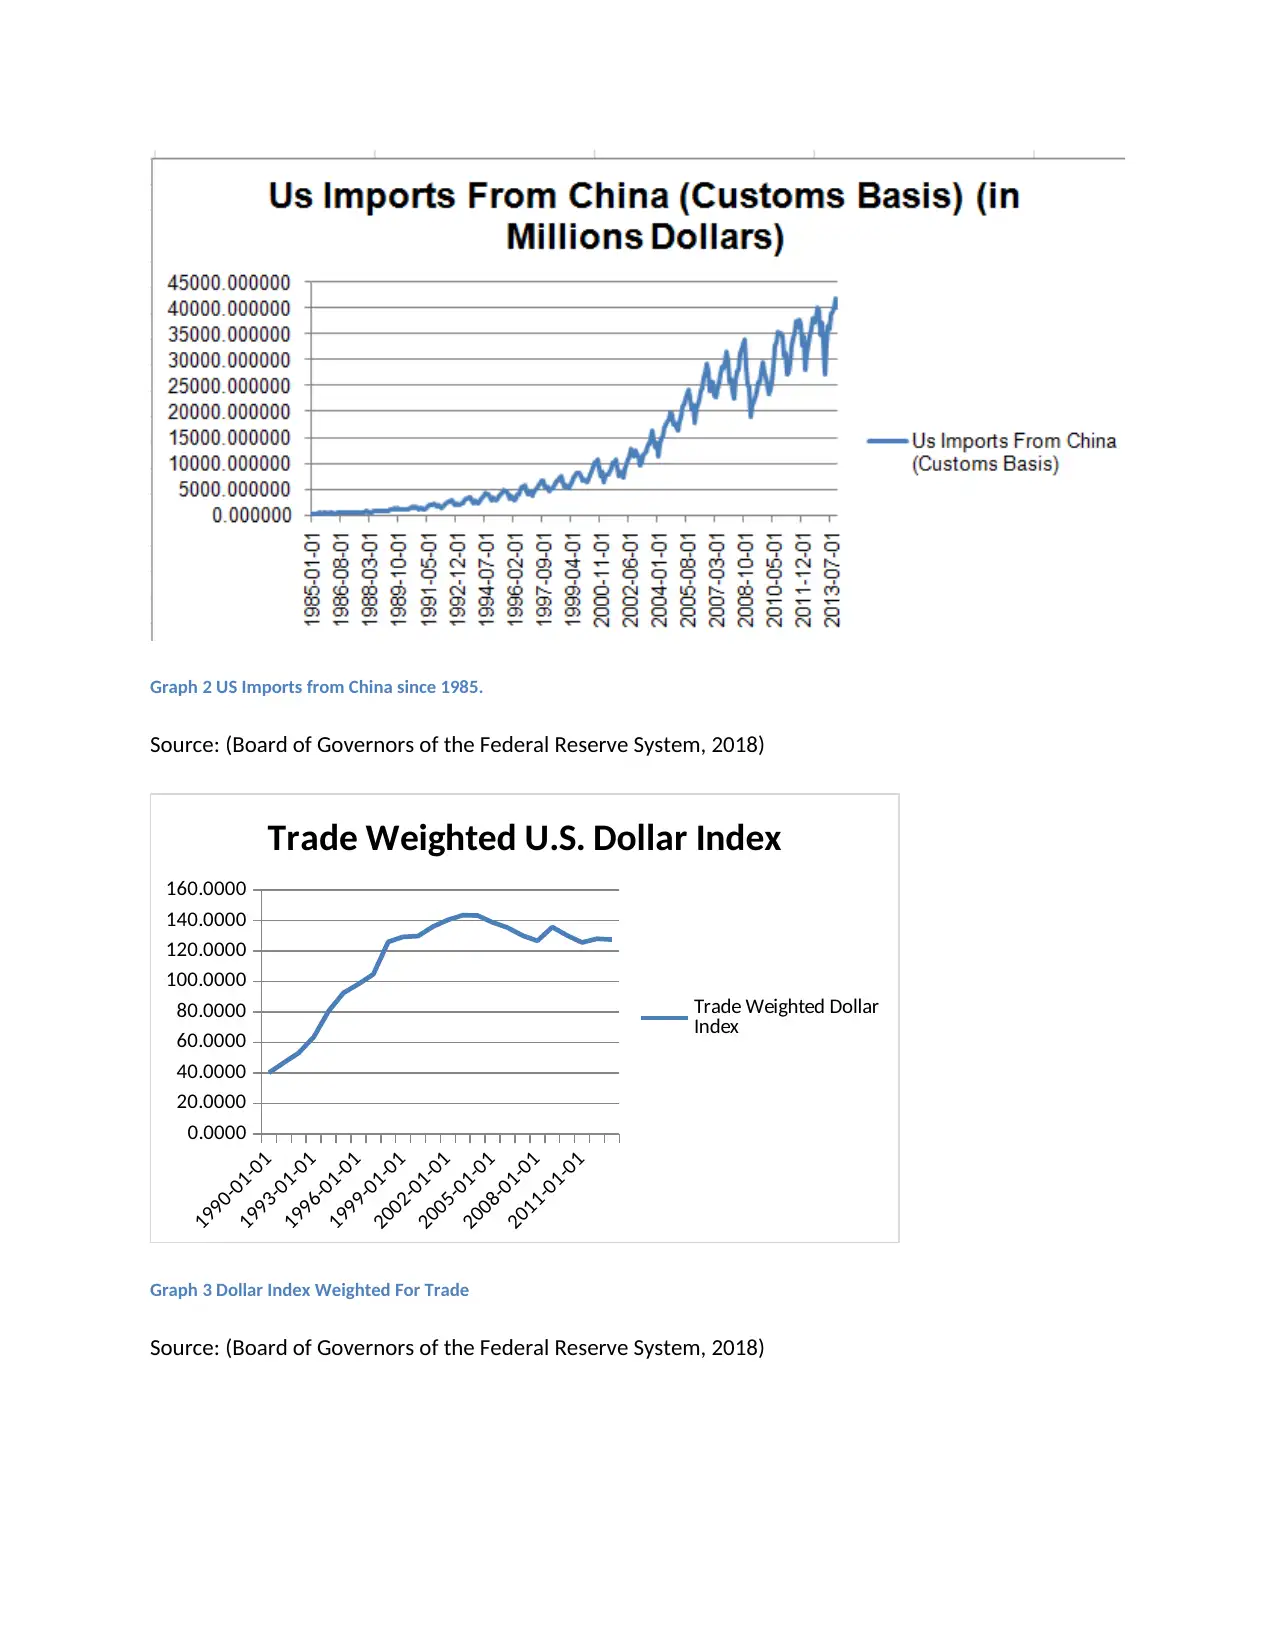
Graph 3 Dollar Index Weighted For Trade
Source: (Board of Governors of the Federal Reserve System, 2018)
Source: (Board of Governors of the Federal Reserve System, 2018)
1990-01-01
1993-01-01
1996-01-01
1999-01-01
2002-01-01
2005-01-01
2008-01-01
2011-01-01
0.0000
20.0000
40.0000
60.0000
80.0000
100.0000
120.0000
140.0000
160.0000
Trade Weighted U.S. Dollar Index
Trade Weighted Dollar
Index
Graph 3 Dollar Index Weighted For Trade
Source: (Board of Governors of the Federal Reserve System, 2018)
As seen in graph 2, the US imports from China have shown an increasing
trend since 1985. The sharp dip during the Financial Crisis (between the
period of March 2008 and May 2010 has been the widest dip in the graph of
imports between two countries.
Graph 3 shows the Dollar Index Weighted for Trade. The Dollar Index that
was trade weighted rose between the period late 2007 and achieved a one of
it’s highest peaks since 1990 and begain to fall in the aftermath of this crisis.
One of the reasons that this could have happened is due to the reduction in
imports during the global financial crisis.
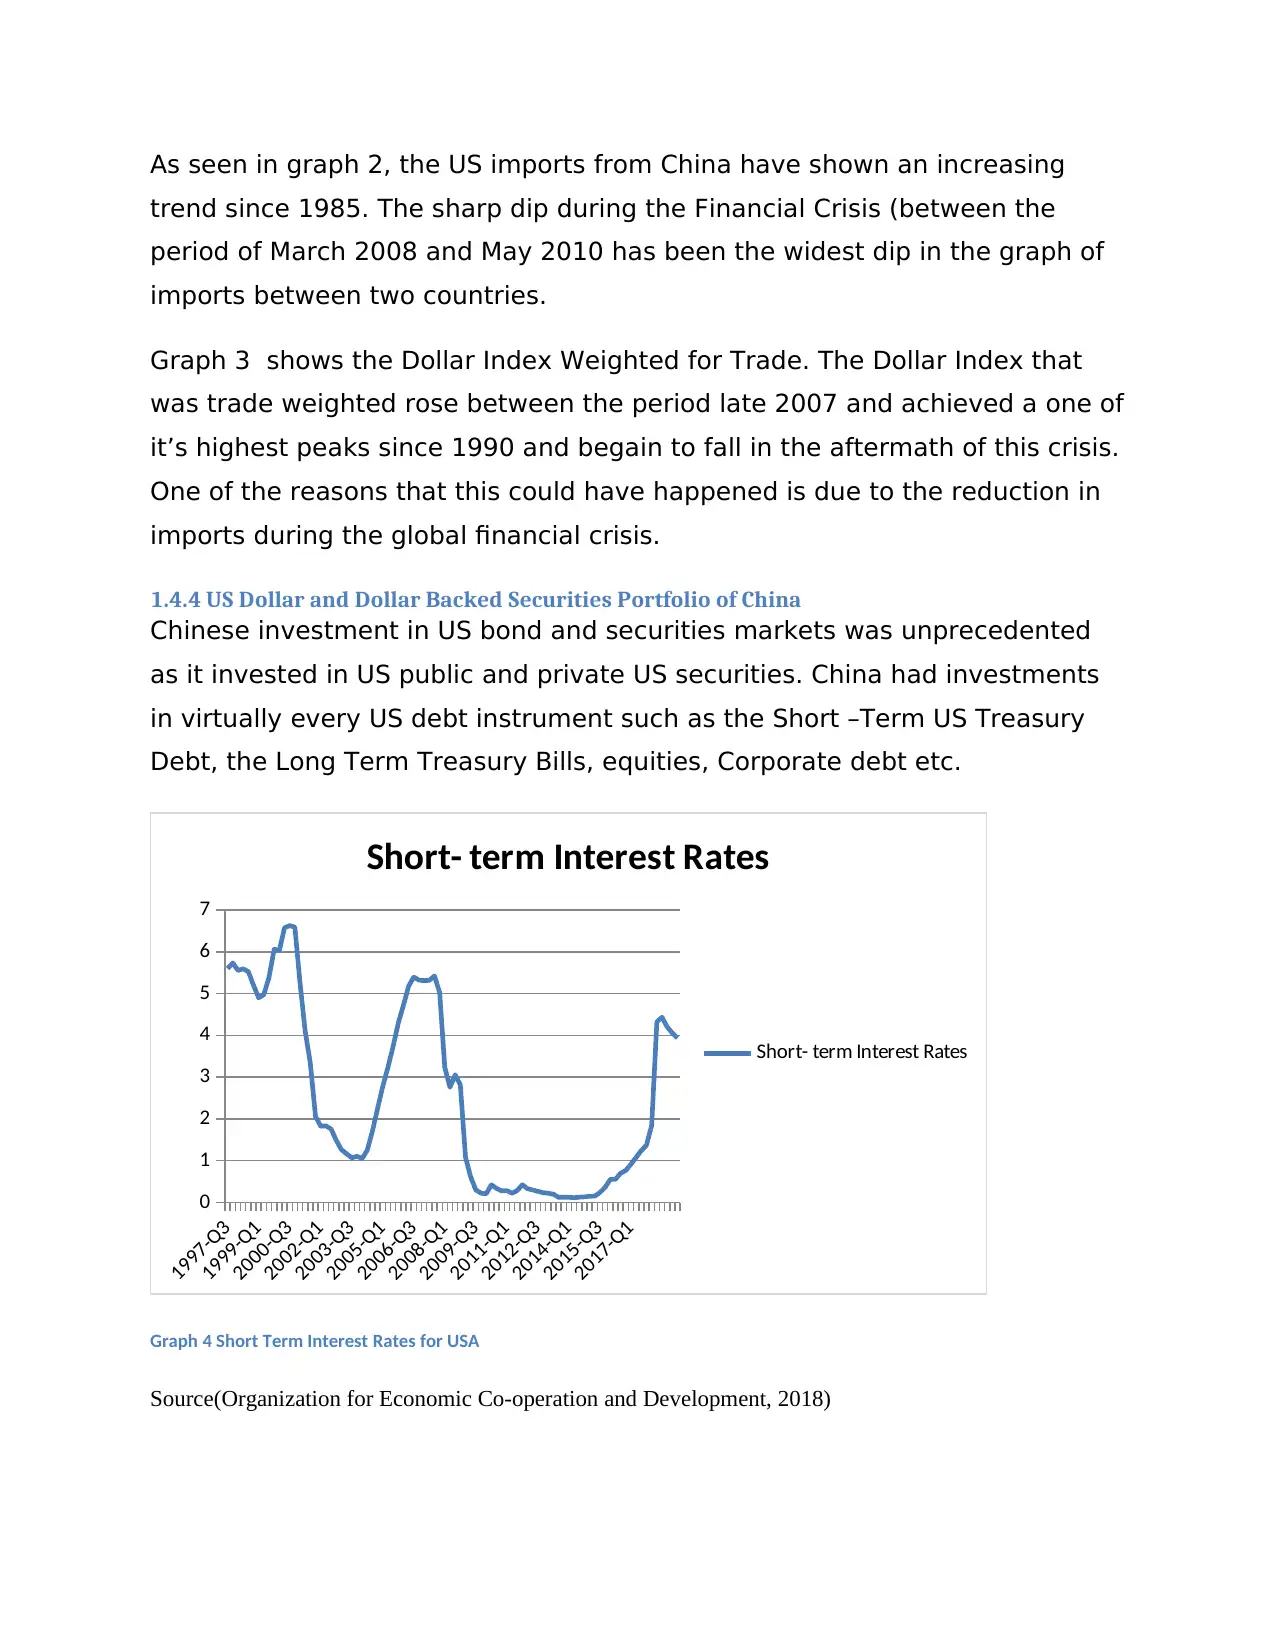
1.4.4 US Dollar and Dollar Backed Securities Portfolio of China
Chinese investment in US bond and securities markets was unprecedented
as it invested in US public and private US securities. China had investments
in virtually every US debt instrument such as the Short –Term US Treasury
Debt, the Long Term Treasury Bills, equities, Corporate debt etc.
1997-Q3
1999-Q1
2000-Q3
2002-Q1
2003-Q3
2005-Q1
2006-Q3
2008-Q1
2009-Q3
2011-Q1
2012-Q3
2014-Q1
2015-Q3
2017-Q1
0
1
2
3
4
5
6
7
Short- term Interest Rates
Short- term Interest Rates
Graph 4 Short Term Interest Rates for USA
Source(Organization for Economic Co-operation and Development, 2018)
trend since 1985. The sharp dip during the Financial Crisis (between the
period of March 2008 and May 2010 has been the widest dip in the graph of
imports between two countries.
Graph 3 shows the Dollar Index Weighted for Trade. The Dollar Index that
was trade weighted rose between the period late 2007 and achieved a one of
it’s highest peaks since 1990 and begain to fall in the aftermath of this crisis.
One of the reasons that this could have happened is due to the reduction in
imports during the global financial crisis.
1.4.4 US Dollar and Dollar Backed Securities Portfolio of China
Chinese investment in US bond and securities markets was unprecedented
as it invested in US public and private US securities. China had investments
in virtually every US debt instrument such as the Short –Term US Treasury
Debt, the Long Term Treasury Bills, equities, Corporate debt etc.
1997-Q3
1999-Q1
2000-Q3
2002-Q1
2003-Q3
2005-Q1
2006-Q3
2008-Q1
2009-Q3
2011-Q1
2012-Q3
2014-Q1
2015-Q3
2017-Q1
0
1
2
3
4
5
6
7
Short- term Interest Rates
Short- term Interest Rates
Graph 4 Short Term Interest Rates for USA
Source(Organization for Economic Co-operation and Development, 2018)
⊘ This is a preview!⊘
Do you want full access?
Subscribe today to unlock all pages.
Trusted by 1+ million students worldwide
1 out of 21
Related Documents


Your All-in-One AI-Powered Toolkit for Academic Success.
+13062052269
info@desklib.com
Available 24*7 on WhatsApp / Email
![[object Object]](/_next/static/media/star-bottom.7253800d.svg)
Unlock your academic potential
Copyright © 2020–2026 A2Z Services. All Rights Reserved. Developed and managed by ZUCOL.