University Finance: Rio Tinto Dividend Discount Model Analysis Report
VerifiedAdded on 2022/09/18
|13
|4144
|24
Report
AI Summary
This report provides a comprehensive analysis of Rio Tinto using the Dividend Discount Model (DDM). It begins with rationales for selecting Rio Tinto and the DDM, followed by an overview of Rio Tinto's business operations and the suitability of the DDM for valuation. The report justifies the choice of a three-stage dividend growth model and details the determination of the dividend growth rate, including methods for estimation and relevant calculations. It then estimates the required rate of return using the Capital Asset Pricing Model (CAPM) and interprets the estimation results. The report calculates Rio Tinto's intrinsic value based on the DDM, discusses the findings, and concludes with a summary of the estimation results and a comparison of CAPM and DDM. References are included to support the analysis.
Running head: REPORT 0
RIO TINTO
APRIL 15, 2020
STUDENT DETAILS
RIO TINTO
APRIL 15, 2020
STUDENT DETAILS
Paraphrase This Document
Need a fresh take? Get an instant paraphrase of this document with our AI Paraphraser
REPORT 1
Contents
Rationales for selection of company and selection of Dividend Discount Model (DDM) –........................2
Brief overview of Rio Tinto....................................................................................................................2
Suitability of Dividend Discount Model (DDM) for Rio Tinto...............................................................2
Justification for the decision on the number of stages of dividend growth..............................................3
Determination of dividend growth rate -......................................................................................................4
Method of estimating dividend growth rate.............................................................................................4
Workings of deriving dividend growth rate.............................................................................................5
Estimation of required rate of return using OLS method and interpretation of estimation results –............6
Specification and estimation of the model...............................................................................................6
Discussion of the estimated results..........................................................................................................8
Calculation of Intrinsic value of Rio Tinto –...............................................................................................8
Discussion and conclusion...........................................................................................................................9
Summary of estimation results................................................................................................................9
Analysis of CAPM and Dividend Discount Model................................................................................10
References.................................................................................................................................................12
REPORT 2
Rationales for selection of entity and selection of DDM –
The rationales for choosing Rio Tinto as a company and dividend discount model are discussed
below:
Brief overview of Rio Tinto
Rio Tinto is listed mining as well as exploration organisation in Australia and United Kingdom.
Rio Tinto operates its business of mining, finding and processing mineral sources. It is second
biggest metal & mining company of the world, after BHP Billiton. The entity is registered
at London Stock Exchange as well as ASX. It has joint headquarters in both
Melbourne (‘Limited’ in Australia) as well as London (international & ‘PLC’). The divisions of
the organisation include aluminium, energy and minerals, Iron Ore, Copper, and Diamond, along
with different functions. It can see that the company also runs the business of the By-products,
such as gold, lead along with silver. It runs business of iron ore and supplies international sea
borne iron ore trade. The operations related to Iron Ore are placed in Pilbara area of Western
Australia. It can see that operations cover about 5 iron ore products along with 4 port terminals.
The business of aluminium covers alumina refinery, aluminium smelters, as well as bauxite
mines. The bauxite mines are situated in Brazil, Guinea along with Australia. The Copper &
Diamond division has managed several operations in Canada, Mongolia, USA, and Canada.
Additionally, the company runs its non-administrated operations in Indonesia along with Chile.
On the other hand, the energy and minerals segment contains refining, mining, as well as
marketing processes through the subdivisions involving borates, pellets, titanium dioxide, iron
ore concentrate along with uranium (Reuters, 2019).
Suitability of Dividend Discount Model for Rio Tinto
Dividend discount model is considered as quantitative methodology. This method is useful to
determine the stock’s price based on assumption that current price is worth sum of
upcoming dividends while discounted again to PV. This model helps to determine FV of stock
regardless unusual marketing condition and considers dividend pay out elements along with
expected return of marketplace. In a case while value determined from DDM is less in
comparison of current stock price, in that case the stocks are overvalued. In this way, the
overvalued stocks are qualified for purchase, and vice-versa (Bask, 2019).
⊘ This is a preview!⊘
Do you want full access?
Subscribe today to unlock all pages.
Trusted by 1+ million students worldwide
REPORT 3
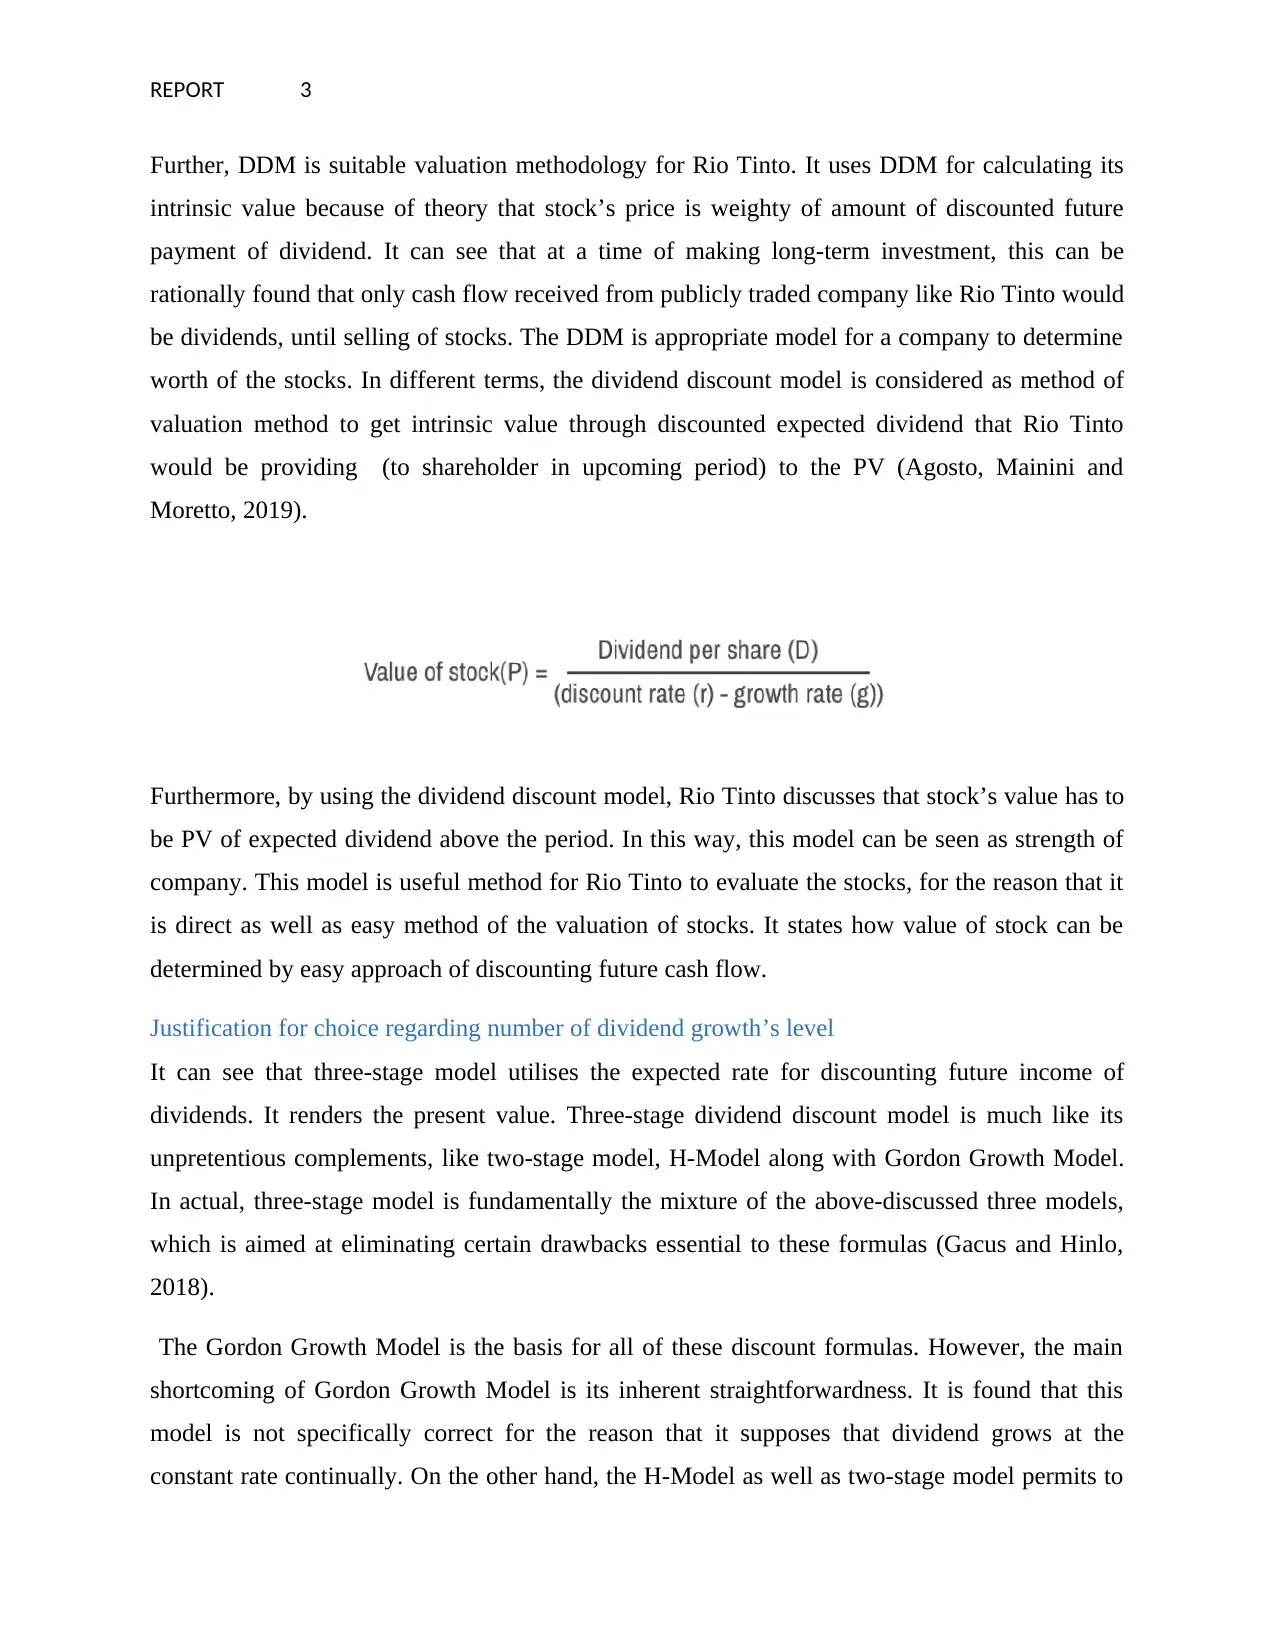
Further, DDM is suitable valuation methodology for Rio Tinto. It uses DDM for calculating its
intrinsic value because of theory that stock’s price is weighty of amount of discounted future
payment of dividend. It can see that at a time of making long-term investment, this can be
rationally found that only cash flow received from publicly traded company like Rio Tinto would
be dividends, until selling of stocks. The DDM is appropriate model for a company to determine
worth of the stocks. In different terms, the dividend discount model is considered as method of
valuation method to get intrinsic value through discounted expected dividend that Rio Tinto
would be providing (to shareholder in upcoming period) to the PV (Agosto, Mainini and
Moretto, 2019).
Furthermore, by using the dividend discount model, Rio Tinto discusses that stock’s value has to
be PV of expected dividend above the period. In this way, this model can be seen as strength of
company. This model is useful method for Rio Tinto to evaluate the stocks, for the reason that it
is direct as well as easy method of the valuation of stocks. It states how value of stock can be
determined by easy approach of discounting future cash flow.
Justification for choice regarding number of dividend growth’s level
It can see that three-stage model utilises the expected rate for discounting future income of
dividends. It renders the present value. Three-stage dividend discount model is much like its
unpretentious complements, like two-stage model, H-Model along with Gordon Growth Model.
In actual, three-stage model is fundamentally the mixture of the above-discussed three models,
which is aimed at eliminating certain drawbacks essential to these formulas (Gacus and Hinlo,
2018).
The Gordon Growth Model is the basis for all of these discount formulas. However, the main
shortcoming of Gordon Growth Model is its inherent straightforwardness. It is found that this
model is not specifically correct for the reason that it supposes that dividend grows at the
constant rate continually. On the other hand, the H-Model as well as two-stage model permits to
Paraphrase This Document
Need a fresh take? Get an instant paraphrase of this document with our AI Paraphraser
REPORT 4
change rate of dividend growth. However, only the H-Model gives permission to make
incremental modifications in place of sharp shifting from one constant rate towards other
constant rate. It can see that two-stage model is not helpful to create these incremental changes.
In this way, three-stage model includes the components of all other dividend growth models like
H model along with two stage model. In this way, the difficulty of the formula along with
several growth rates it can provide, this is most likely of other methods to state stock’s value
depended on real information of dividend (Anwar and Kumar, 2018).
Determination of growth rate of dividend -
It is believed that the company pays regular dividend under the dividend discount model. For this
reason, it is essential to determine the dividend growth rate (Annual report, 2019). It can see that
the growth rate is key input of formula using under dividend discount model. The method as well
as working of dividend growth rate is discussed below -
Method to estimate growth rate
It is important to review financial statement or results, as well as perspective of entity at period
of assessment its capability to pay future dividends (Desantes, 2020). It can say that the dividend
investors frequently review the past of enhancing dividends as the positive signal for the stocks.
The main reason is that the dividend’s reduction may be hurtful for the stock prices of company.
The organisation normally enhances the dividend only while it requires keeping high dividend
pay-out. As per this, the dividend growth rate is useful to determine the pricing of security. This
is very significant variable in the Dividend Discount Model (Yao and Kelei, 2019). This rate is
an average percentage the entity enhanced its dividend annually over the historical period.
Therefore, the strong dividend growth rate does not assure the profitable investments, however
this renders the idea of the records of accomplishment of company. An easy way to determine
dividend growth rate is to search growth rates for distributed dividend (Hatemi-J and El-Khatib,
2018). This formula may be utilised to calculate growth rate –
Dividend growth rate = D2/D1 – 1
On the other hand, in certain circumstances, like in finding growth rate in DDM, it is required to
come about the forward-looking approach to find dividend growth rate. In this situation, there are
REPORT 5
three forward-looking approaches to find dividend growth rate. These three forward-looking
dividend growth rate approaches are explained as follows –
1. Historical growth rate – with help of historical growth rate, the arithmetic average of
the rates can be calculated easily (Heatone, 2020). In addition, the company can also
utilise historical growth rate for calculating CAGR (compound annual growth rate).
2. Detect the dividend growth rate prevailing in same industry where organisation
runs – it is also a good way to take dividend growth rate of industry. Suppose that the
Average Dividend Growth Rate of industry where XYZ Company is operating at 7%. In
this way, this rate can also be used for MNL Company (Petrellies, 2019).
3. Determine sustainable growth rate – it is very easy way to determine the sustainable
growth rate. A maintainable dividend growth rate is considered as rate with the help of
which an entity may continue to develop without safeguarding the extra funds, like
lacking the extra money or providing new equities. This can see that return on equity is
measure of the profitability of corporation that considers annual return or net income of
entity divided by value of the total shareholder’s equities (Apergis and Rehman, 2018). In
addition, the return on equity conglomerates the balance sheet as well as income
statement as the net profit or net income is compared to the shareholder equity. The
sustainable dividend growth can be calculated as below –
Growth Rate = Return on equity*(1- pay-out ratio)
Working for calculation of dividend growth rate
In case of Rio Tinto, growth rate can be determined by using sustainable growth rate (Zhao and
Jin, 2018). A sustainable growth rate of Rio Tinto is calculated as follows –
(a) Dividend Growth Rate = Return on equity*(1-Dividend payout ratio)
= Return on equity*(1-Retention ratio)
= 15%*53%
= 8%
⊘ This is a preview!⊘
Do you want full access?
Subscribe today to unlock all pages.
Trusted by 1+ million students worldwide
REPORT 6
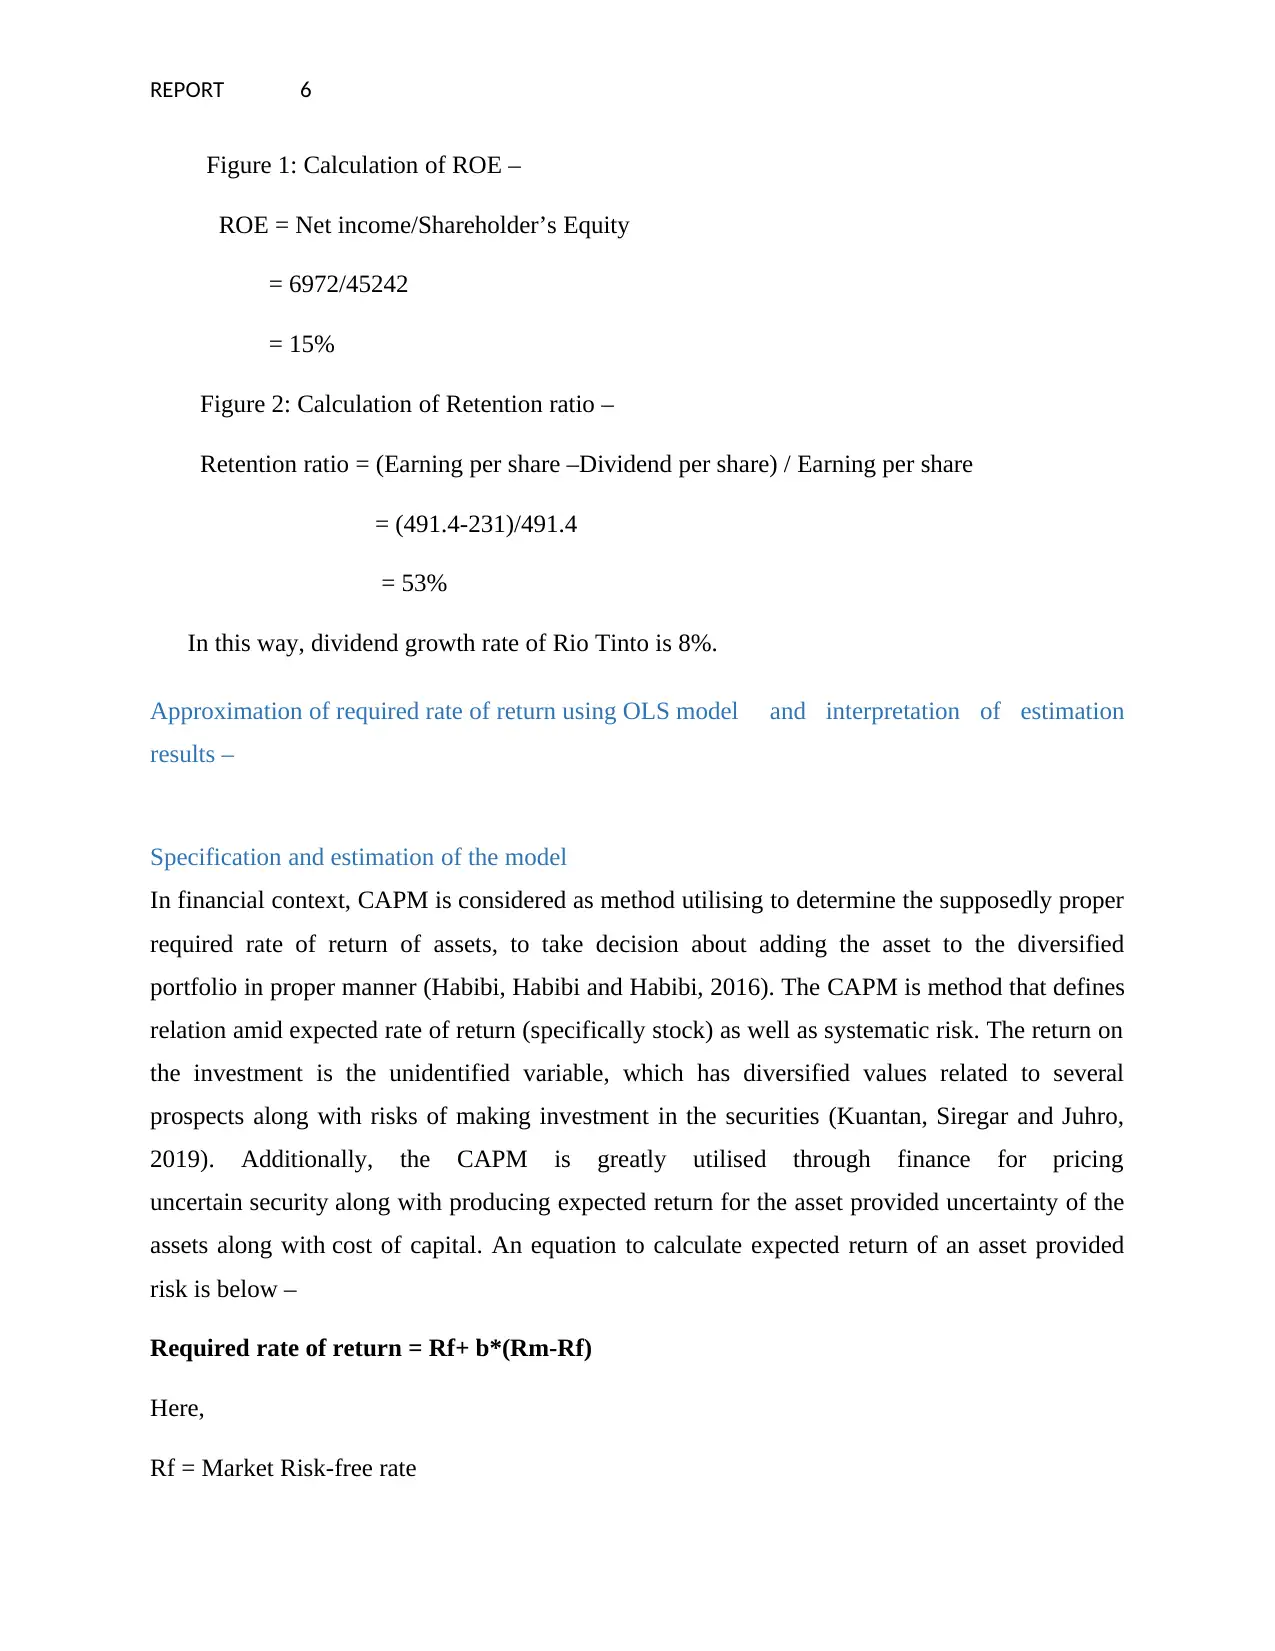
Figure 1: Calculation of ROE –
ROE = Net income/Shareholder’s Equity
= 6972/45242
= 15%
Figure 2: Calculation of Retention ratio –
Retention ratio = (Earning per share –Dividend per share) / Earning per share
= (491.4-231)/491.4
= 53%
In this way, dividend growth rate of Rio Tinto is 8%.
Approximation of required rate of return using OLS model and interpretation of estimation
results –
Specification and estimation of the model
In financial context, CAPM is considered as method utilising to determine the supposedly proper
required rate of return of assets, to take decision about adding the asset to the diversified
portfolio in proper manner (Habibi, Habibi and Habibi, 2016). The CAPM is method that defines
relation amid expected rate of return (specifically stock) as well as systematic risk. The return on
the investment is the unidentified variable, which has diversified values related to several
prospects along with risks of making investment in the securities (Kuantan, Siregar and Juhro,
2019). Additionally, the CAPM is greatly utilised through finance for pricing
uncertain security along with producing expected return for the asset provided uncertainty of the
assets along with cost of capital. An equation to calculate expected return of an asset provided
risk is below –
Required rate of return = Rf+ b*(Rm-Rf)
Here,
Rf = Market Risk-free rate
Paraphrase This Document
Need a fresh take? Get an instant paraphrase of this document with our AI Paraphraser
REPORT 7
Rm= Market rate of return
Rm-Rf = Market premium
b = Beta
An investor expects to be remunerated for risks as well as TVM. As per CAPM, a risk free rate
accounts for TVM (Sattar, 2017). The different elements of formula of capital asset pricing
model are responsible for the investors considering additional risks. In addition, the beta of
potential investment is degree of how much risk investment would be added to the portfolio that
considers as marketplace. In a case when the stocks are chancier in comparison of market, this
would contain the beta higher than 1. On the other hand, when the stocks have beta of more than
one, an equation supposes this would decrease the portfolio’s risk. Subsequently, the beta of
stock is multiplied by market risk premium. It is resulted into the return expected from
marketplace over the risk free rate. The risk free rate is added to product of beta of stock along
with market risk premium. Market Premium measures expected rate of return on investment. For
the prospective investors, the perfect scenario for the risk based investment will be higher rate of
return with possible smaller risk. There are 3 main concepts to the market premium. These are
needed market premium, historical market premium as well as expected market premium.
Market premium of United Kingdom is 5.60% (Bao and Feng, 2018).
In addition, the risk free rate states interest the investors will suppose from the risk
free investment above the particular time (Pandya, 2016). Thus, the actual risk free rate can be
evaluated by lessening present inflation rate from the Treasury bond return by matching the
investment’s term. It is clear that the risk-free interest rate is considered as rate of return of the
theoretical investment having no economic loss’s uncertainty, over the provided time. Since the
risk free rate may be attained with no any hazard, any other investment having some risk would
have to get high rate of return for inducing the investor for holding this. It can see that risk free
rate of United Kingdom is 1.51% (Yahoo finance).
Besides, the result should give the investors the discount rate or required rate of return that they
may utilise to get the asset’s value. It can say that the main aim of using the formula of CAPM or
capital asset pricing model is to make assessment whether the stocks are valued in fair term,
while the comparison is made between expected return along with time value of money (TVM).
REPORT 8
Expected return of CAPM is utilised for discounting expected dividend along with capital
increment in the stock above anticipated holding period (Bao, Diks and Li, 2018). Further, the
capital asset pricing model as well as OLS method both are same thing. In different term, OLS is
considered as same thing as a linear prediction. CAPM is a linear model to calculate proper
return of assets provided the non-diversifiable risks. OLS is actually the methodology to solve
some categories of the linear model. Therefore, the OLS may be utilised upon the capital asset
pricing model. However, this is utilised on various other models as well. It can see that capital
asset pricing model looks like simpler linear regression model (Gacus and Hinlo, 2018).
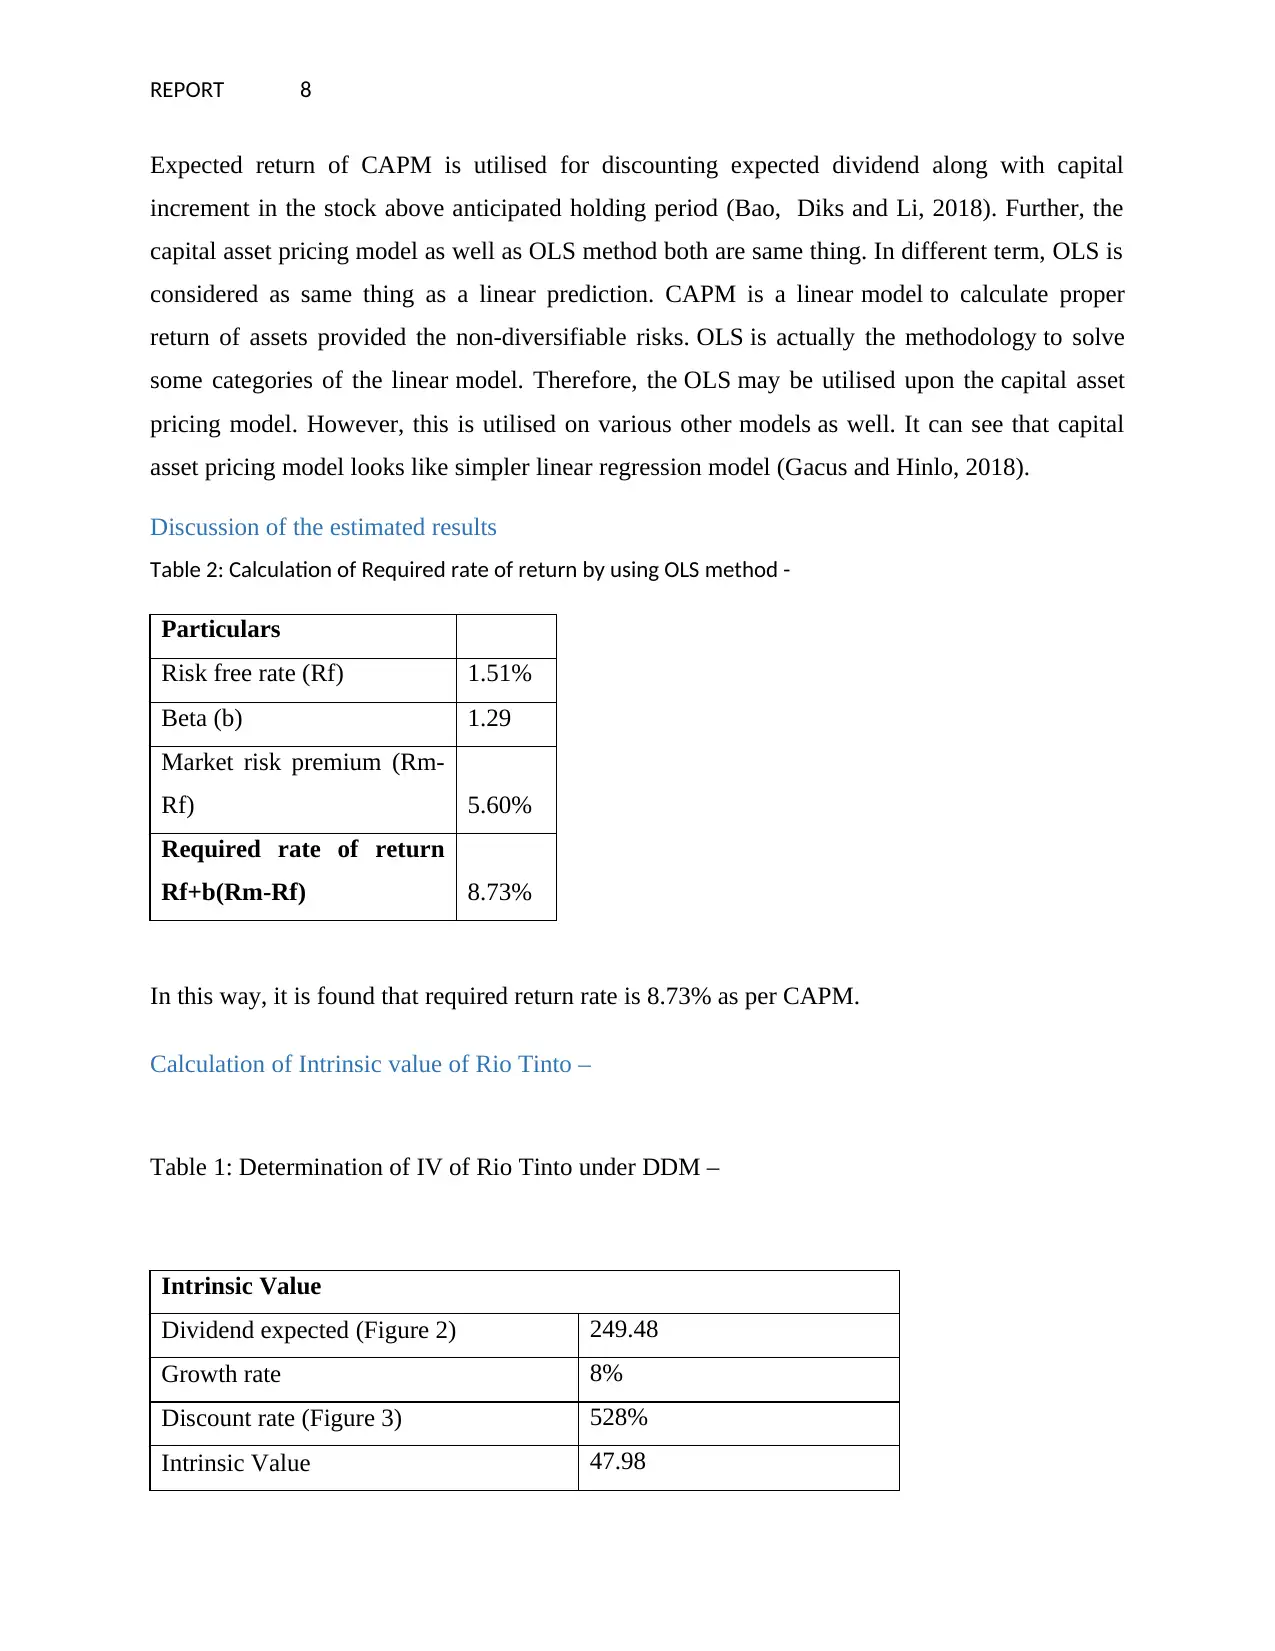
Discussion of the estimated results
Table 2: Calculation of Required rate of return by using OLS method -
Particulars
Risk free rate (Rf) 1.51%
Beta (b) 1.29
Market risk premium (Rm-
Rf) 5.60%
Required rate of return
Rf+b(Rm-Rf) 8.73%
In this way, it is found that required return rate is 8.73% as per CAPM.
Calculation of Intrinsic value of Rio Tinto –
Table 1: Determination of IV of Rio Tinto under DDM –
Intrinsic Value
Dividend expected (Figure 2) 249.48
Growth rate 8%
Discount rate (Figure 3) 528%
Intrinsic Value 47.98
Expected return of CAPM is utilised for discounting expected dividend along with capital
increment in the stock above anticipated holding period (Bao, Diks and Li, 2018). Further, the
capital asset pricing model as well as OLS method both are same thing. In different term, OLS is
considered as same thing as a linear prediction. CAPM is a linear model to calculate proper
return of assets provided the non-diversifiable risks. OLS is actually the methodology to solve
some categories of the linear model. Therefore, the OLS may be utilised upon the capital asset
pricing model. However, this is utilised on various other models as well. It can see that capital
asset pricing model looks like simpler linear regression model (Gacus and Hinlo, 2018).
Discussion of the estimated results
Table 2: Calculation of Required rate of return by using OLS method -
Particulars
Risk free rate (Rf) 1.51%
Beta (b) 1.29
Market risk premium (Rm-
Rf) 5.60%
Required rate of return
Rf+b(Rm-Rf) 8.73%
In this way, it is found that required return rate is 8.73% as per CAPM.
Calculation of Intrinsic value of Rio Tinto –
Table 1: Determination of IV of Rio Tinto under DDM –
Intrinsic Value
Dividend expected (Figure 2) 249.48
Growth rate 8%
Discount rate (Figure 3) 528%
Intrinsic Value 47.98
⊘ This is a preview!⊘
Do you want full access?
Subscribe today to unlock all pages.
Trusted by 1+ million students worldwide
REPORT 9
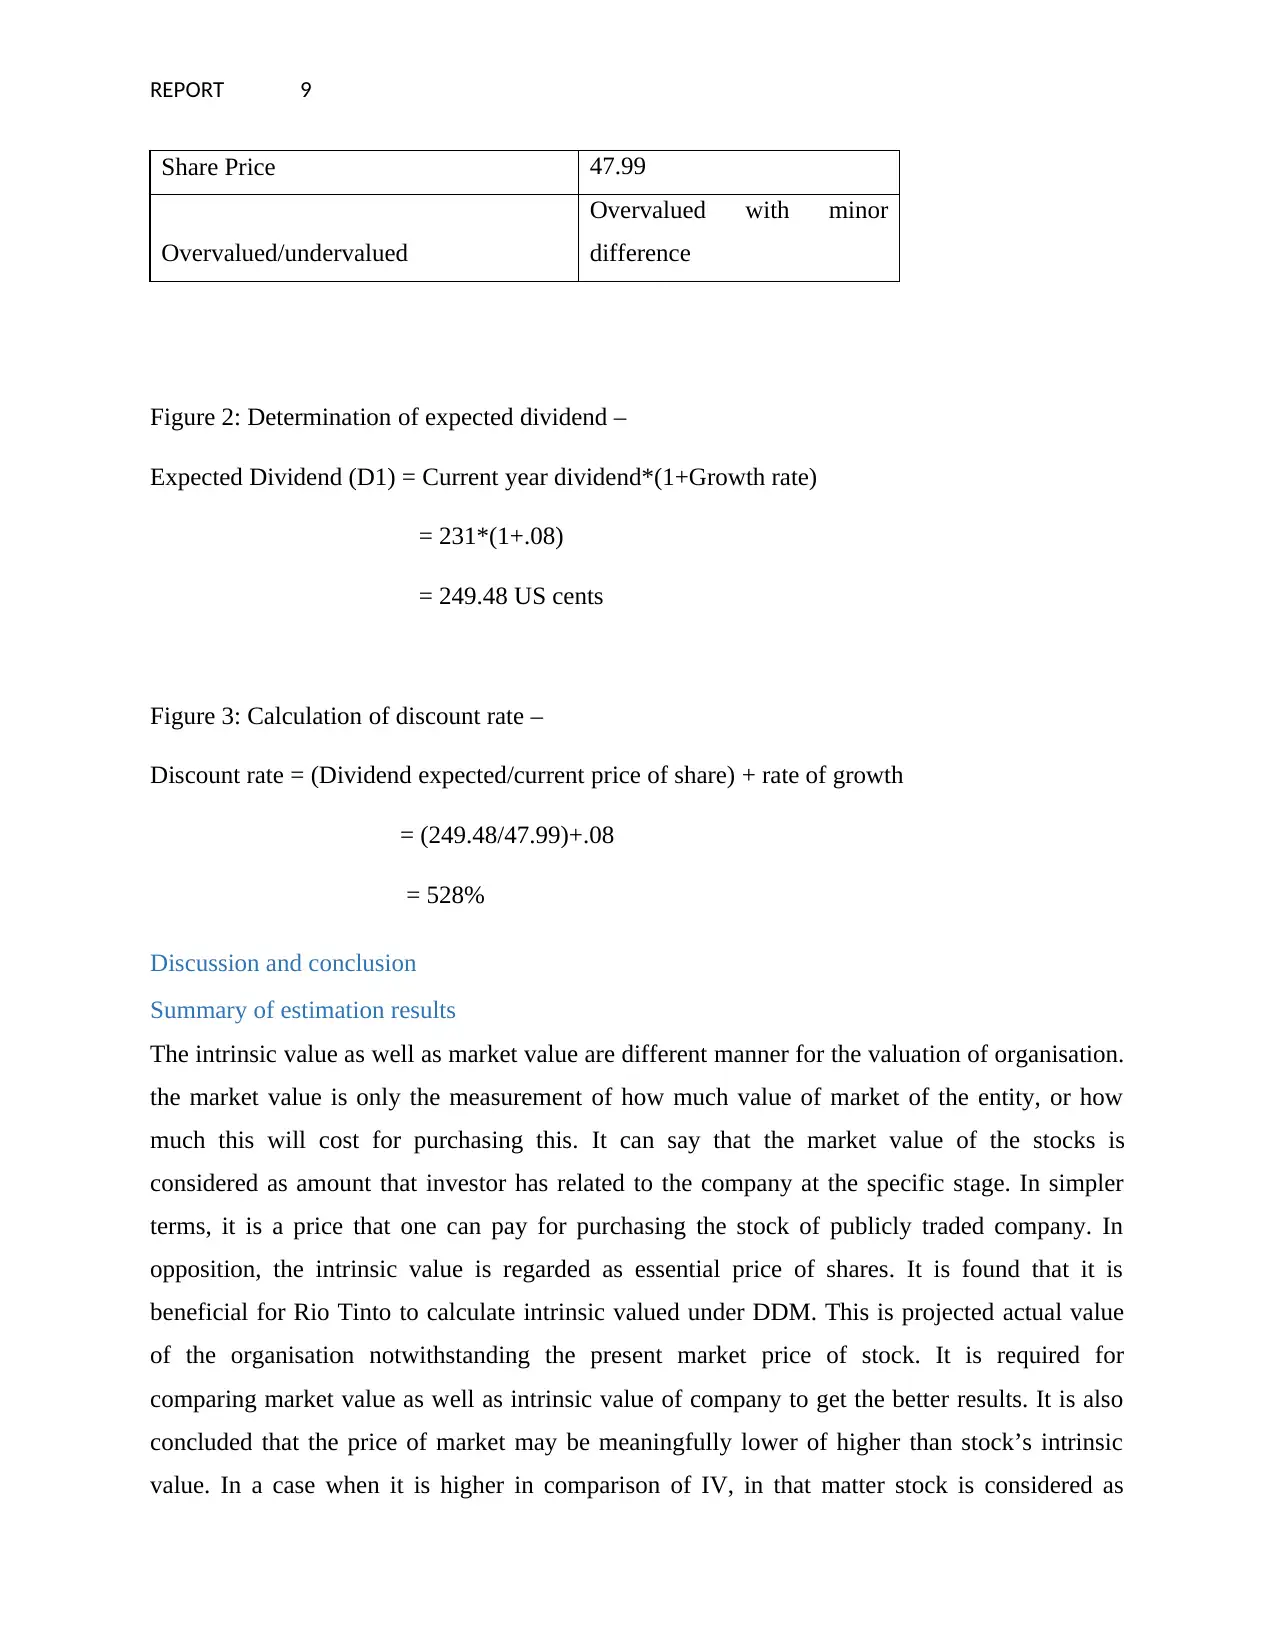
Share Price 47.99
Overvalued/undervalued
Overvalued with minor
difference
Figure 2: Determination of expected dividend –
Expected Dividend (D1) = Current year dividend*(1+Growth rate)
= 231*(1+.08)
= 249.48 US cents
Figure 3: Calculation of discount rate –
Discount rate = (Dividend expected/current price of share) + rate of growth
= (249.48/47.99)+.08
= 528%
Discussion and conclusion
Summary of estimation results
The intrinsic value as well as market value are different manner for the valuation of organisation.
the market value is only the measurement of how much value of market of the entity, or how
much this will cost for purchasing this. It can say that the market value of the stocks is
considered as amount that investor has related to the company at the specific stage. In simpler
terms, it is a price that one can pay for purchasing the stock of publicly traded company. In
opposition, the intrinsic value is regarded as essential price of shares. It is found that it is
beneficial for Rio Tinto to calculate intrinsic valued under DDM. This is projected actual value
of the organisation notwithstanding the present market price of stock. It is required for
comparing market value as well as intrinsic value of company to get the better results. It is also
concluded that the price of market may be meaningfully lower of higher than stock’s intrinsic
value. In a case when it is higher in comparison of IV, in that matter stock is considered as
Paraphrase This Document
Need a fresh take? Get an instant paraphrase of this document with our AI Paraphraser
REPORT 10
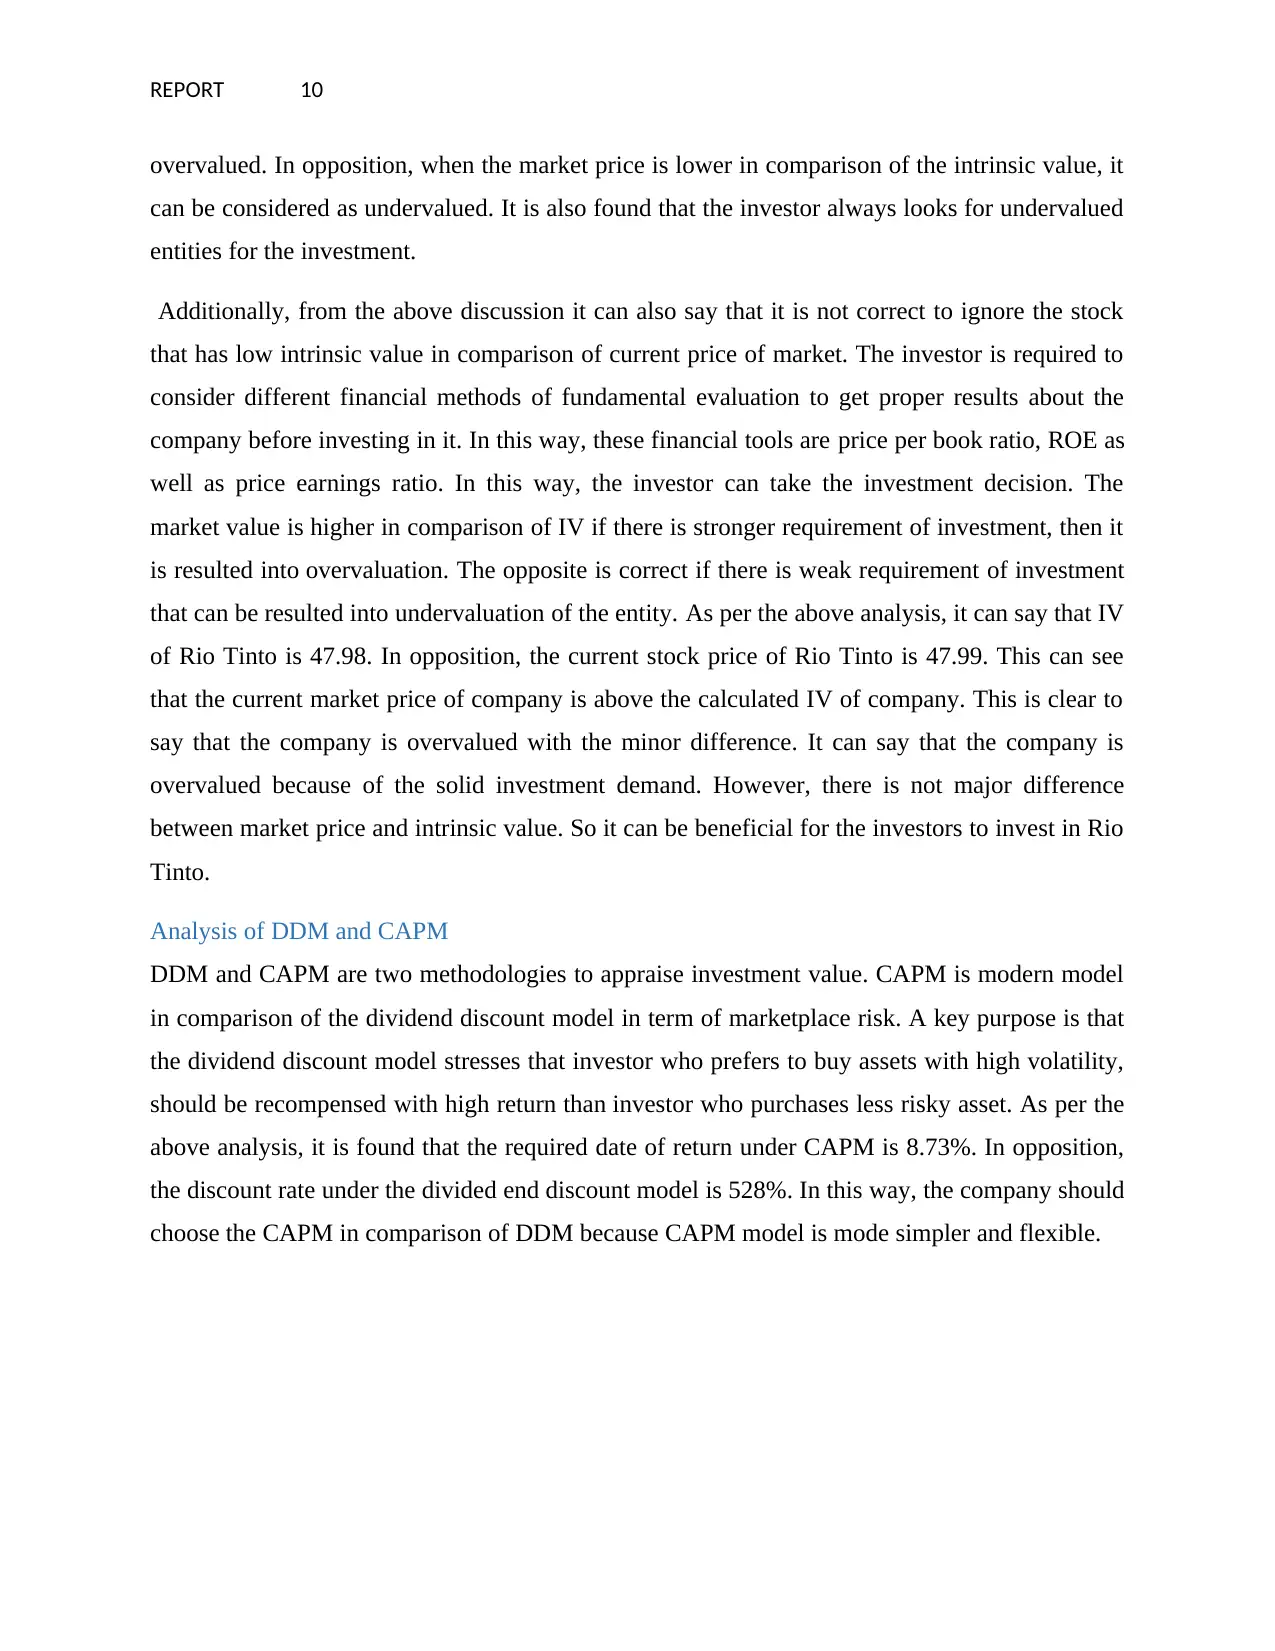
overvalued. In opposition, when the market price is lower in comparison of the intrinsic value, it
can be considered as undervalued. It is also found that the investor always looks for undervalued
entities for the investment.
Additionally, from the above discussion it can also say that it is not correct to ignore the stock
that has low intrinsic value in comparison of current price of market. The investor is required to
consider different financial methods of fundamental evaluation to get proper results about the
company before investing in it. In this way, these financial tools are price per book ratio, ROE as
well as price earnings ratio. In this way, the investor can take the investment decision. The
market value is higher in comparison of IV if there is stronger requirement of investment, then it
is resulted into overvaluation. The opposite is correct if there is weak requirement of investment
that can be resulted into undervaluation of the entity. As per the above analysis, it can say that IV
of Rio Tinto is 47.98. In opposition, the current stock price of Rio Tinto is 47.99. This can see
that the current market price of company is above the calculated IV of company. This is clear to
say that the company is overvalued with the minor difference. It can say that the company is
overvalued because of the solid investment demand. However, there is not major difference
between market price and intrinsic value. So it can be beneficial for the investors to invest in Rio
Tinto.
Analysis of DDM and CAPM
DDM and CAPM are two methodologies to appraise investment value. CAPM is modern model
in comparison of the dividend discount model in term of marketplace risk. A key purpose is that
the dividend discount model stresses that investor who prefers to buy assets with high volatility,
should be recompensed with high return than investor who purchases less risky asset. As per the
above analysis, it is found that the required date of return under CAPM is 8.73%. In opposition,
the discount rate under the divided end discount model is 528%. In this way, the company should
choose the CAPM in comparison of DDM because CAPM model is mode simpler and flexible.
REPORT 11
References
Agosto, A., Mainini, A. and Moretto, E., (2019) Stochastic dividend discount model: covariance
of random stock prices. Journal of Economics and Finance, 43(3), pp.552-568.
Annual report (2019) Rio Tinto. Available at: file:///C:/Users/System04090/Downloads/RT-
Annual-report-2019.pdf. [Access on 15/04/2019]
Anwar, M. and Kumar, S., (2018) CAPM-Empirical Evidence from the Indian Stock
Market. Indian Journal of Research in Capital Markets, 5(4), pp.38-52.
Apergis, N. and Rehman, M.U., (2018) Is CAPM a Behavioral Model? Estimating Sentiments
from Rationalism. Journal of Behavioral Finance, 19(4), pp.442-449
Bao, G. and Feng, G., (2018) Testing the Dividend Discount Model in Housing Markets: the
Role of Risk. The Journal of Real Estate Finance and Economics, 57(4), pp.677-701.
Bao, T., Diks, C. and Li, H. (2018) A generalized CAPM model with asymmetric power
distributed errors with an application to portfolio construction. Economic Modelling, 68, pp.611-
621.
Bask, M., (2019) Pure announcement and time effects in the dividend-discount model. The
Quarterly Review of Economics and Finance.
Desantes, J.M., Garcia-Oliver, J.M., Pastor, J.M. and Pandal, A., (2016) A comparison of diesel
sprays CFD modeling approaches: DDM versus Σ-Y Eulerian atomization model. Atomization
and Sprays, 26(7).
Gacus, R.B. and Hinlo, J.E., (2018) The Reliability of Constant Growth Dividend Discount
Model (DDM) in Valuation of Philippine Common Stocks. International Journal of Economics
& Management Sciences, 7.
Habibi, H., Habibi, R. and Habibi, H., (2016) Derivation of Kalman Filter Estimates Using
Bayesian Theory: Application in Time Varying Beta CAPM Model. Journal of Statistical and
Econometric Methods, 5(2), pp.1-16.
⊘ This is a preview!⊘
Do you want full access?
Subscribe today to unlock all pages.
Trusted by 1+ million students worldwide
1 out of 13
Related Documents


Your All-in-One AI-Powered Toolkit for Academic Success.
+13062052269
info@desklib.com
Available 24*7 on WhatsApp / Email
![[object Object]](/_next/static/media/star-bottom.7253800d.svg)
Unlock your academic potential
Copyright © 2020–2026 A2Z Services. All Rights Reserved. Developed and managed by ZUCOL.