Quantitative Research Report: Social Factors & Gym Attendance Patterns
VerifiedAdded on 2023/06/11
|46
|7236
|69
Report
AI Summary
This study employs quantitative research methods to investigate the factors influencing gym attendance, with a focus on age and gender. Data collected from a sample of 20 individuals was analyzed using SPSS. The findings reveal that younger individuals are more likely to attend the gym regularly, driven by a desire to stay fit and healthy. The study also explores the impact of gym attendance on achieving fitness goals and the likelihood of recommending gym attendance to others. Cross-tabulation analysis indicates a significant association between age and gym attendance frequency. The report concludes that age is a key factor influencing gym habits, highlighting the importance of considering demographic factors in promoting physical activity and well-being. Desklib provides access to similar research papers and study tools for students.
Quantitative research
methods for social scientists
methods for social scientists
Paraphrase This Document
Need a fresh take? Get an instant paraphrase of this document with our AI Paraphraser
ABSTRACT
The present study is based on the topic that how much people prefer to go to gym and
what factors affect their going. This is very important to be analysed because of the reason that
when the person is fit then they will be living a healthy life. Hence, for staying fit person need to
go to gym and this improves their standard of living as well. The current study included the
quantitative analysis and for this SPSS was used and the collected data was analysed by using
this tool only. Further the finding outlined that the participant included 50 % of male and 50 %
of female. Also it was analysed that majority of the young people is included and they prefer to
go to gym on daily basis. In the end it can be stated that age is the factor which affects the
attitude and perception of the person for going to gym.
TABLE OF CONTENTS
INTRODUCTION...........................................................................................................................4
Background of the study.............................................................................................................4
Rationale.....................................................................................................................................4
Research questions......................................................................................................................4
Research objectives and Aim......................................................................................................4
METHODOLOGY..........................................................................................................................6
Methods used for the rationale....................................................................................................6
Sampling.....................................................................................................................................6
Research procedure.....................................................................................................................7
Ethical consideration...................................................................................................................7
Reflexivity...................................................................................................................................7
FINDINGS.......................................................................................................................................7
Descriptive statistics...................................................................................................................7
Cross tabulation...........................................................................................................................8
DISCUSSION..................................................................................................................................8
CONCLUSION................................................................................................................................9
REFERENCES..............................................................................................................................10
APPENDIX 1.................................................................................................................................11
APPENDIX 2.................................................................................................................................22
APPENDIX 3.................................................................................................................................44
APPENDIX 4.................................................................................................................................46
⊘ This is a preview!⊘
Do you want full access?
Subscribe today to unlock all pages.
Trusted by 1+ million students worldwide
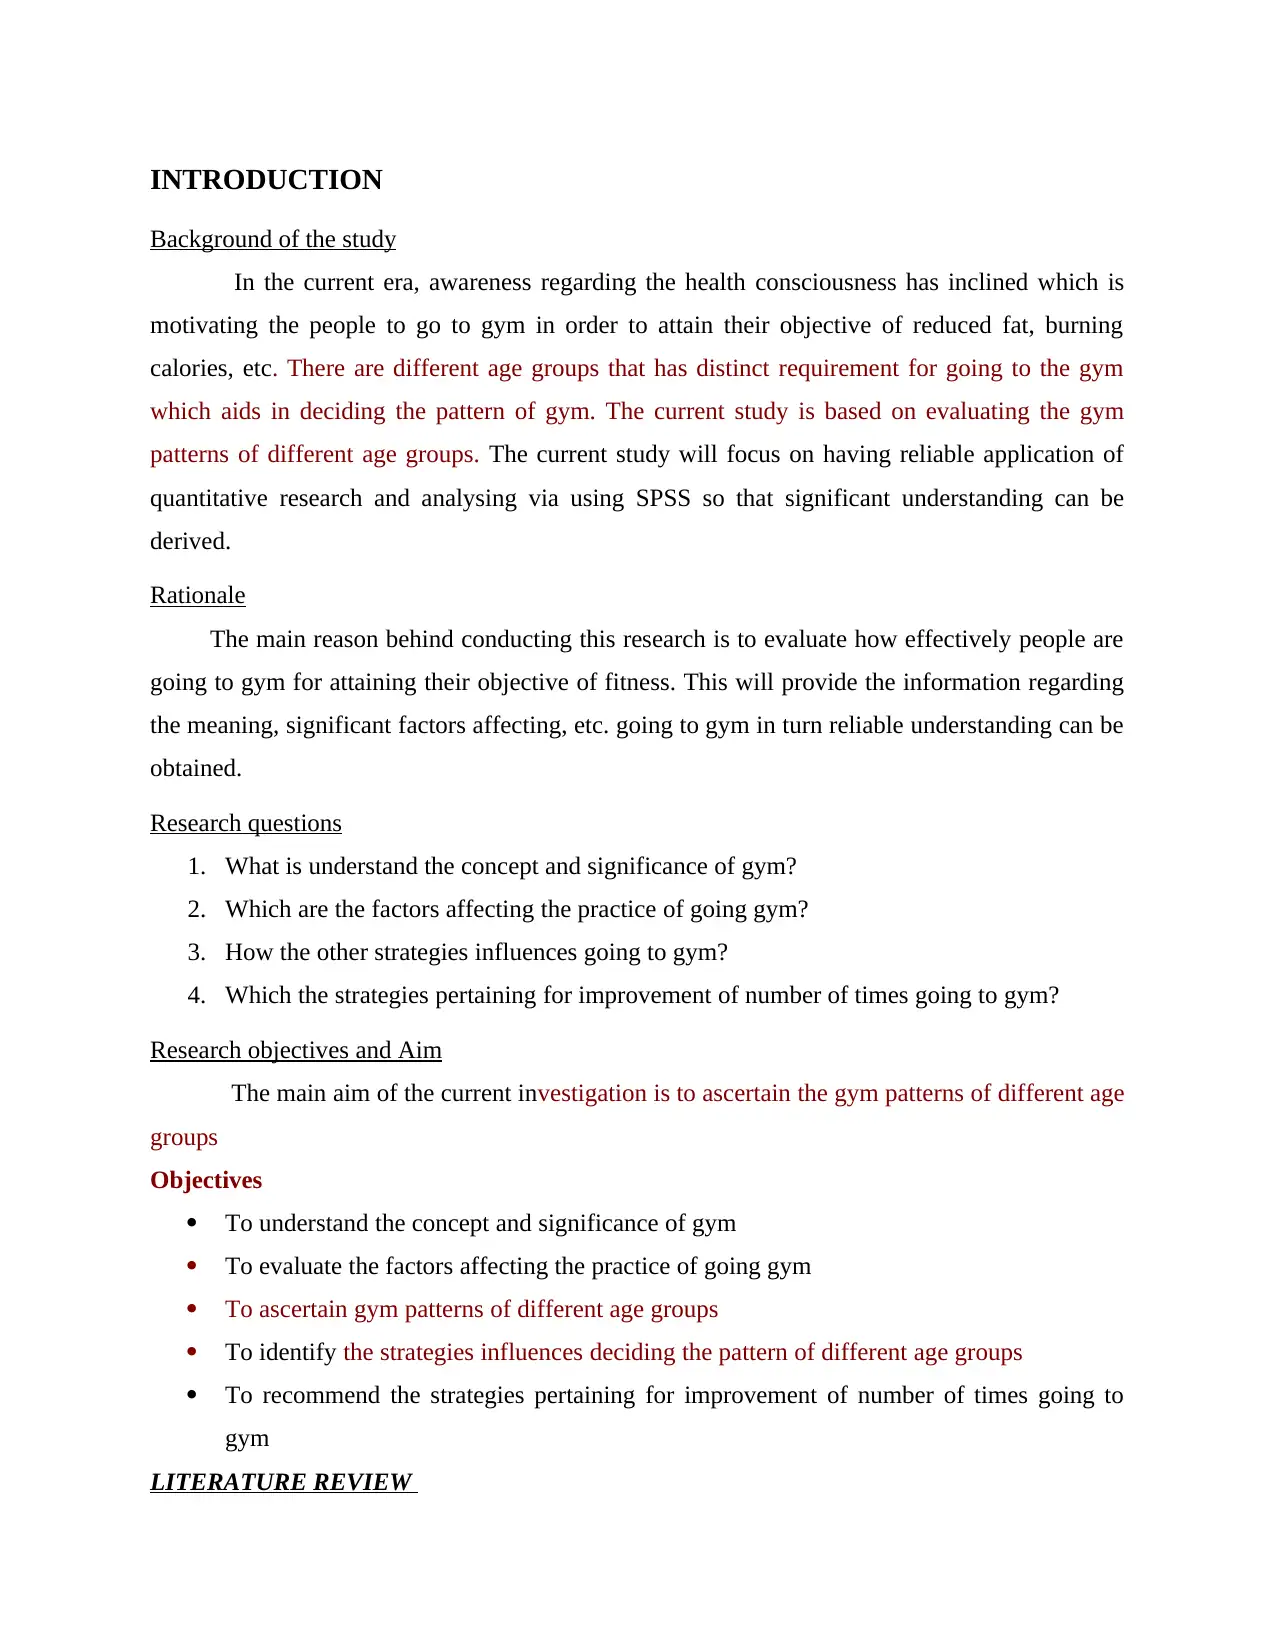
INTRODUCTION
Background of the study
In the current era, awareness regarding the health consciousness has inclined which is
motivating the people to go to gym in order to attain their objective of reduced fat, burning
calories, etc. There are different age groups that has distinct requirement for going to the gym
which aids in deciding the pattern of gym. The current study is based on evaluating the gym
patterns of different age groups. The current study will focus on having reliable application of
quantitative research and analysing via using SPSS so that significant understanding can be
derived.
Rationale
The main reason behind conducting this research is to evaluate how effectively people are
going to gym for attaining their objective of fitness. This will provide the information regarding
the meaning, significant factors affecting, etc. going to gym in turn reliable understanding can be
obtained.
Research questions
1. What is understand the concept and significance of gym?
2. Which are the factors affecting the practice of going gym?
3. How the other strategies influences going to gym?
4. Which the strategies pertaining for improvement of number of times going to gym?
Research objectives and Aim
The main aim of the current investigation is to ascertain the gym patterns of different age
groups
Objectives
To understand the concept and significance of gym
To evaluate the factors affecting the practice of going gym
To ascertain gym patterns of different age groups
To identify the strategies influences deciding the pattern of different age groups
To recommend the strategies pertaining for improvement of number of times going to
gym
LITERATURE REVIEW
Paraphrase This Document
Need a fresh take? Get an instant paraphrase of this document with our AI Paraphraser
According to Jansson, and et,.al., (2019) Gym is basically the place which is filled with
various tools that allow the people to exercise. There are different kinds of the objective which
are accomplished by people through such as losing weights, etc. in order to be successful in the
current environment having significant working out practices are crucial in order to gain greater
positive physical health. In against to this, Erickson and et.al., (2020) depicted that gym is the
area which promotes the health conscious via permitting people to get the significant ability to
control their physical and mental actions. For gaining the benefit of gym such as strengthening
training, balancing life, flexibility in actions, etc. number of times people go to gym.
In the views of Coopoo, McCreanor and Gabriels (2020) there are distinct form of the
factors that influences the action regarding gaining to gym which includes motivation,
perception, time and resource availability. These all tend to influence that person will go to gym
or not. On the other side, Baas and Cayla (2020) articulated that the person get affected from in
order to the gym that involves job stress, sleep, diet balance, family obligation, work capacity,
age impact, etc. These are the crucial factors that tend to be emphasized by the individual before
taking the decision of going to gym. From the evaluation it can be specified that there are
number of the factors which are basically taken into the consideration by person for deciding to
go o gym.
In the views of Turnock (2021) age group is one of the crucial factor that has the impact
on the practices of the gym. Each age group has the distinct objective of going to the gym which
aids hem to evaluate the crucial pattern which is required to be followed. It is specified that there
is different form of the practices which are followed by the organizations offering services of
gym so that attaining the objective of the people according to the age group can be identified.
This involves endurance, strengths, balance and flexibility. It is highly depended on the
particular age group that which form of the gym pattern they are choosing.
On the other side, Jansson and et.al., (2019) depicted that age is not the crucial factor, it is
highly dependent on the particular form of objective made by the person. The objective &
motivation level of individual helps the person to decide that which pattern of gym such as
balance, flexibility, endurance and strength is needed to be followed. For doing gyming the one
of the crucial objective that is identified is having the significant level of motivation in turn
significant working practices having regarding the gym is decided. For being physically fit there
are various availabilities of pattern of gym that is required to be followed in turn having the
effective accomplishing the objective can become possible. The motivation is derived to
overcome the other factors than age that involves stress, sleep, diet balance, family obligation,
etc. on the basis of this it can be specified that there are various objectives of person which is
needed to be fulfilled for accomplishing the goal of being fit.
According to Turnoc (2021) there are various aspects which are highly emphasized by
the individual that includes is the prevailing ethnicity. There are different kinds of the ethnicity
which has the major influence in the functioning of the gym going people that decides their
physical appearance in turn attaining the objective of achieving good outcome. This can be
mentioned that there are various other patterns of ways which are taken into consideration to get
results of fitness. In contrast to this, Gonzales and et.al., (2021) stated that fees of gym,
behaviour of trainer, impact on body, accomplishment of goal, etc. are the factors that has
influence on the decision-making procedure. This refers to that person tend to get affected from
the number of aspects in turn accomplishing the object of being fit in desirable manner via
getting corrective directions.
In the views of Tavares and et.al., (2022) there are distinct form of the strategies which
are taken by person for ensuring that reliable level of results to get the major outcomes. This
involves gaining interest in fitness, having objective of progression promoting goo balance life,
etc. on the others side, Suyundikovich (2022) said that agility, coordination, exercise tolerance
and psychological factor, etc. play crucial role in decision-making procedure of number of times
going to gym.
METHODOLOGY
Methods used for the rationale
There are two types of the research methods such as qualitative and quantitative. For the
current investigation there is utilization of quantitative method in which SPSS technique for
having the ability to gather, collect and evaluate data effectively.
Sampling
Simple random technique for collecting the responses from the 20 persons. This has
helped in gathering data without having gender biasness.
⊘ This is a preview!⊘
Do you want full access?
Subscribe today to unlock all pages.
Trusted by 1+ million students worldwide
Research procedure
Deductive approach in which focus is provided on having theory then hypothesis,
observation and confirmation so that significant procedure in this manner has been carried. In
addition to this, positivism philosophy is concerned with focusing on scientific testing of
hypothesis & finding logical proof.
Ethical consideration
In order to get the research completion in effective manner it is important for the
researcher to focus on taking consent from respondents which are taken. There is utilization of
copy right sources and articles and journals published after 2016 so that reliability & validity can
be maintained.
Reflexivity
In the particular project data analysis part has been done by me in order to get evaluate
the data in effective manner. In addition to this, it can be specified that I have given focus on
findings to crucial aspects which helps in proofing hypothesis.
FINDINGS
Descriptive statistics
Attached in appendix
With the analysis of the descriptive statistics it is clear that on an average the age group
to which most people belong is the young that is between 0- 35. Further the most common
gender present in the dataset is male. Also with the analysis it is clear that the most common
ethnicity to which people belong is white. Moreover, the majority of the people daily goes to
gym in order to keep themselves healthy and safe (Zou, Lloyd and Baumbusch, 2020). also,
when asked about attaining the health goals it was evaluated that most of the people have
reached to their goal and this has benefitted them to a great extent. Along with this at time of
recommending to others majority of people stated that they will recommend going to gym to
other people. Further with help of table 2 it is clear that 55 % of population is young and the
remaining 25 % is middle aged and 20 % is old. Further the table 3 outlined that on the basis of
gender both male and female are equal that is 50 % male and remaining 50 % female. Moreover,
the table 6 outlined that 45 % of the population prefers to go to gym on daily basis.
Paraphrase This Document
Need a fresh take? Get an instant paraphrase of this document with our AI Paraphraser
Cross tabulation
Attached in appendix
H0- There is not any significant difference being present in going to gym on the basis of age and
gender.
H1- There is a significant difference being present within going to gym and age and gender of
the person.
Further on the basis of table 18 and 19 it is clear that the majority of the people prefer to
go to gym. This is particularly because of the reason that majority of the people who like to go to
gym is the young people. The reason underlying this fact is that young people are very energetic
and also wants to stay fit and healthy. Hence, for this they prefer to go to gym and this improves
their health and fitness. Along with this table 36 and 37 it is clear that the most of the people
have attained their fitness goal on the basis of the age. This is pertaining to the fact that mostly
young people are very energetic and they tend to work hard and for this they work really hard
and they try to attain their fitness goals at any cost. In addition to this, another table 49 and 50
highlights the fact that majority of people on the basis of age states that they will recommend to
others people that they must go to gym. This is because of the reason that going to gym will help
the person to be better and maintain their personal well- being in better manner.
DISCUSSION
It is found that number of times going to gym is dependent on the age group not on the
gender, it is evaluated that younger age possessing people are tending to go more times to gym
and older people as compared to this go less time. This can be validated by referring to _ that
there are different kinds of the people who have distinct objective and lifestyle. Younger people
are more enthusiastic and have greater physical potential which motivates them to visit the gym.
In the gym there is higher level of focus is provided by young people in respect to get greater
attractive physical appearance. Old people on the other side tend focus on having just aim of
gaining greater preference to accomplish healthy life for which they visit lower time. Other
reason is that gender biasness that female or male does not decide the number of visiting to the
gym.
On the basis of the provided information it can be specified that there are different types
of the objectives for being healthy which does not depend on the basis of gender. This tends to
give emphasis on the age group which decides how many times people go to gym and not the
gender.
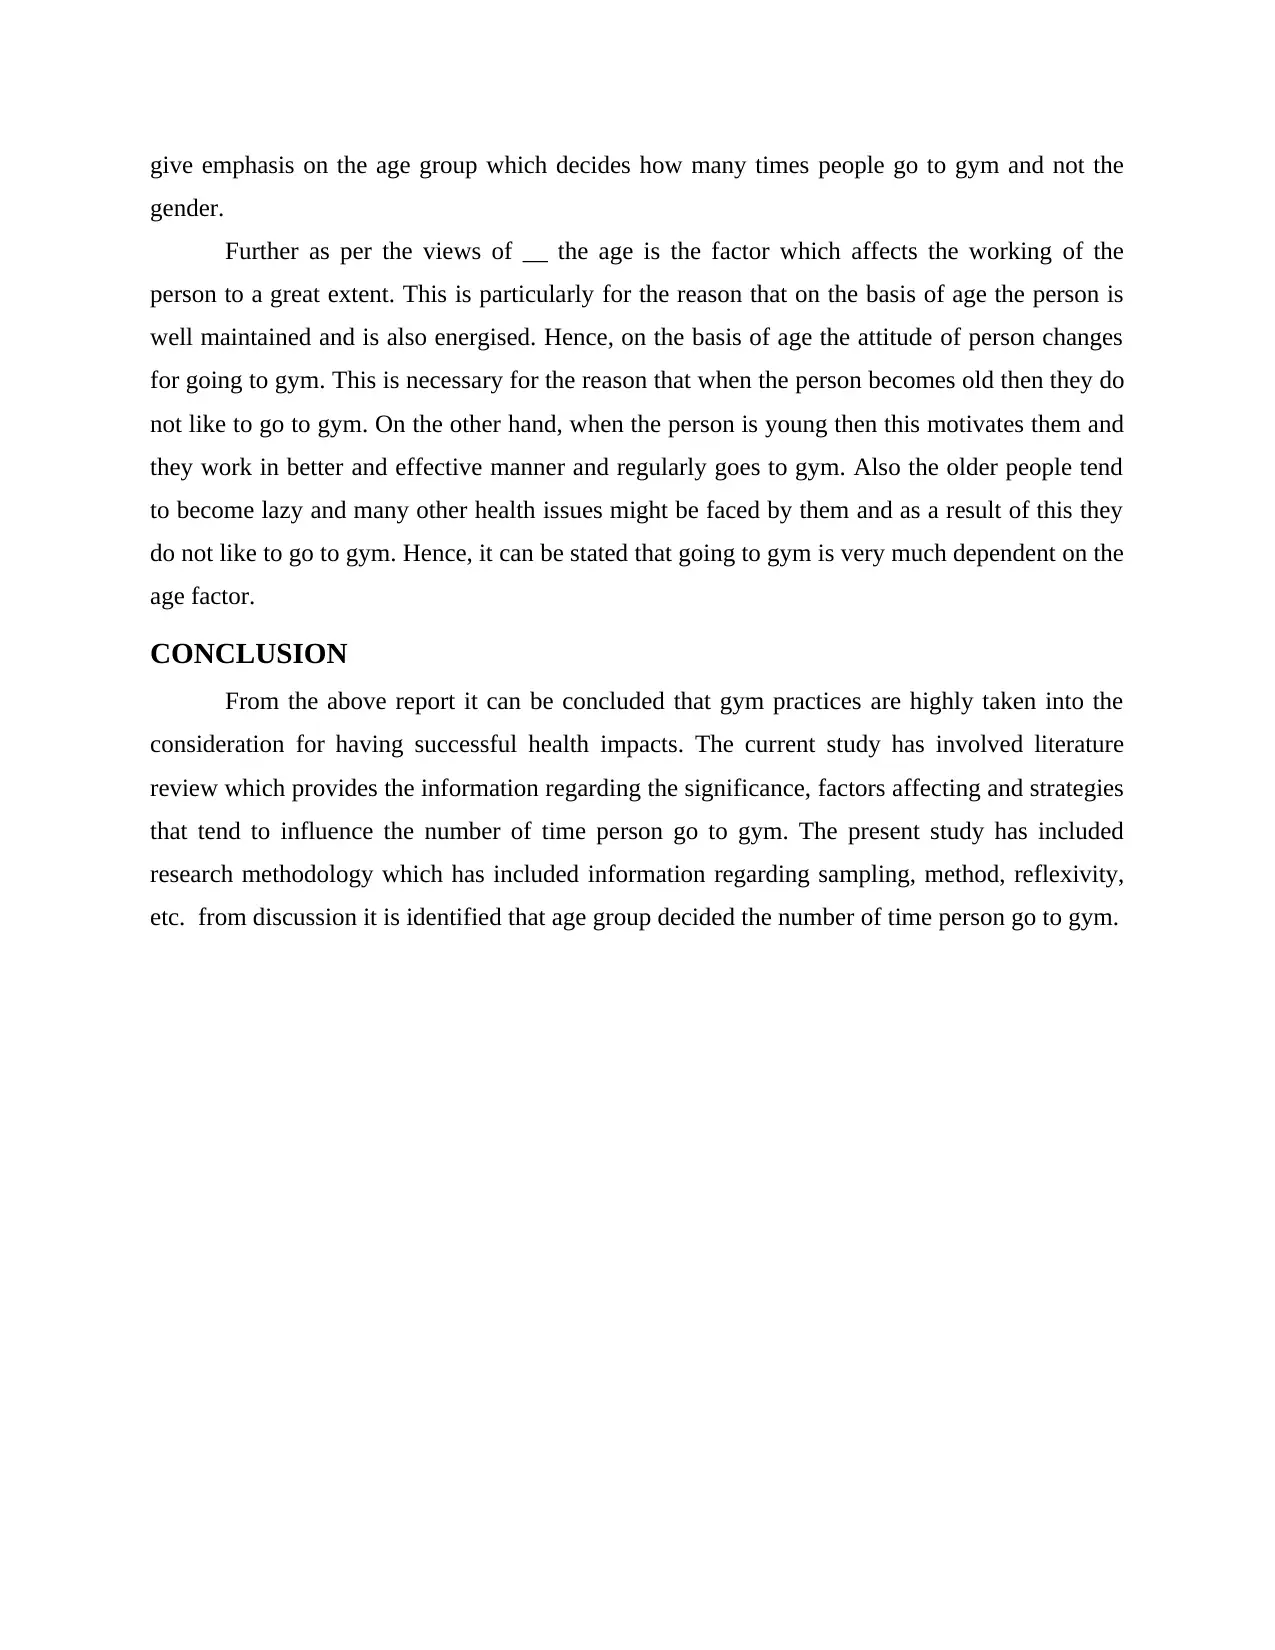
Further as per the views of __ the age is the factor which affects the working of the
person to a great extent. This is particularly for the reason that on the basis of age the person is
well maintained and is also energised. Hence, on the basis of age the attitude of person changes
for going to gym. This is necessary for the reason that when the person becomes old then they do
not like to go to gym. On the other hand, when the person is young then this motivates them and
they work in better and effective manner and regularly goes to gym. Also the older people tend
to become lazy and many other health issues might be faced by them and as a result of this they
do not like to go to gym. Hence, it can be stated that going to gym is very much dependent on the
age factor.
CONCLUSION
From the above report it can be concluded that gym practices are highly taken into the
consideration for having successful health impacts. The current study has involved literature
review which provides the information regarding the significance, factors affecting and strategies
that tend to influence the number of time person go to gym. The present study has included
research methodology which has included information regarding sampling, method, reflexivity,
etc. from discussion it is identified that age group decided the number of time person go to gym.
gender.
Further as per the views of __ the age is the factor which affects the working of the
person to a great extent. This is particularly for the reason that on the basis of age the person is
well maintained and is also energised. Hence, on the basis of age the attitude of person changes
for going to gym. This is necessary for the reason that when the person becomes old then they do
not like to go to gym. On the other hand, when the person is young then this motivates them and
they work in better and effective manner and regularly goes to gym. Also the older people tend
to become lazy and many other health issues might be faced by them and as a result of this they
do not like to go to gym. Hence, it can be stated that going to gym is very much dependent on the
age factor.
CONCLUSION
From the above report it can be concluded that gym practices are highly taken into the
consideration for having successful health impacts. The current study has involved literature
review which provides the information regarding the significance, factors affecting and strategies
that tend to influence the number of time person go to gym. The present study has included
research methodology which has included information regarding sampling, method, reflexivity,
etc. from discussion it is identified that age group decided the number of time person go to gym.
⊘ This is a preview!⊘
Do you want full access?
Subscribe today to unlock all pages.
Trusted by 1+ million students worldwide
REFERENCES
Books and Journals
Baas, M. and Cayla, J., 2020. Recognition in India’s new service professions: gym trainers and
coffee baristas. Consumption Markets & Culture. 23(3). pp.223-240.
Coopoo, Y., McCreanor, X. and Gabriels, G., 2020. Nutritional supplements use, cost, source of
information, and practices by Johannesburg North gym goers. South African Journal of
Sports Medicine. 32(1).
Erickson, Z and et.al., 2020, May. Assistive gym: A physics simulation framework for assistive
robotics. In 2020 IEEE International Conference on Robotics and Automation (ICRA) (pp.
10169-10176). IEEE.
Gonzales, L.J. And et.al., 2021. Coping Mechanisms among Fitness Gym-Goers in the
Municipalities of Buenavista and Nasipit Agusan del Norte. SMCC Higher Education
Research Journal (Teacher Education Journal). 3(1). pp.1-1.
Jansson, A.K and et,.al., 2019. A systematic review of outdoor gym use: Current evidence and
future directions. Journal of science and medicine in sport. 22(12). pp.1335-1343.
Suyundikovich, B.A., 2022, April. THE IMPORTANCE OF PHYSICAL EXERCISE IN
PROFESSIONAL SPORTS. In Conference Zone (pp. 39-40).
Tavares, A.S.R and et.al., 2022. Characteristics of gym-goers performance-enhancing substance
use. Sustainability, 14(5), p.2868.
Turnock, L.A., 2021. Rural gym spaces and masculine physical cultures in an ‘age of change’:
Rurality, masculinity, inequalities and harm in ‘the gym’. Journal of Rural Studies, 86,
pp.106-116.
Whittier, N., Wildhagen, T. and Gold, H.J., 2019. Statistics for social understanding: With stata
and SPSS. Rowman & Littlefield.
Zou, D., Lloyd, J.E. and Baumbusch, J.L., 2020. Using SPSS to analyze complex survey data: a
primer. Journal of Modern Applied Statistical Methods, 18(1), p.16.
Jansson, A. K and et.al., 2019. A systematic review of outdoor gym use: Current evidence and
future directions. Journal of science and medicine in sport, 22(12), pp.1335-1343.
Turnock, L.A., 2021. Rural gym spaces and masculine physical cultures in an ‘age of change’:
Rurality, masculinity, inequalities and harm in ‘the gym’. Journal of Rural Studies, 86,
pp.106-116.
Paraphrase This Document
Need a fresh take? Get an instant paraphrase of this document with our AI Paraphraser
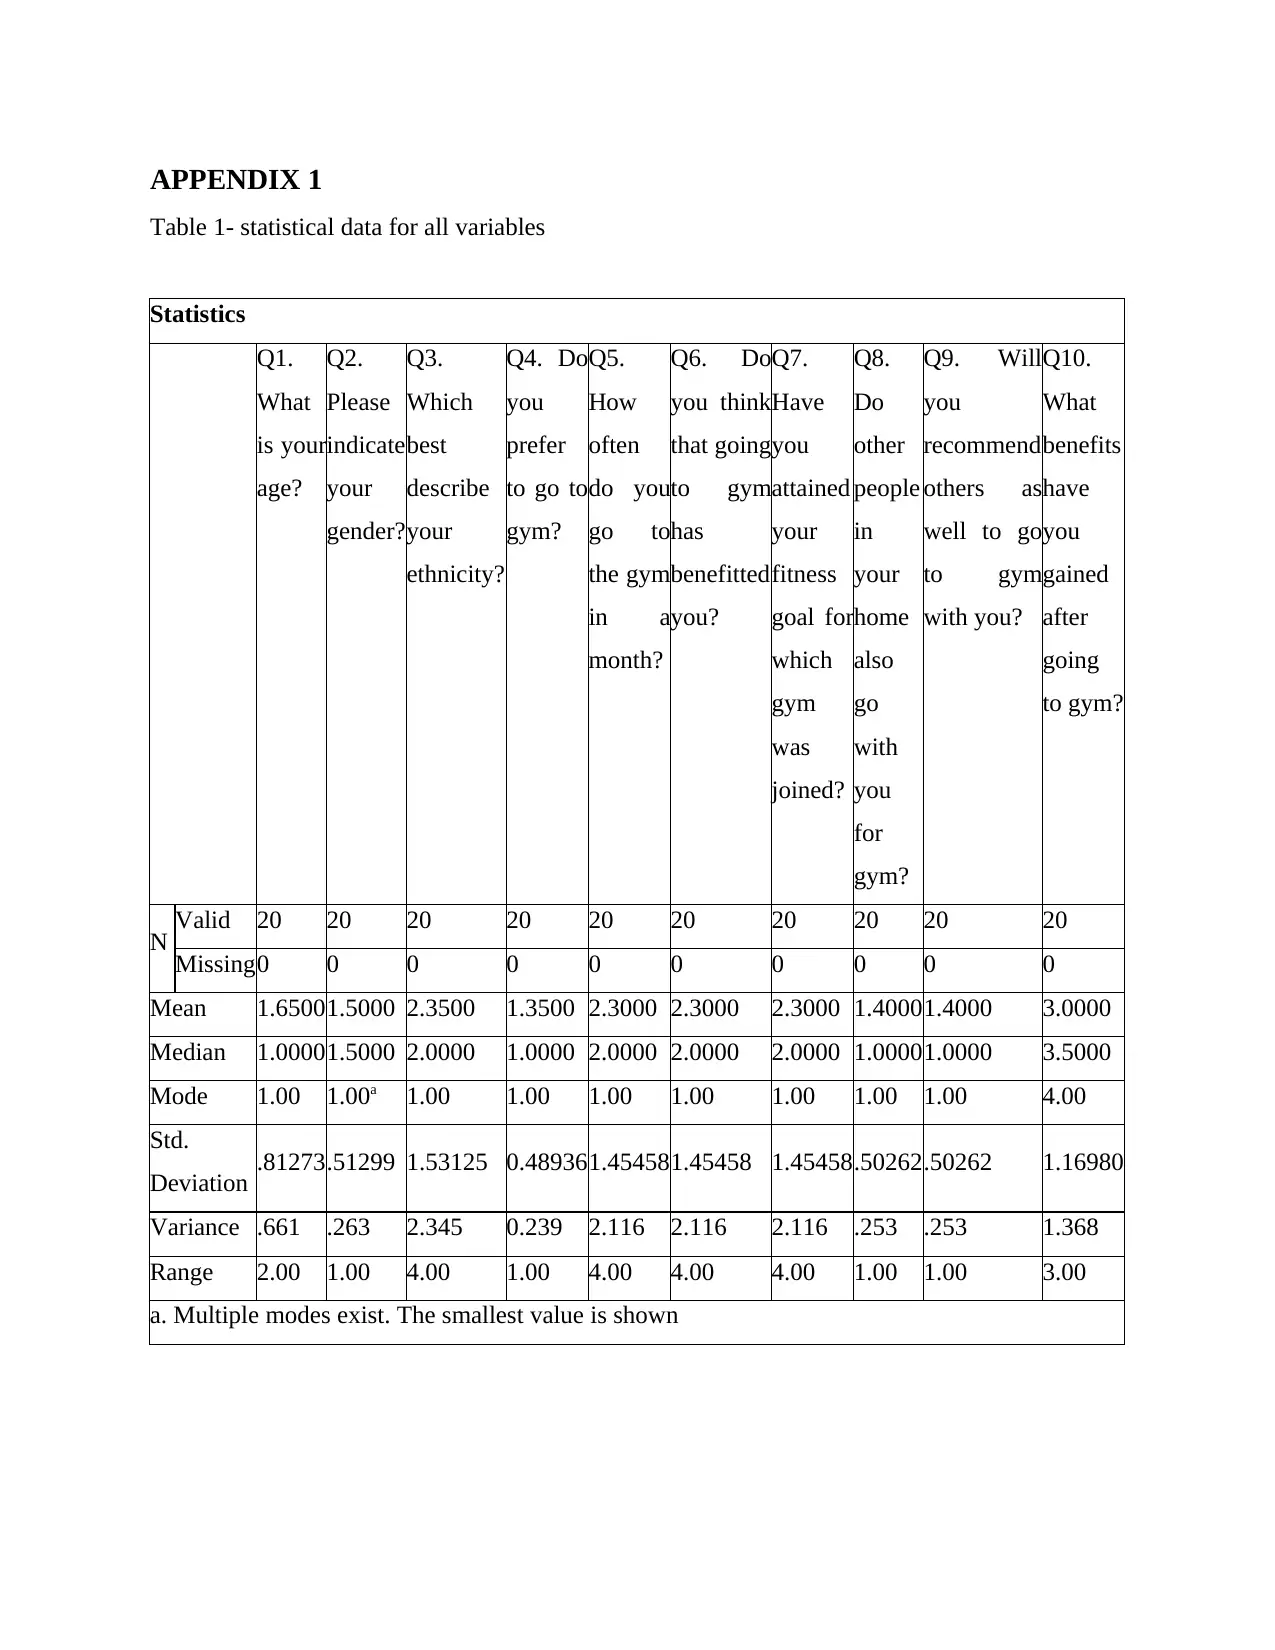
APPENDIX 1
Table 1- statistical data for all variables
Statistics
Q1.
What
is your
age?
Q2.
Please
indicate
your
gender?
Q3.
Which
best
describe
your
ethnicity?
Q4. Do
you
prefer
to go to
gym?
Q5.
How
often
do you
go to
the gym
in a
month?
Q6. Do
you think
that going
to gym
has
benefitted
you?
Q7.
Have
you
attained
your
fitness
goal for
which
gym
was
joined?
Q8.
Do
other
people
in
your
home
also
go
with
you
for
gym?
Q9. Will
you
recommend
others as
well to go
to gym
with you?
Q10.
What
benefits
have
you
gained
after
going
to gym?
N Valid 20 20 20 20 20 20 20 20 20 20
Missing0 0 0 0 0 0 0 0 0 0
Mean 1.65001.5000 2.3500 1.3500 2.3000 2.3000 2.3000 1.40001.4000 3.0000
Median 1.00001.5000 2.0000 1.0000 2.0000 2.0000 2.0000 1.00001.0000 3.5000
Mode 1.00 1.00a 1.00 1.00 1.00 1.00 1.00 1.00 1.00 4.00
Std.
Deviation .81273.51299 1.53125 0.489361.454581.45458 1.45458.50262.50262 1.16980
Variance .661 .263 2.345 0.239 2.116 2.116 2.116 .253 .253 1.368
Range 2.00 1.00 4.00 1.00 4.00 4.00 4.00 1.00 1.00 3.00
a. Multiple modes exist. The smallest value is shown
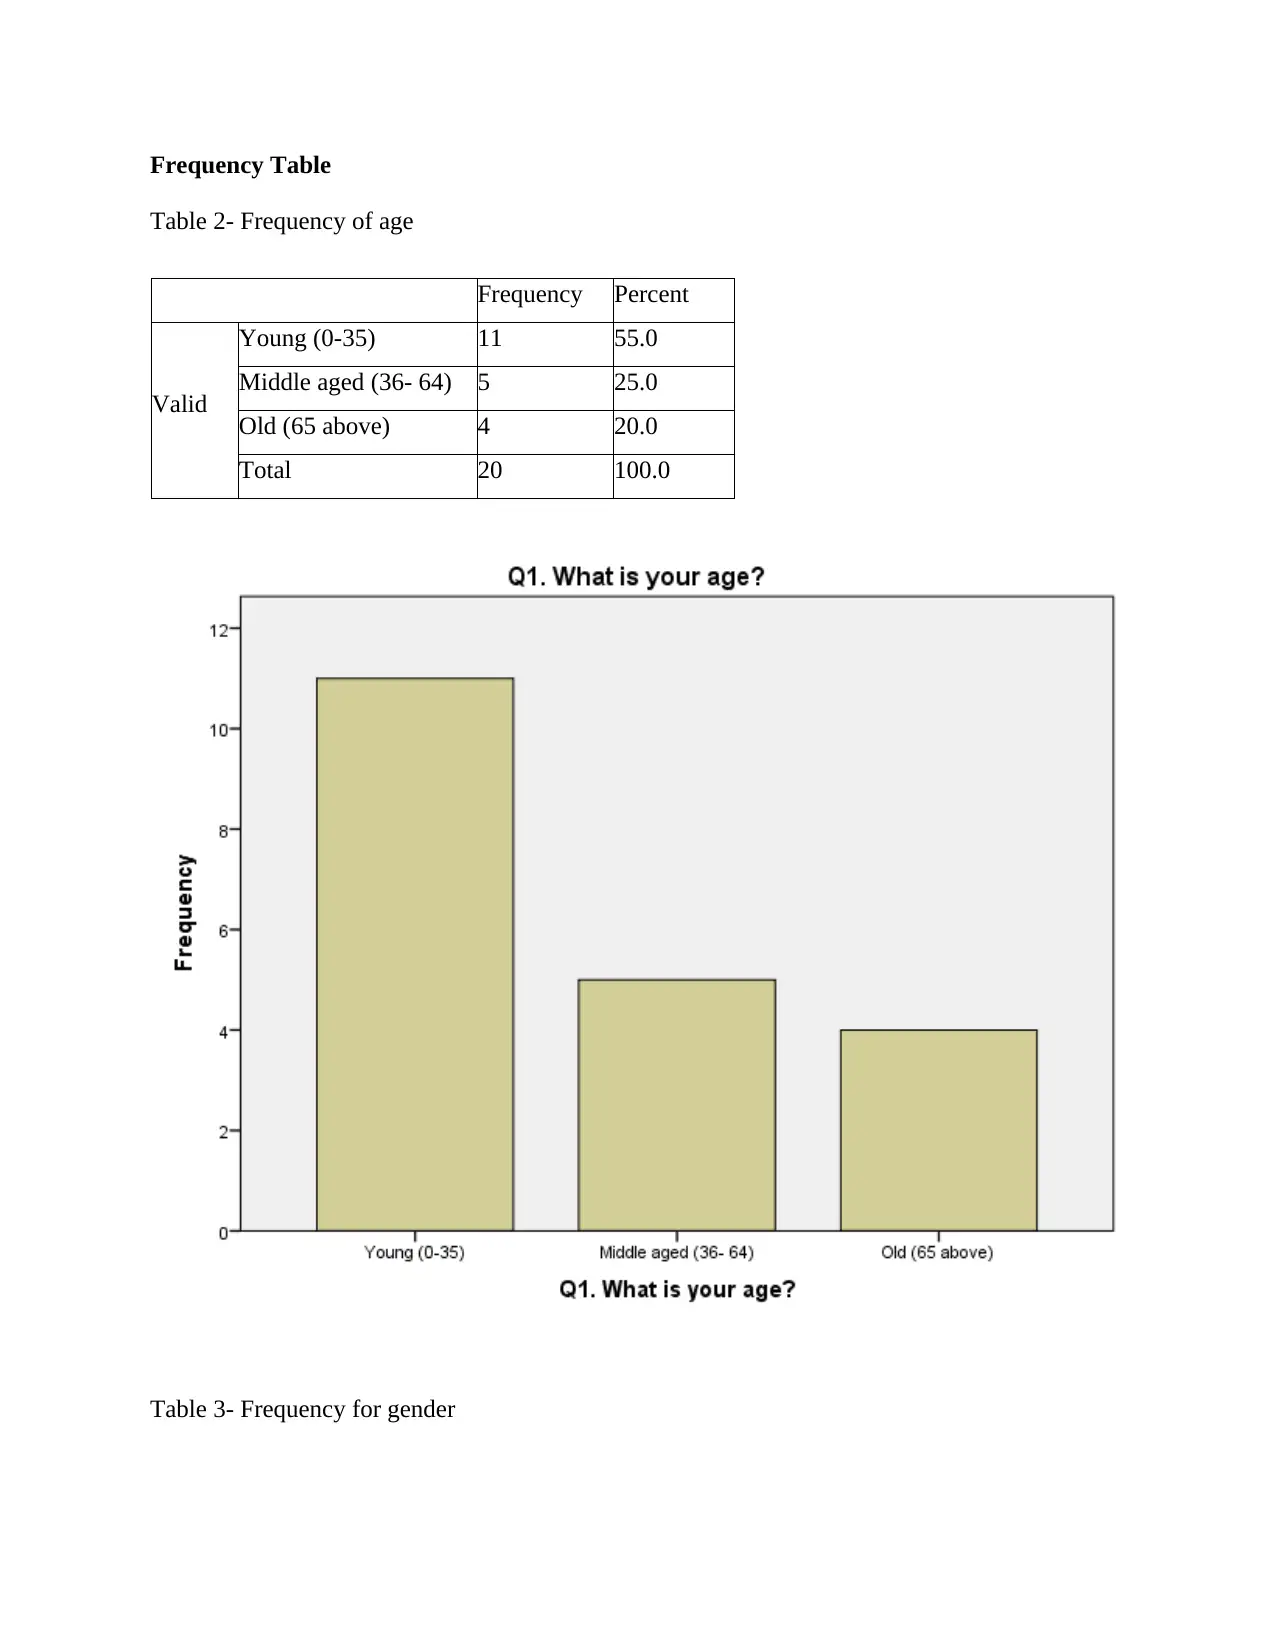
Frequency Table
Table 2- Frequency of age
Frequency Percent
Valid
Young (0-35) 11 55.0
Middle aged (36- 64) 5 25.0
Old (65 above) 4 20.0
Total 20 100.0
Table 3- Frequency for gender
Table 2- Frequency of age
Frequency Percent
Valid
Young (0-35) 11 55.0
Middle aged (36- 64) 5 25.0
Old (65 above) 4 20.0
Total 20 100.0
Table 3- Frequency for gender
⊘ This is a preview!⊘
Do you want full access?
Subscribe today to unlock all pages.
Trusted by 1+ million students worldwide
1 out of 46
Related Documents


Your All-in-One AI-Powered Toolkit for Academic Success.
+13062052269
info@desklib.com
Available 24*7 on WhatsApp / Email
![[object Object]](/_next/static/media/star-bottom.7253800d.svg)
Unlock your academic potential
Copyright © 2020–2026 A2Z Services. All Rights Reserved. Developed and managed by ZUCOL.