Quantitative Analysis for Marketing Management: IBM Customer Benchmark

Verified

Added on  2020/12/29

|34
|6028
|88
Report
AI Summary
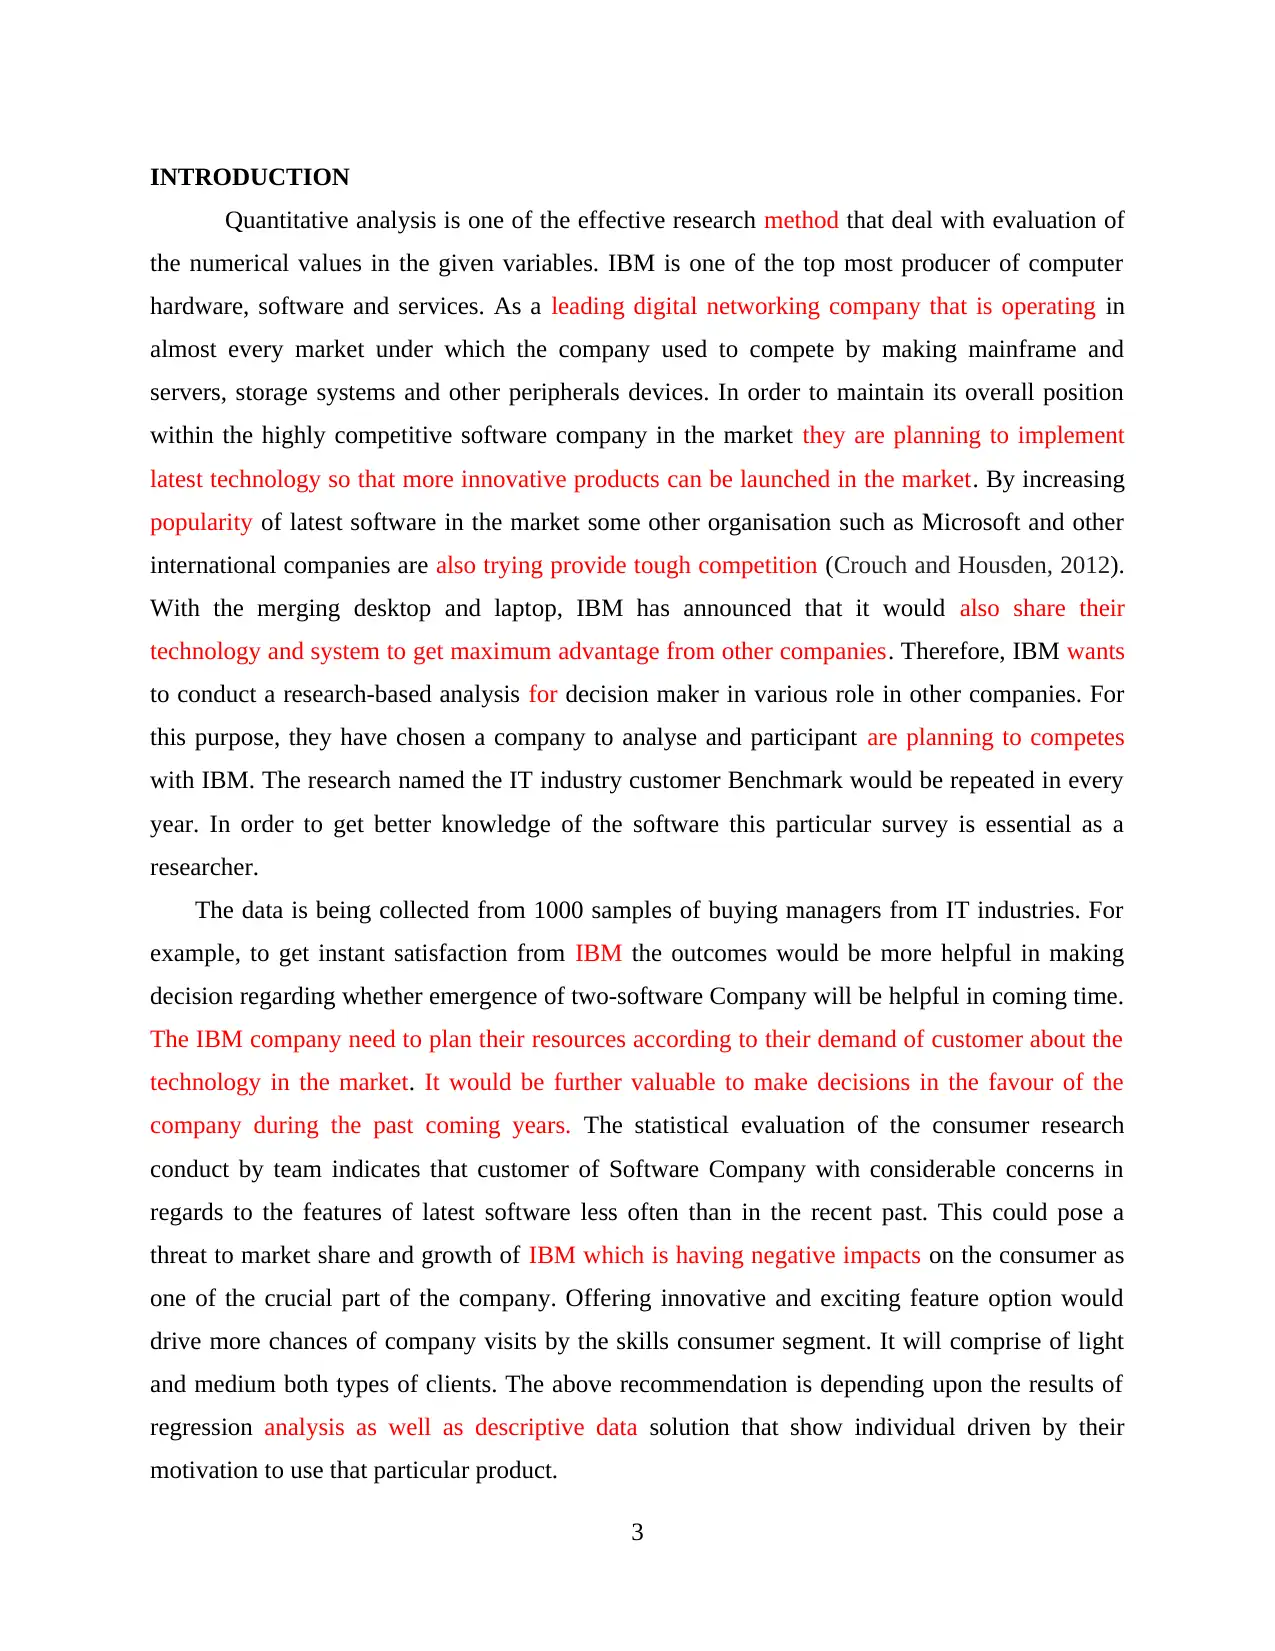
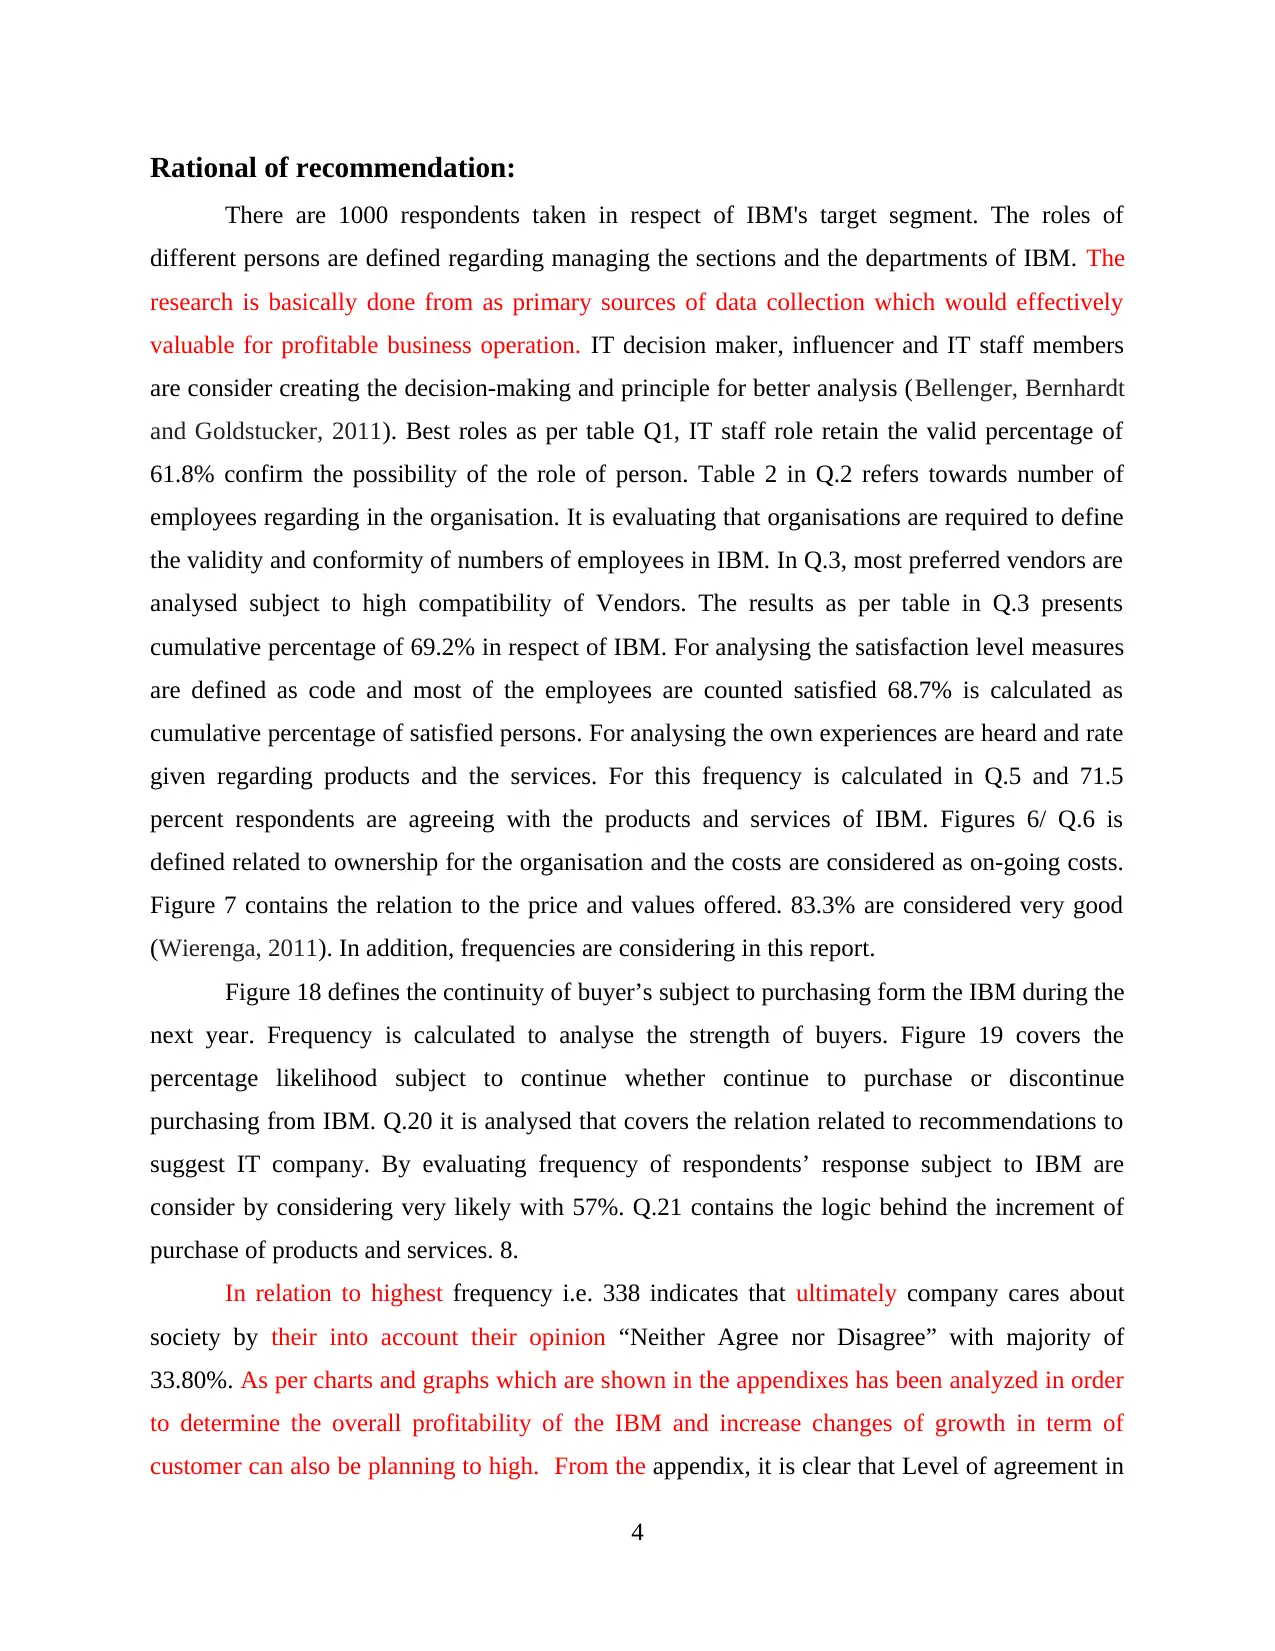
This report presents a quantitative analysis of IBM's marketing management, based on a customer benchmark study within the IT industry. The research, conducted on a sample of 1000 buying managers, investigates customer satisfaction, preferences, and market trends to inform IBM's strategic decisions. The analysis includes descriptive statistics, regression analysis, and graphical representations of the data collected through surveys. Key areas of focus include the roles of IT decision-makers, influencers, and staff; the number of employees within organizations; vendor preferences; satisfaction levels with IBM's products and services; and future purchase intentions. The report also explores customer perceptions regarding IBM's ethical conduct, innovation, leadership, financial stability, and advertising, providing valuable insights for IBM's competitive positioning and future growth strategies. The appendices contain detailed statistical results and visual aids, such as charts and graphs, to support the findings and recommendations.
Document Page
Quantitative Analysis
for Marketing
Management
1
tabler-icon-diamond-filled.svg

Paraphrase This Document

Need a fresh take? Get an instant paraphrase of this document with our AI Paraphraser
Document Page
Table of Contents
INTRODUCTION...........................................................................................................................3
Rational of recommendation:..........................................................................................................3
Graphs are prepared on the basis of given responses of respondents..............................................5
REFERENCES..............................................................................................................................19
APPENDICES...............................................................................................................................20
2
Document Page
INTRODUCTION
Quantitative analysis is one of the effective research method that deal with evaluation of
the numerical values in the given variables. IBM is one of the top most producer of computer
hardware, software and services. As a leading digital networking company that is operating in
almost every market under which the company used to compete by making mainframe and
servers, storage systems and other peripherals devices. In order to maintain its overall position
within the highly competitive software company in the market they are planning to implement
latest technology so that more innovative products can be launched in the market. By increasing
popularity of latest software in the market some other organisation such as Microsoft and other
international companies are also trying provide tough competition (Crouch and Housden, 2012).
With the merging desktop and laptop, IBM has announced that it would also share their
technology and system to get maximum advantage from other companies. Therefore, IBM wants
to conduct a research-based analysis for decision maker in various role in other companies. For
this purpose, they have chosen a company to analyse and participant are planning to competes
with IBM. The research named the IT industry customer Benchmark would be repeated in every
year. In order to get better knowledge of the software this particular survey is essential as a
researcher.
The data is being collected from 1000 samples of buying managers from IT industries. For
example, to get instant satisfaction from IBM the outcomes would be more helpful in making
decision regarding whether emergence of two-software Company will be helpful in coming time.
The IBM company need to plan their resources according to their demand of customer about the
technology in the market. It would be further valuable to make decisions in the favour of the
company during the past coming years. The statistical evaluation of the consumer research
conduct by team indicates that customer of Software Company with considerable concerns in
regards to the features of latest software less often than in the recent past. This could pose a
threat to market share and growth of IBM which is having negative impacts on the consumer as
one of the crucial part of the company. Offering innovative and exciting feature option would
drive more chances of company visits by the skills consumer segment. It will comprise of light
and medium both types of clients. The above recommendation is depending upon the results of
regression analysis as well as descriptive data solution that show individual driven by their
motivation to use that particular product.
3
Document Page
Rational of recommendation:
There are 1000 respondents taken in respect of IBM's target segment. The roles of
different persons are defined regarding managing the sections and the departments of IBM. The
research is basically done from as primary sources of data collection which would effectively
valuable for profitable business operation. IT decision maker, influencer and IT staff members
are consider creating the decision-making and principle for better analysis (Bellenger, Bernhardt
and Goldstucker, 2011). Best roles as per table Q1, IT staff role retain the valid percentage of
61.8% confirm the possibility of the role of person. Table 2 in Q.2 refers towards number of
employees regarding in the organisation. It is evaluating that organisations are required to define
the validity and conformity of numbers of employees in IBM. In Q.3, most preferred vendors are
analysed subject to high compatibility of Vendors. The results as per table in Q.3 presents
cumulative percentage of 69.2% in respect of IBM. For analysing the satisfaction level measures
are defined as code and most of the employees are counted satisfied 68.7% is calculated as
cumulative percentage of satisfied persons. For analysing the own experiences are heard and rate
given regarding products and the services. For this frequency is calculated in Q.5 and 71.5
percent respondents are agreeing with the products and services of IBM. Figures 6/ Q.6 is
defined related to ownership for the organisation and the costs are considered as on-going costs.
Figure 7 contains the relation to the price and values offered. 83.3% are considered very good
(Wierenga, 2011). In addition, frequencies are considering in this report.
Figure 18 defines the continuity of buyer’s subject to purchasing form the IBM during the
next year. Frequency is calculated to analyse the strength of buyers. Figure 19 covers the
percentage likelihood subject to continue whether continue to purchase or discontinue
purchasing from IBM. Q.20 it is analysed that covers the relation related to recommendations to
suggest IT company. By evaluating frequency of respondents’ response subject to IBM are
consider by considering very likely with 57%. Q.21 contains the logic behind the increment of
purchase of products and services. 8.
In relation to highest frequency i.e. 338 indicates that ultimately company cares about
society by their into account their opinion “Neither Agree nor Disagree” with majority of
33.80%. As per charts and graphs which are shown in the appendixes has been analyzed in order
to determine the overall profitability of the IBM and increase changes of growth in term of
customer can also be planning to high. From the appendix, it is clear that Level of agreement in
4
tabler-icon-diamond-filled.svg

Paraphrase This Document

Need a fresh take? Get an instant paraphrase of this document with our AI Paraphraser
Document Page
context of whether company is highly ethical, is Neither Agree nor Disagree with highest
frequency of 302. As per results, Company is leader in IT Industry because company has
agreement of level of “Agree”. Company is under the category of Innovative Company because
results of analysis points out that agreement of level is at “Agree” with highest frequency of 437.
Yes, company has strong capable senior leaders because analysis exhibits that highest frequency
i.e. 282 or 28.20% indicates Agree among levels of agreement.
According to the pie chat prepared in Appendix, it is clear that company is a financially
sound company because 39.70% of total respondent that is highest are agree with it. Around
maximum 41.43% of total respondents are agree on the statement that company is trustworthy.
As per the outputs of analysis, a total of 42.70% of those respondents are neither agree nor
disagree with the statement that “company has advertising I really like”. According to the
analysis of pie chart majority of respondents are at agreements level of “Don't Know”. Most of
the respondents (Maximum 42.30%) “Don't Know” whether company does its fair share to help
society. Analysis of pie-chart related to Rate of quality of the account representative or team
exhibits that actual rating cannot be determined because most of the respondent don't know about
answers of question regarding quality (Cambra-Fierro and Wilson, 2011). Overall quality of
products or services purchased are good as it has highest frequency in analysis. Majority of
respondents do not know about overall quality of non-technical customer services provided by
company. Due to unawareness of most of the respondents, it is not clear about overall quality of
training and education programs of company. As per analysis, quality of technical support is
undetermined because maximum number of respondent do not know about this question. Figures
27 and 28 are based upon some factors and response are evaluated because of scales.
Graphs are prepared on the basis of given responses of respondents
Q.1
5
Document Page
Q.2
Q.3
6
Document Page
Q.4
7
tabler-icon-diamond-filled.svg

Paraphrase This Document

Need a fresh take? Get an instant paraphrase of this document with our AI Paraphraser
Document Page
Q5:
Q6:
8
Document Page
Q7:
Q8:
Highest frequency i.e. 338 indicates that ultimate out of company cares about society is
“Neither Agree nor Disagree” with majority of 33.80%.
Q9:
9
Document Page
As per analysis done in Appendix it is clear that Level of agreement in the context of
whether company is highly ethical, is Neither Agree nor Disagree with highest frequency of 302.
Q10:
As per results, Company is leader in IT Industry because company has agreement of level
of “Agree”.
Q11:
10
tabler-icon-diamond-filled.svg

Paraphrase This Document

Need a fresh take? Get an instant paraphrase of this document with our AI Paraphraser
Document Page
Company is under the category of Innovative Company because results of analysis points
out that agreement of level is at “Agree” with highest frequency of 437.
Q12:
Yes, company has strong capable senior leaders because analysis exhibits that highest
frequency i.e. 282 or 28.20% indicates Agree among levels of agreement.
Q13:
11
Document Page
As pie chat prepared in Appendix it is clear that company is a Financially sound company
because 39.70% of total respondent which is highest, are agree with it.
Q14:
Around maximum 41.43% of total respondents are agree on the statement that company
id trustworthy.
Q15:
12
chevron_up_icon
1 out of 34
circle_padding
hide_on_mobile
zoom_out_icon
[object Object]