Quantitative Methods: Statistical Analysis and Applications
VerifiedAdded on 2023/06/05
|10
|1041
|217
Homework Assignment
AI Summary
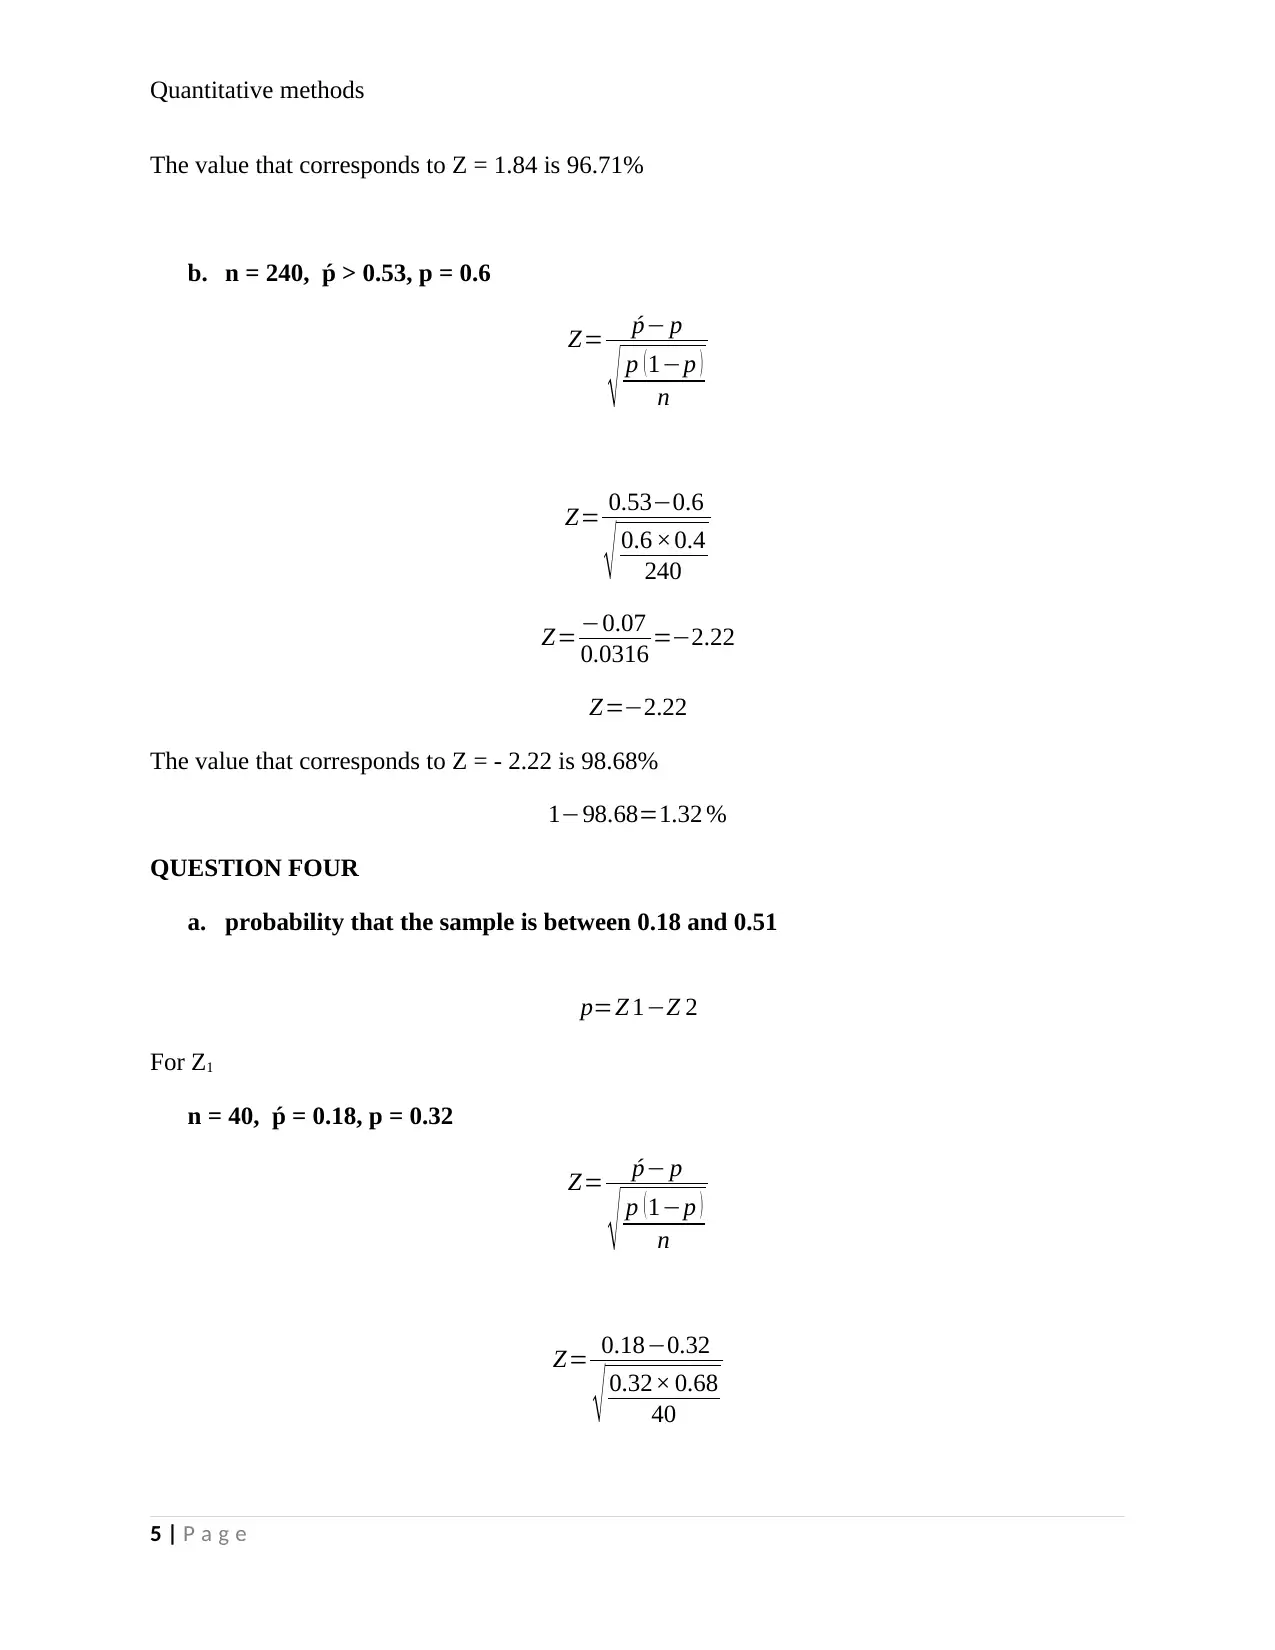
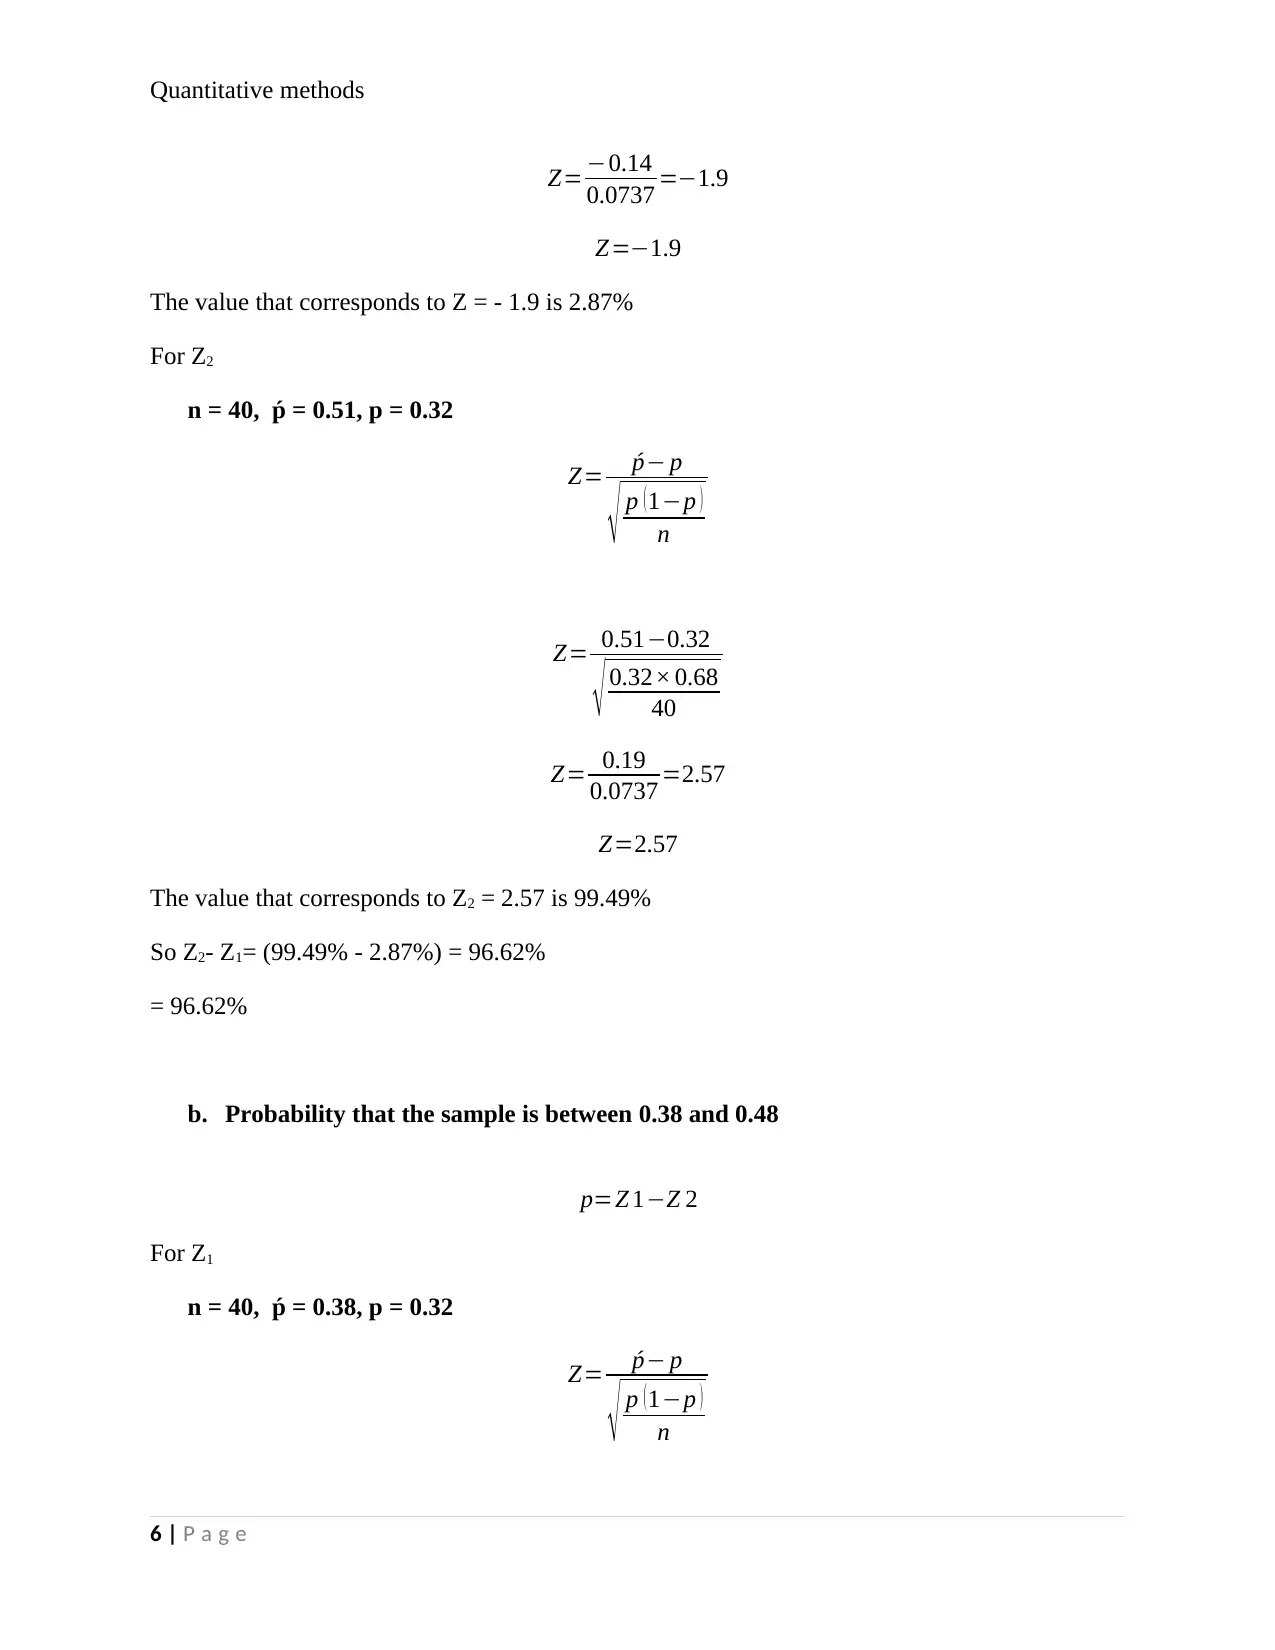
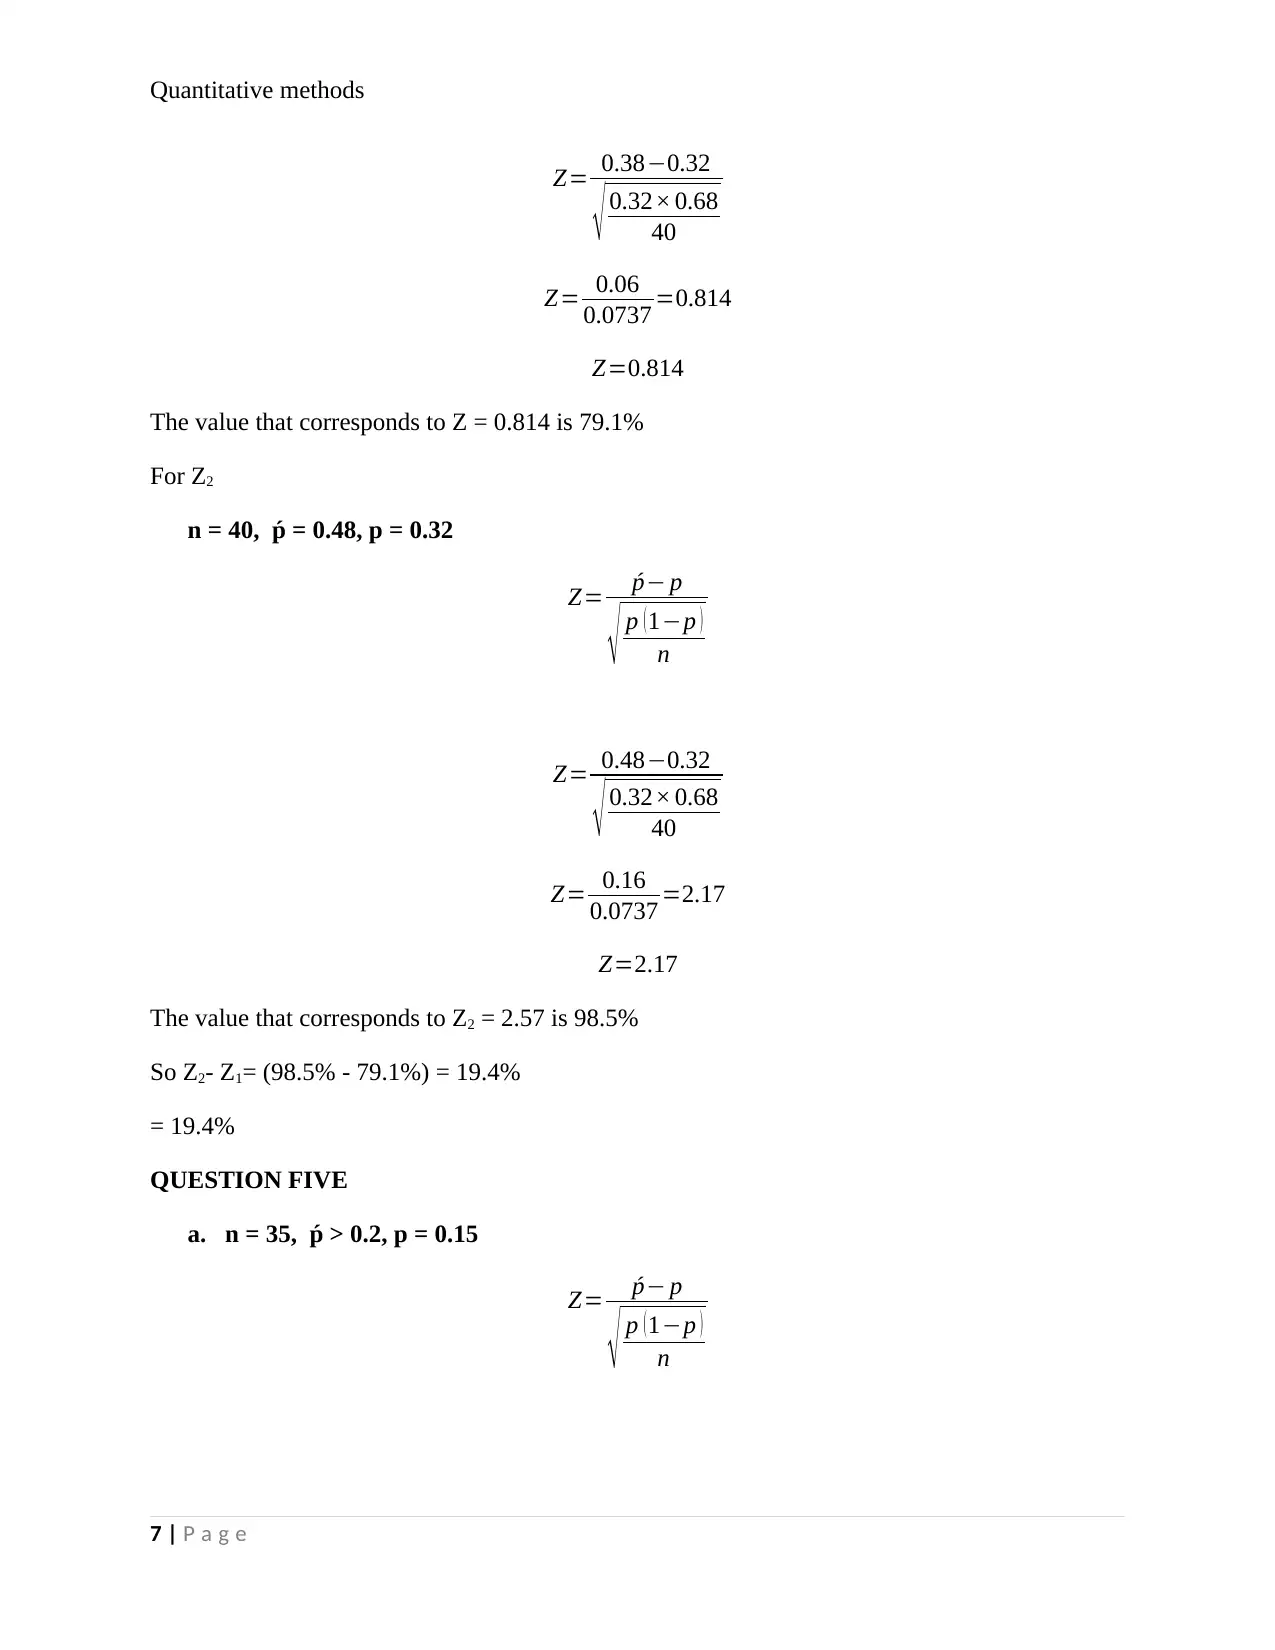
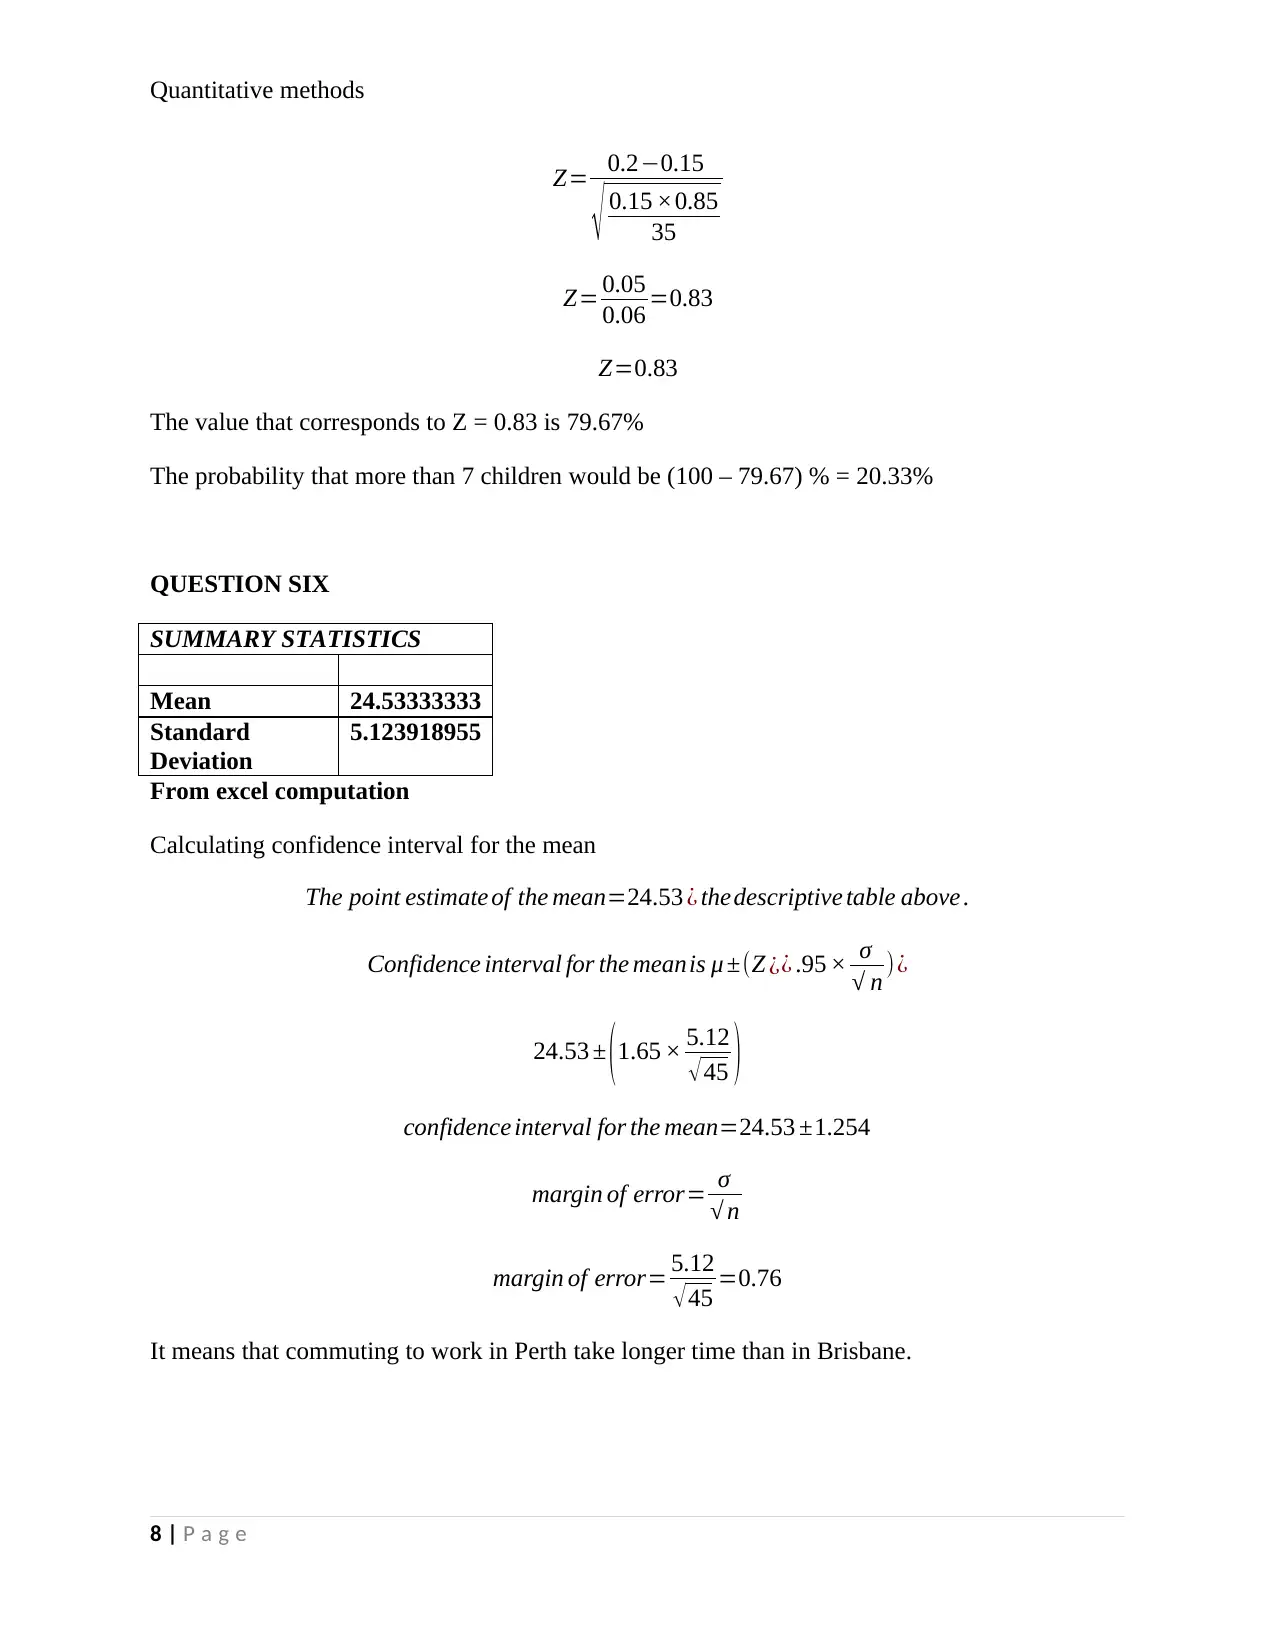
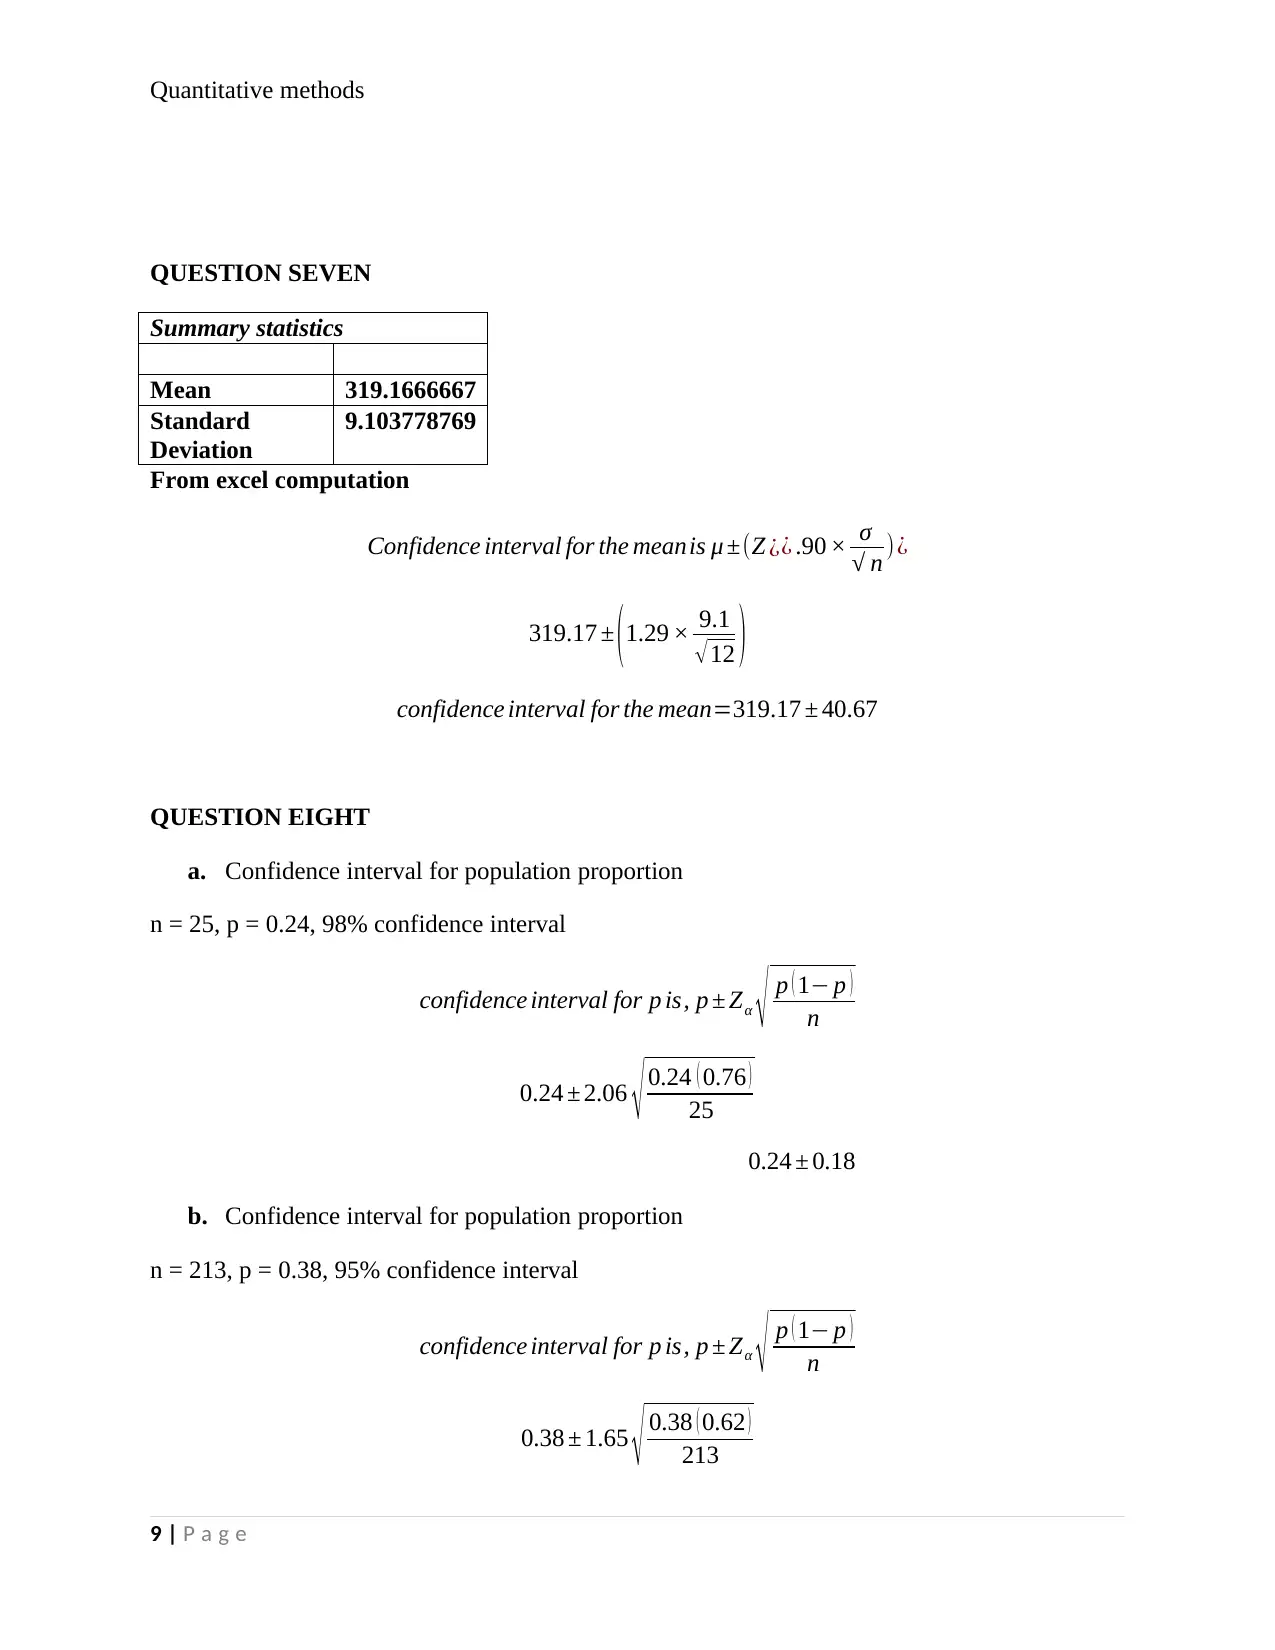
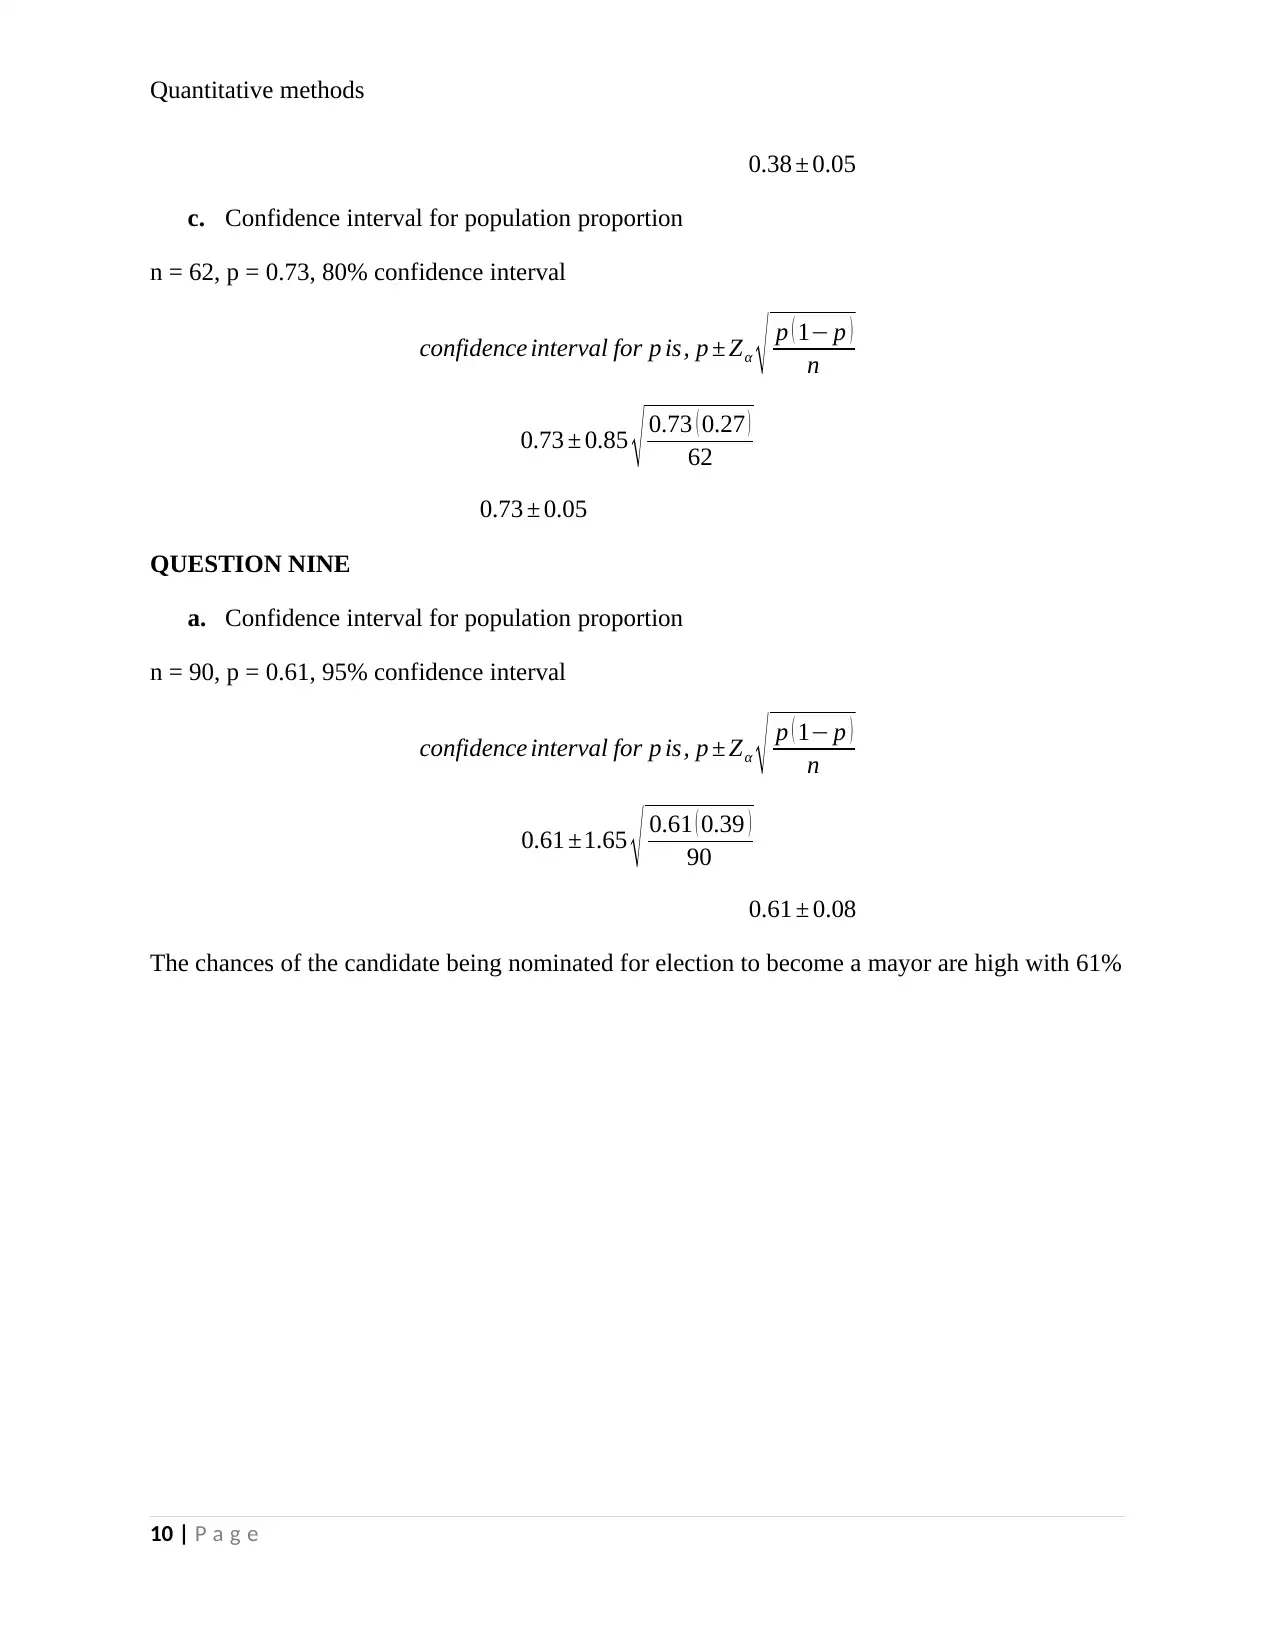
This assignment provides solutions to quantitative methods problems, focusing on statistical analysis and probability. It includes calculations for population means, standard deviations, Z-scores, and confidence intervals. The problems cover topics such as calculating probabilities for sample means, determining sample sizes, and constructing confidence intervals for population proportions. Detailed step-by-step solutions are provided for each question, demonstrating the application of statistical formulas and concepts. This document is useful for students seeking to understand and practice quantitative methods in statistics, and Desklib provides additional resources like past papers and solved assignments.

Quantitative methods
Student name:
Tutor name:
1 | P a g e
Quantitative methods
Student name:
Tutor name:
1 | P a g e
Paraphrase This Document
Need a fresh take? Get an instant paraphrase of this document with our AI Paraphraser

Quantitative methods
QUESTION ONE
Population mean = 150
Standard deviation = 21
Sample size, n = 49
a. p( x <147)
Z= x −μ
σ
Z=147−150
21
Z=−3
21 =−0.14
Z=−0.14
The probability corresponding to the Z-value is 44.43%
Thus p ( x<147 ) =44.43 %
b. p ( 152.5< x<157.5 )
p(x >152.5)
Z= x −μ
σ
Z=152.5−150
21
Z=2.5
21 =0.12
Z=0.12
The probability corresponding to the Z-value is 54.78%
p(x <157.5)
Z=157.5−150
21
2 | P a g e

Quantitative methods
Z=7.5
21 =0.36
Z=0.36
The probability corresponding to the Z-value is 64.06%
Therefore p ( 152.5<x< 157.5 ) =64.06 %−54.78 %=9.28 %
c.
p ( 148< x<158 )
p( x >148)
Z= x −μ
σ
Z=148−150
21
Z=−2.0
21 =−0.095
Z=−0.095
The probability corresponding to the Z-value is 46.41%
p( x <158)
Z=158−150
21
Z= 8
21 =0.38
Z=0.38
The probability corresponding to the Z-value is 64.8%
Therefore p ( 152.5<x< 157.5 ) =64.8 %−46.41%=18.39 %
3 | P a g e
⊘ This is a preview!⊘
Do you want full access?
Subscribe today to unlock all pages.

Trusted by 1+ million students worldwide

Quantitative methods
QUESTION TWO
μ=?
σ =12
n=81
x=300
Z valuethat corresponds ¿ 18 %=0.92
We know that Z= x −μ
σ
√ n
But making μ the subject of the formula, we have;
μ= x−
( Z × σ
√ n )
μ=300− (0.92× 12
9 )
μ=300−1.22
μ=298.78
QUESTION THREE
a. n = 100, ṕ < 0.69, p = 0.6
Z= ṕ− p
√ p ( 1−p )
n
Z= 0.69−0.6
√ 0.6 ×0.4
100
Z= 0.09
0.04899 =1.84
Z=1.84
4 | P a g e
Paraphrase This Document
Need a fresh take? Get an instant paraphrase of this document with our AI Paraphraser

Quantitative methods
The value that corresponds to Z = 1.84 is 96.71%
b. n = 240, ṕ > 0.53, p = 0.6
Z= ṕ− p
√ p ( 1−p )
n
Z= 0.53−0.6
√ 0.6 ×0.4
240
Z= −0.07
0.0316 =−2.22
Z=−2.22
The value that corresponds to Z = - 2.22 is 98.68%
1−98.68=1.32 %
QUESTION FOUR
a. probability that the sample is between 0.18 and 0.51
p=Z 1−Z 2
For Z1
n = 40, ṕ = 0.18, p = 0.32
Z= ṕ− p
√ p ( 1−p )
n
Z= 0.18−0.32
√ 0.32× 0.68
40
5 | P a g e

Quantitative methods
Z= −0.14
0.0737 =−1.9
Z=−1.9
The value that corresponds to Z = - 1.9 is 2.87%
For Z2
n = 40, ṕ = 0.51, p = 0.32
Z= ṕ− p
√ p ( 1−p )
n
Z= 0.51−0.32
√ 0.32× 0.68
40
Z= 0.19
0.0737 =2.57
Z=2.57
The value that corresponds to Z2 = 2.57 is 99.49%
So Z2- Z1= (99.49% - 2.87%) = 96.62%
= 96.62%
b. Probability that the sample is between 0.38 and 0.48
p=Z 1−Z 2
For Z1
n = 40, ṕ = 0.38, p = 0.32
Z= ṕ− p
√ p ( 1−p )
n
6 | P a g e
⊘ This is a preview!⊘
Do you want full access?
Subscribe today to unlock all pages.

Trusted by 1+ million students worldwide

Quantitative methods
Z= 0.38−0.32
√ 0.32× 0.68
40
Z= 0.06
0.0737 =0.814
Z=0.814
The value that corresponds to Z = 0.814 is 79.1%
For Z2
n = 40, ṕ = 0.48, p = 0.32
Z= ṕ− p
√ p ( 1−p )
n
Z= 0.48−0.32
√ 0.32× 0.68
40
Z= 0.16
0.0737 =2.17
Z=2.17
The value that corresponds to Z2 = 2.57 is 98.5%
So Z2- Z1= (98.5% - 79.1%) = 19.4%
= 19.4%
QUESTION FIVE
a. n = 35, ṕ > 0.2, p = 0.15
Z= ṕ− p
√ p ( 1−p )
n
7 | P a g e
Paraphrase This Document
Need a fresh take? Get an instant paraphrase of this document with our AI Paraphraser

Quantitative methods
Z= 0.2−0.15
√ 0.15 ×0.85
35
Z= 0.05
0.06 =0.83
Z=0.83
The value that corresponds to Z = 0.83 is 79.67%
The probability that more than 7 children would be (100 – 79.67) % = 20.33%
QUESTION SIX
SUMMARY STATISTICS
Mean 24.53333333
Standard
Deviation
5.123918955
From excel computation
Calculating confidence interval for the mean
The point estimate of the mean=24.53 ¿ thedescriptive table above .
Confidence interval for the meanis μ ±(Z ¿¿ .95 × σ
√ n )¿
24.53 ± (1.65 × 5.12
√45 )
confidence interval for the mean=24.53 ±1.254
margin of error= σ
√ n
margin of error= 5.12
√45 =0.76
It means that commuting to work in Perth take longer time than in Brisbane.
8 | P a g e

Quantitative methods
QUESTION SEVEN
Summary statistics
Mean 319.1666667
Standard
Deviation
9.103778769
From excel computation
Confidence interval for the meanis μ ±(Z ¿¿ .90 × σ
√ n )¿
319.17 ± (1.29 × 9.1
√12 )
confidence interval for the mean=319.17 ± 40.67
QUESTION EIGHT
a. Confidence interval for population proportion
n = 25, p = 0.24, 98% confidence interval
confidence interval for p is, p ± Zα √ p ( 1− p )
n
0.24 ± 2.06 √ 0.24 ( 0.76 )
25
0.24 ± 0.18
b. Confidence interval for population proportion
n = 213, p = 0.38, 95% confidence interval
confidence interval for p is, p ± Zα √ p ( 1− p )
n
0.38 ± 1.65 √ 0.38 ( 0.62 )
213
9 | P a g e
⊘ This is a preview!⊘
Do you want full access?
Subscribe today to unlock all pages.

Trusted by 1+ million students worldwide

Quantitative methods
0.38 ± 0.05
c. Confidence interval for population proportion
n = 62, p = 0.73, 80% confidence interval
confidence interval for p is, p ± Zα √ p ( 1− p )
n
0.73 ± 0.85 √ 0.73 ( 0.27 )
62
0.73 ± 0.05
QUESTION NINE
a. Confidence interval for population proportion
n = 90, p = 0.61, 95% confidence interval
confidence interval for p is, p ± Zα √ p ( 1− p )
n
0.61 ±1.65 √ 0.61 ( 0.39 )
90
0.61 ± 0.08
The chances of the candidate being nominated for election to become a mayor are high with 61%
10 | P a g e
1 out of 10

Your All-in-One AI-Powered Toolkit for Academic Success.
+13062052269
info@desklib.com
Available 24*7 on WhatsApp / Email
Unlock your academic potential
Copyright © 2020–2025 A2Z Services. All Rights Reserved. Developed and managed by ZUCOL.